
This tutorial is about how you can run time intelligence calculations over custom calendars in Power BI. You may watch the full video of this tutorial at the bottom of this blog.
This is really relevant to those who deal with 445 calendars, which is a very common scenario for Power BI users.
Not all businesses out there work to a standard calendar around financial years or calendar years. Sometimes all you have to work with is a customized 445 calendar. In this tutorial, I explain how you can start solving some of the time intelligence type analysis in Power BI with these custom calendars.

Unfortunately, you can’t utilize the built-in time intelligence features in the DAX language. They only work with standard calendars.
In this particular example, I will show you how to work out month on month change.
The techniques I go through also enable you, with some minor formula adjustments, to work out a week on week, quarter on quarter, or similar calculations of that nature.
But before we get there, we have to implement some logic, which is a little bit tougher, and it’s actually computing for the previous month sales.
Solve For Previous Month Sales
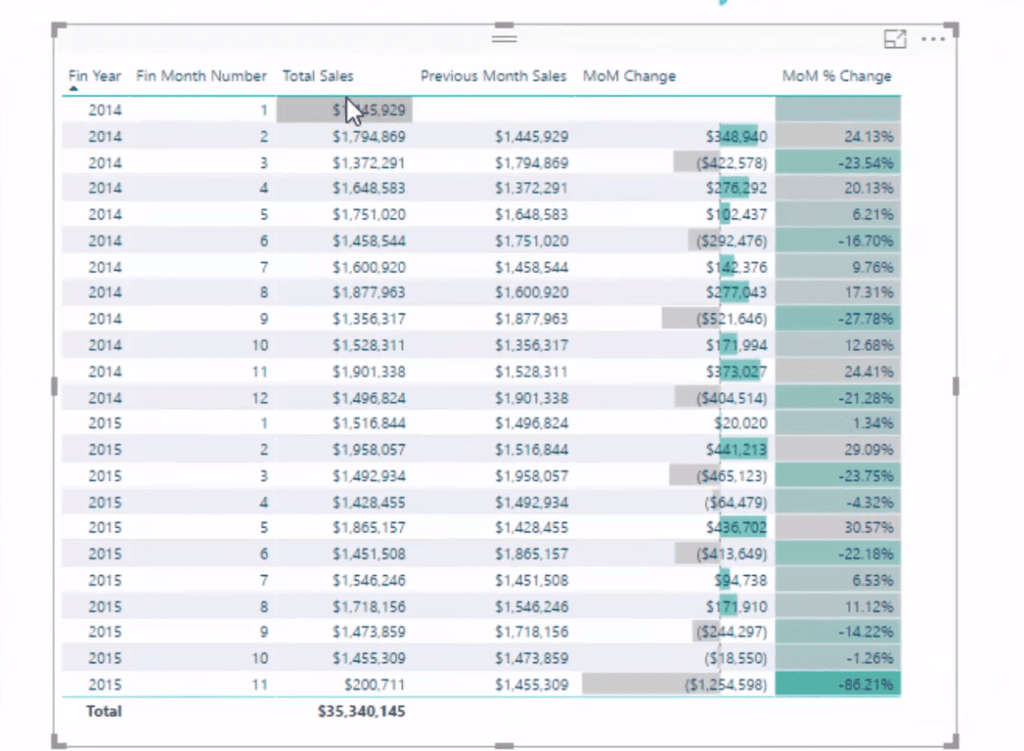
First, let’s look at our table here. We have our Total Sales, which is a very simple calculation.

We simply put it in a particular context from our customer calendar. So we have Fin Year and Fin Month, and then it automatically filters the underlying fact table. And that gives us our Total Sales amount.
However, in this table on the left hand side, there’s a bit of an issue. We see here our Fin Month Number; but when we get to the end – the last week of the financial year of this particular calendar – the last day is 27th of April. It then jumps into the new financial year, but it’s not even in the new month.

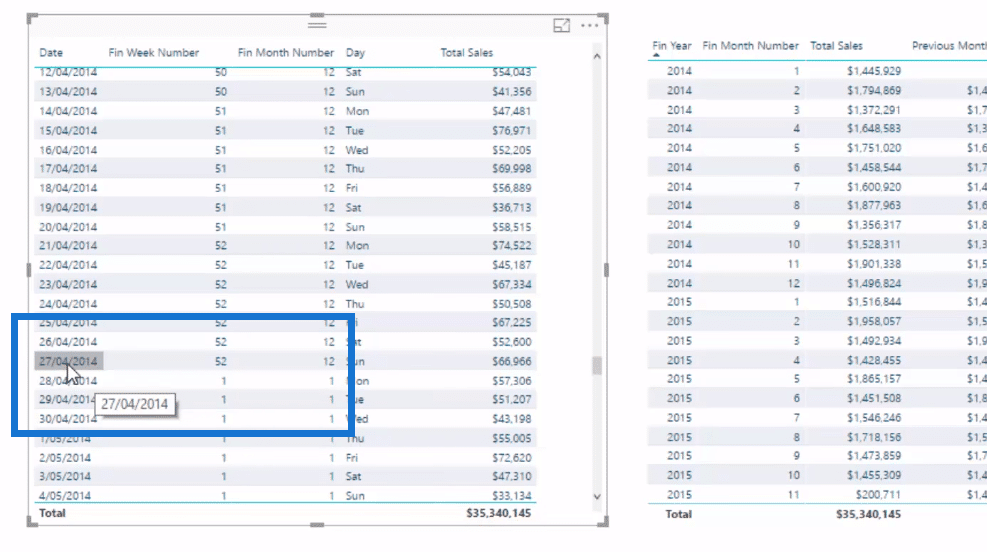
This is where it gets a bit confusing. That’s why we have to build some logic to get the Previous Month Sales. We can’t just look at any particular month. In this case, we have to look at a particular number and work with this Financial Month Number column.
So I’m going to walk you through the formula, so you can get a good understanding of it.
Walk Through The Formula
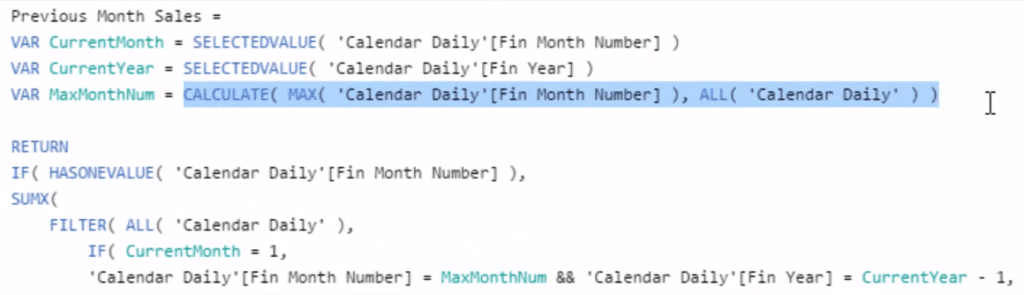
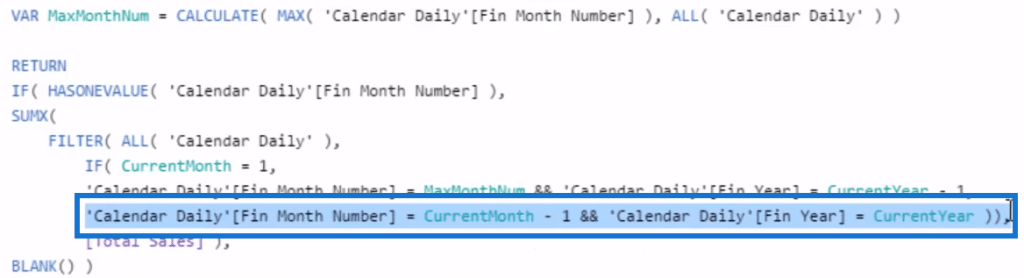
I’ve used Variables (VAR) in this calculation and I highly recommend it, because Variables enable us to break down these formulas.
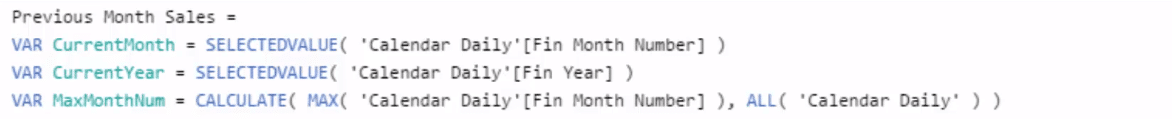
First of all, we need to work out the Current Month that we are in, in any particular context, and that’s what the SELECTEDVALUE does. For example, if we are on the tenth month of 2014, that’s going to return the number 10.
If we look at the Current Year, it’s does exactly the same thing, while the MaxMonthNum literally works out the maximum month number. So we’re looking at the MAX Financial Month number across all of our calendar table, which is basically going to return the number twelve.
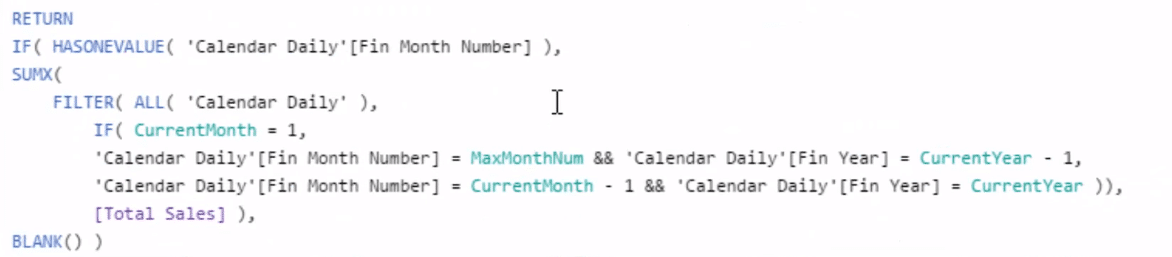
Now let’s focus on the core measure here, which uses the SUMX function. This formula sums up the Total Sales, but in a different context.
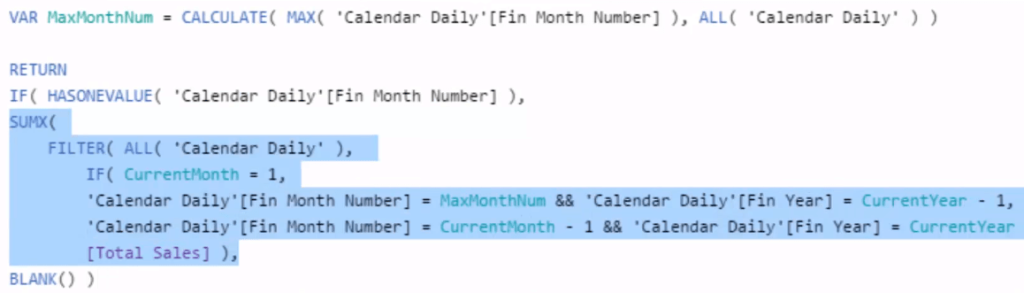
Logically, we’re trying to jump back to the previous financial year month and grab that number and bring it into the current context.
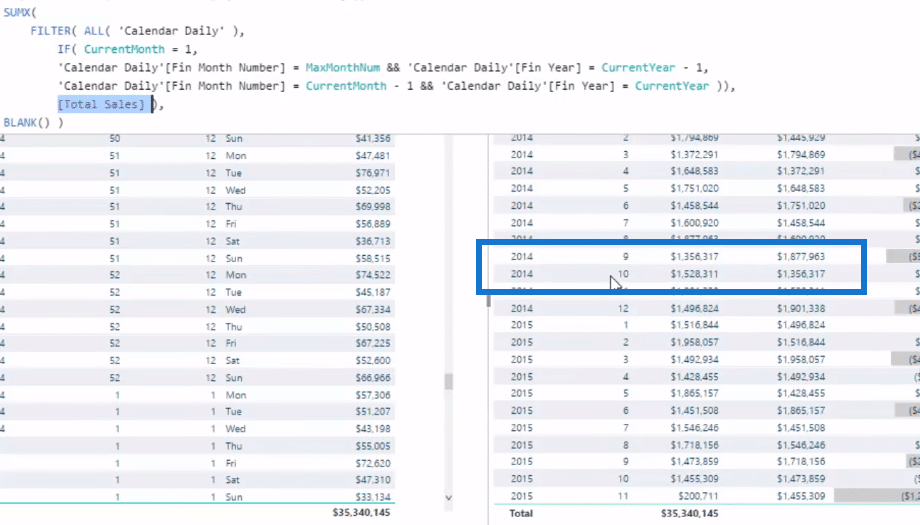
For example, in the row below, we have 2014 with month 10. We need to jump back to month 9 and drag this number ($1.356M) into the tenth month, which is exactly what this logic in this formula is doing.
This formula is looking through the Calendar table, and if the Current Month is 1, then it will find the 12th month of the year before because that’s where we have to go and work out this dynamic calculation, MaxMonthNum.
In theory, we could just write 12 here because there’s always 12 months, but this is just another way to dynamically do it. We could use a similar technique if we’re doing a Week on Week change, for example.
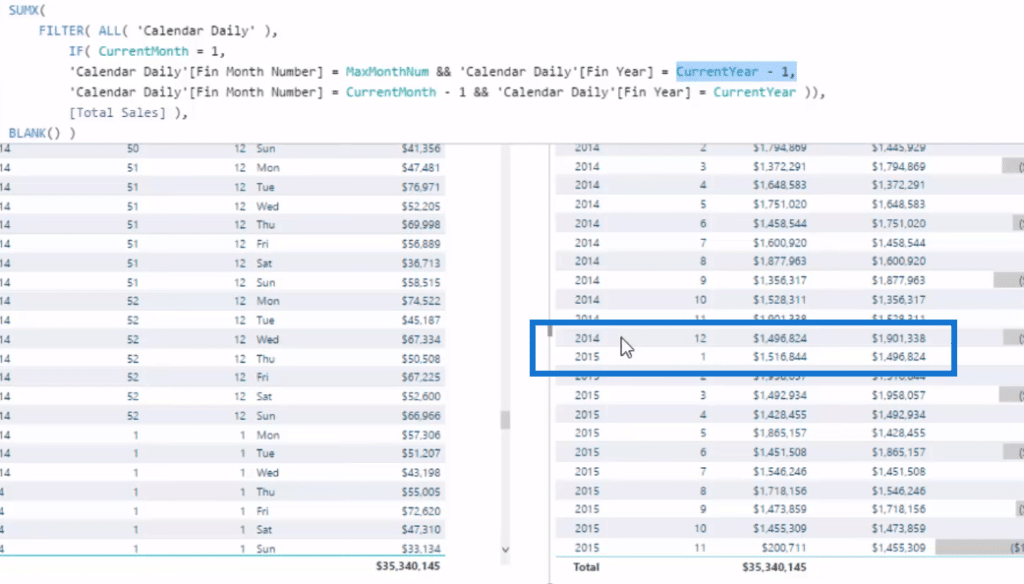
This is going to evaluate to 12, but then we jump back and look at the year before. So if we’re in 2015 month one, we want to jump back to the twelfth month in 2014. And that’s how we drag that number down.
And if it’s not the first month, we jump back in the current year back one month, and that’s what this line of the calculation shows.
This may look a bit more complicated than it actually is, but it’s just a matter of getting your head around a few different formulas.
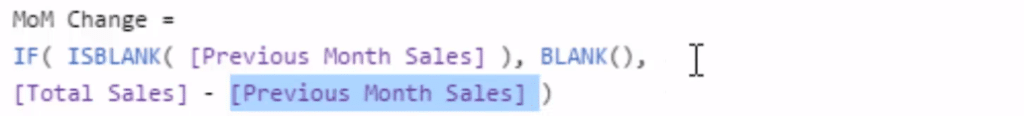
Now once we have our Previous Month Sales calculation, we can calculate our Month on Month Change. All we have to do is subtract Previous Month Sales from Total Sales. We put a BLANK logic to blank out those with no previous month sales.
From here, we can get the Month on Month Percentage Change. We simply divide Month on Month Change by the Previous Month Sales.


So that’s how we work out a Month on Month Change for a custom calendar.
***** Related Links *****
Time Intelligence For Non Standard Date Tables In Power BI
Sorting Dates By Financial Year In Power BI
Measure Branching – The Most Important Concept When Using DAX In Power BI
Conclusion
I hope with this tutorial, you can get a grasp of how to run time intelligence calculations for custom calendars and be able to apply it on your own data models.
It’s definitely worthwhile reviewing all these formulas in depth. There’s a little bit more to them, it’s just unfortunate that it’s not as easy as the time intelligence calculations for standard calendars.
The good news is that if you can understand how to implement these techniques, doing any time comparison work within Power BI will become much easier for you, especially if you have to deal with more customized calendars in your own data sets.
Cheers!
Sam
[youtube https://www.youtube.com/watch?v=Rj5JbAYXHAg?rel=0&w=784&h=441]


