
In this blog post, I’m going to show you how you can create a new table in Power BI that is purely based on historical information and complete it in an automatic way. You may watch the full video of this tutorial at the bottom of this blog.
When you create budgets and forecasts, sometimes you may have to go through a very comprehensive process. I’m going to demonstrate a simpler and more efficient method here.
I’m also going to show how you can create some automatic budgets with your data.
Instead of having to generate this in Excel, you can create some budget/forecast data using the historical information you already have.

How To Create A New Table In Power BI
We’re going to discuss how you can use the table feature in Power BI to generate tables automatically and then add some logic to them.
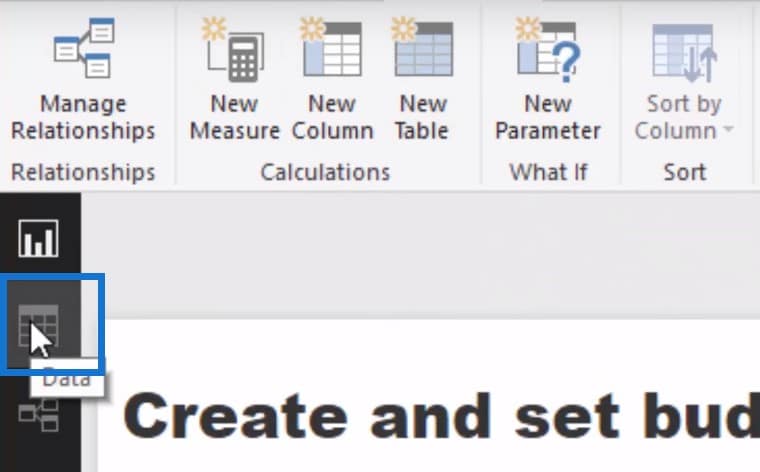
First, we click on the data table icon can we can see the actual overall results.
We will then click on New Table and then name it as Regional Budget.
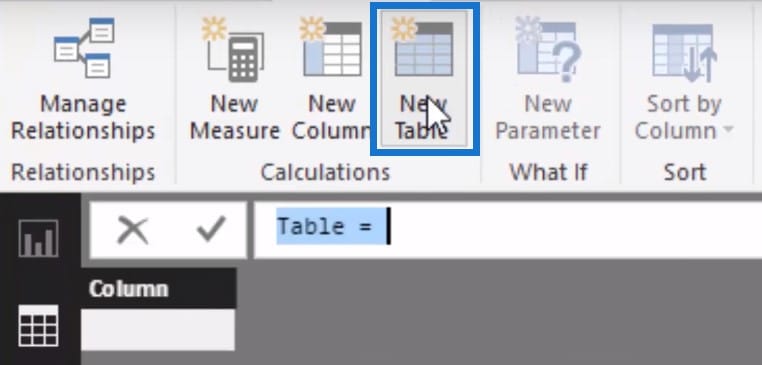
Remember that a table function has to have a table formula. We’re trying to create budgets but we also need to divide the budgets by something. In this case, we’re going to divide it by state.
1. Building A Table Using ADDCOLUMNS
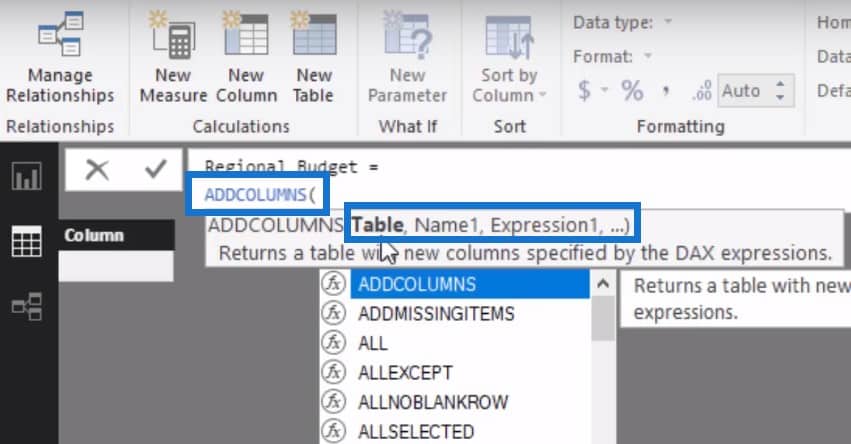
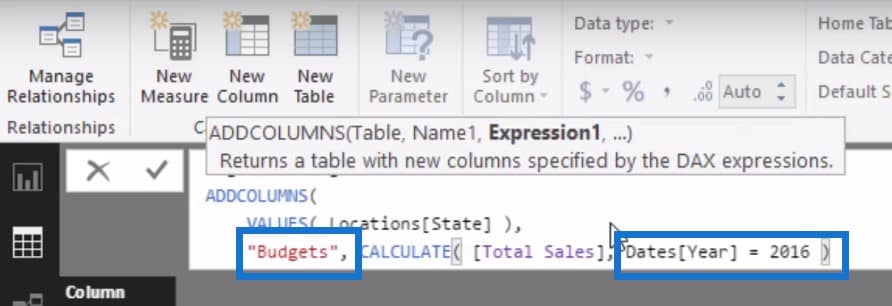
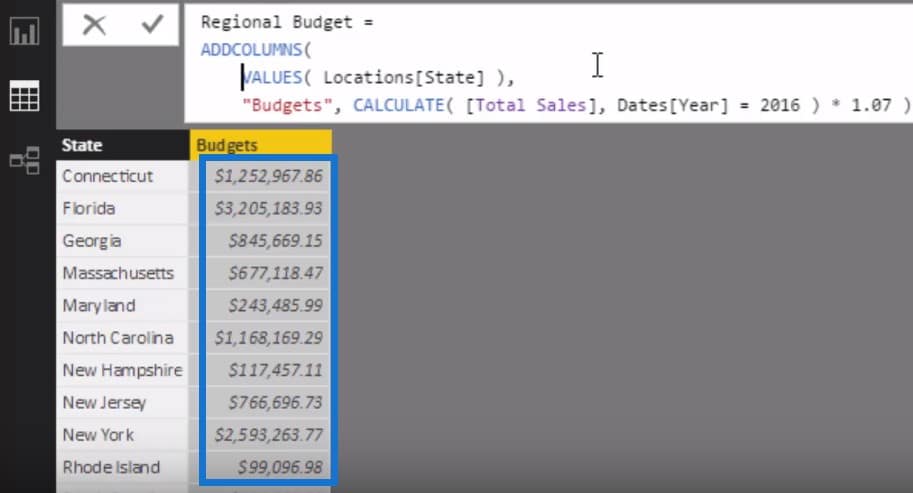
We’re going to use a table function called ADDCOLUMNS, which will then ask us for a TABLE, NAME, and EXPRESSION.
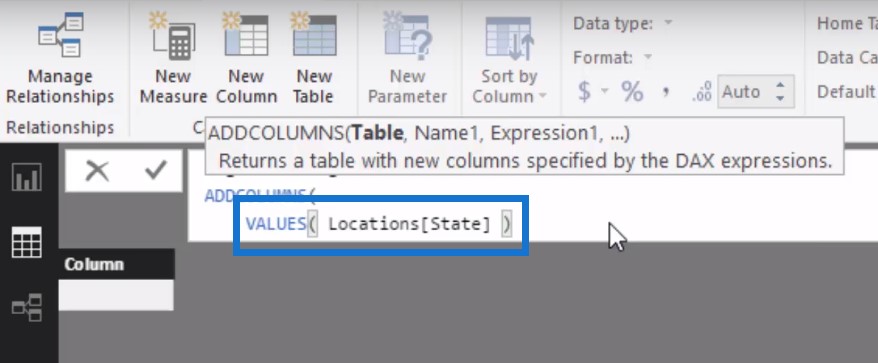
For the Table parameter, we will use our State dimension. We’re going with the VALUES function here, so that the State column will give us one column for each state referenced.

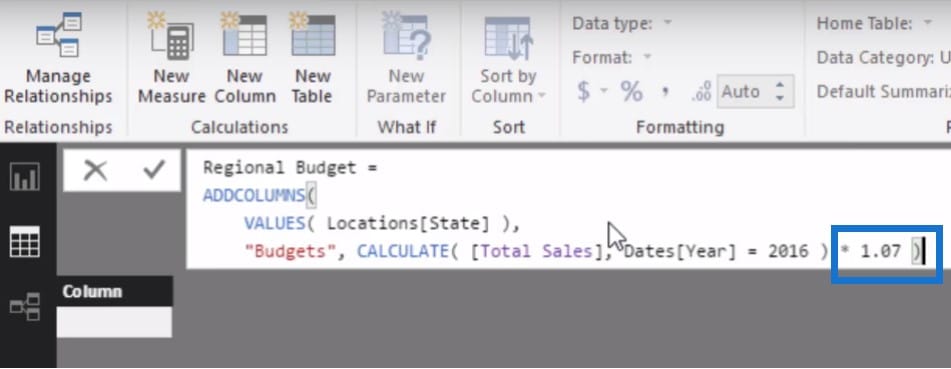
As for the Name parameter, we’re going with Budgets. We can get our budgets through a number of different ways, right? But in this case, what we’re going to do is grab 2016’s budget numbers by using this formula:
So let’s say we’ll increase our revenues from 2016. We’re ambitious and we’re a growing company, so we are going to increase our revenue from 2016 for each state by 7%.
Once we click ok, we can see the static numbers that have been extrapolated from the results of 2016, but with additional factor (% increase) in it after we have increased it by a certain amount.
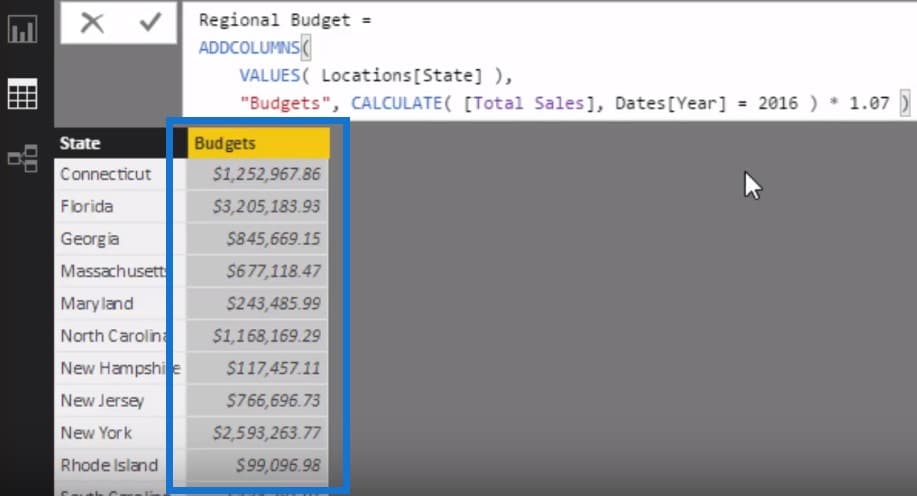
So now that our regional budget table has been set, we can now visualize it together with the rest of our data.
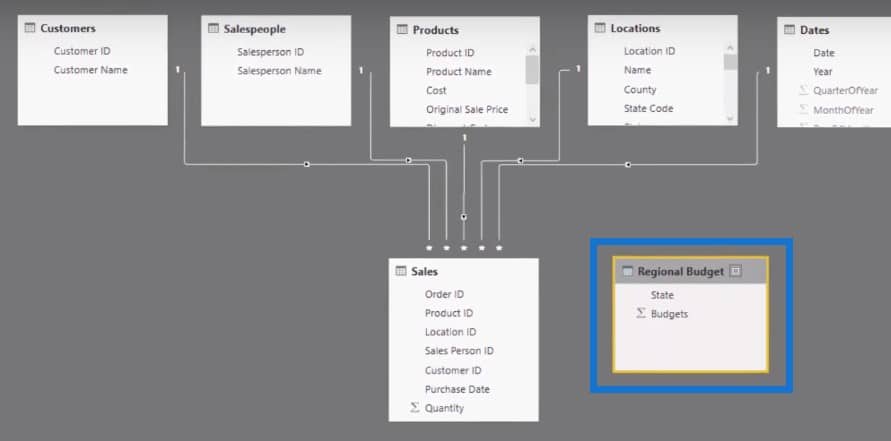
Historically, you would have likely pulled this data from your database or Excel, but with Power BI, you can generate this automatically now.
2. Building a Table Using CROSSJOIN
Some of you might say, “Well, my budget is a whole lot more complex than that.” Most of the time, they are indeed a lot more complicated so I’m going to show you how to add more complexity to the budgets or forecasts that you may have.
Let’s say we’ve analyzed our sales information and we have to distribute the 2016 numbers in the box below across an entire year.
When you sell something, there is always some seasonality involved in the numbers. So we want the yearly budgets per state broken down by month.
How do we achieve this? What we can do is build a table and then add some logic to it.
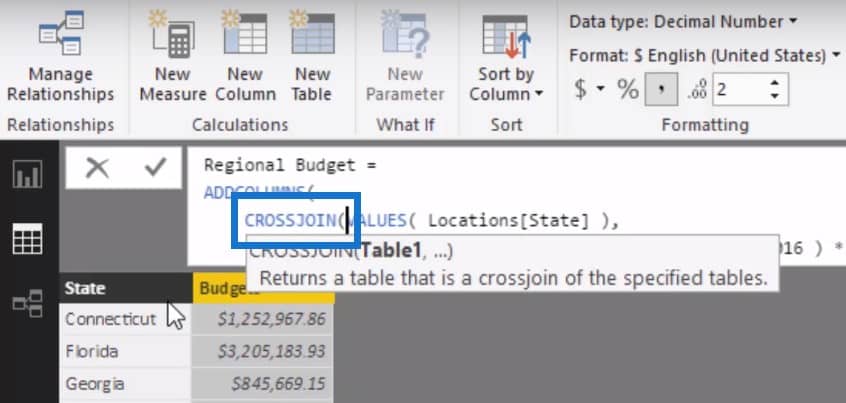
So we’re going to use this function called CROSSJOIN which will make the initial table slightly different.
Then we’re going to add VALUES and [MonthName] column here.
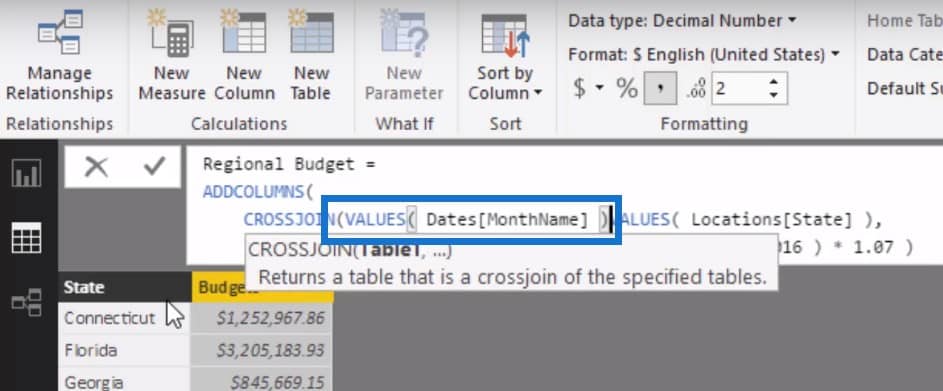
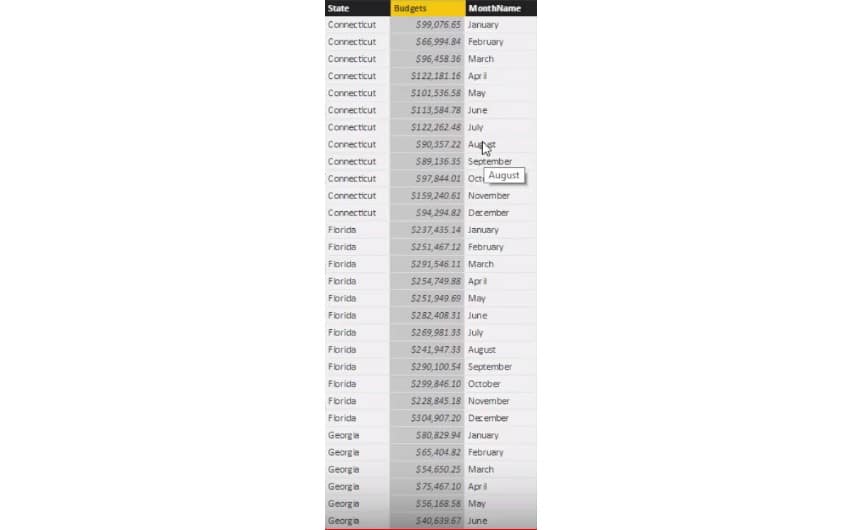
What CROSSJOIN will do is give me one row for each combination that is possible with these two particular columns: month and state.
So the initial table is now bigger. It is still creating a budget based on the logic we previously applied, but it is also creating every combination possible between these two columns.
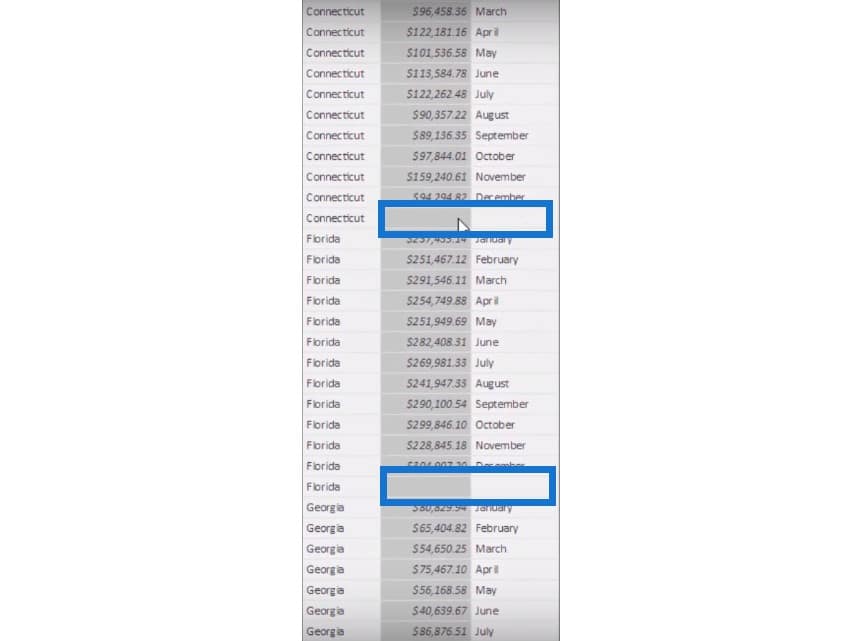
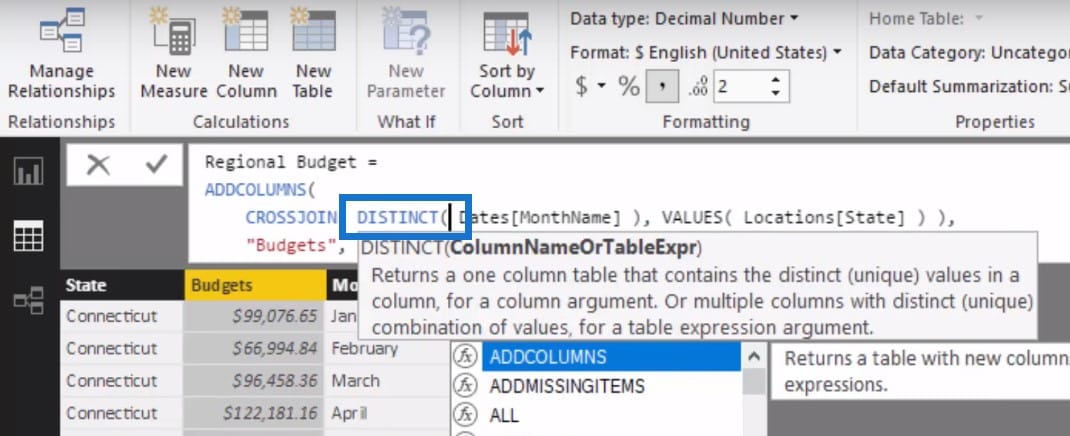
3. Getting Rid Of The Blank Value
You’ll notice, there is one remaining issue here. The blank spaces between the months have something to do with the [MonthName] column.
VALUES sometimes returns a blank value, so we can get rid of that by replacing it with the function DISTINCT. This removes the blank values and gives us a much cleaner table.

We can see now that each region and each month has an individual budget. We can also clearly see the seasonality impact of the different regions we sell to.
***** Related Links*****
Budgeting Scenarios In Power BI Using DAX
How To Calculate Actual Results To Budgets Per Product – Power BI & DAX
How To Create Budgets Which Have Seasonality Adjustments – Power BI Technique
Conclusion
To round things up, we have discussed how we can create a table in Power BI. We also discussed how to add complexity by generating new tables using table functions.
Instead of going to Excel to create a table and having to fill out the budgets, we can simply generate it from Power BI based on numbers we already have.
The great thing about this is it is going to occur in an automated way. We can just refresh and then we’ll be able to extract the budget information.
There are lots of different ways you can use these functions. It does not have to be something to do with budgets; it can be forecasts, benchmarks, and lots of other things.
For many more budgeting and forecasting techniques and tips to use within Power BI, check out the below module located at Enterprise DNA Online. This one module is stacked with content covering nearly all potential scenarios you may have to deal with in Power BI around these topics
Enjoy,
Sam


