This Power BI Showcase will focus on a comprehensive manufacturing operations report that effectively presents the overall performance of a product-inclined business. You may watch the full video of this tutorial at the bottom of this blog.
Particularly, we’ll be using a business model that manufactures parts for airplane wings. We’re going to look at the entire manufacturing processing data for this organization.
Operations Summary
The first report shows a summary of the business’ key measures and metrics.
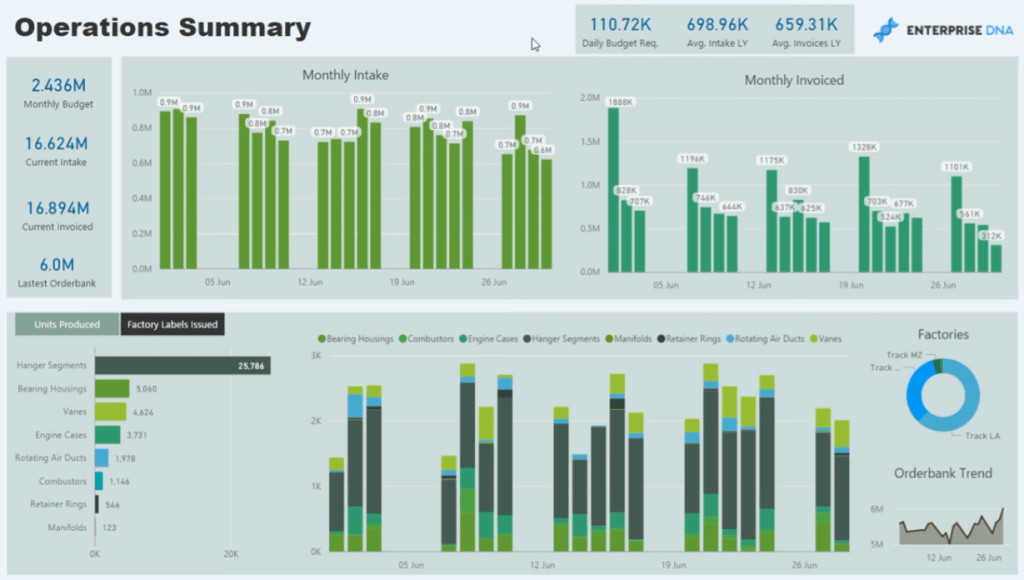
We can look at monthly intake versus our monthly invoice.

We’re comparing these to last year’s performance along with the budget requirements of the business.
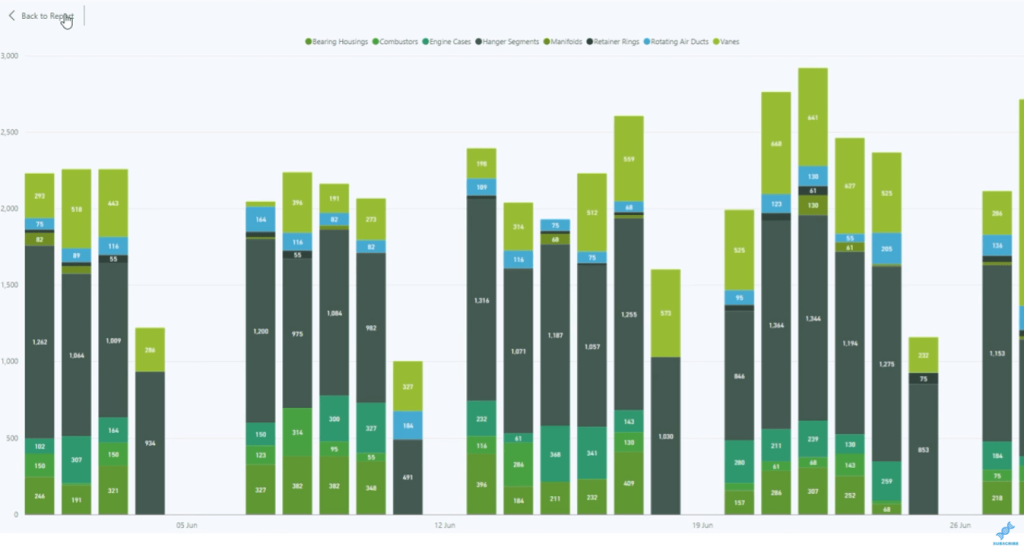
This report also includes a chart that shows the number of units produced and factory labels issued:

The technique used in this part of the report allows us to harvest our measures within a filter. This makes it easy to navigate between different metrics within a single chart.
Order Bank Summary
In this next report, we have a summary of our current order bank.
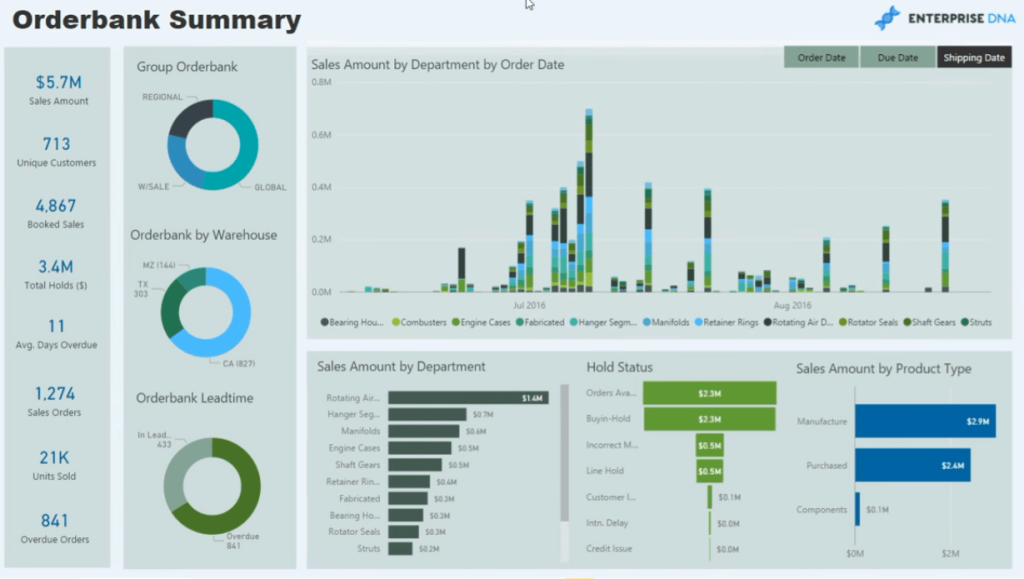
We’re using a similar technique that allows us to navigate through the data in our order bank via order date, due date, and shipping date.

This makes it easy to see when specific orders were done or completed.
The analysis we can get out of this report allows us to understand our lead time, whether orders are on time or overdue.

We can also see the status of our manufacturing facilities across different warehouses.

With this, we can see the current order bank for each area.
We also have the order bank data summarized by department, product type, and hold status:

Order Bank Detailed Report
This third report for manufacturing operations provides detailed information on the business’ order bank.
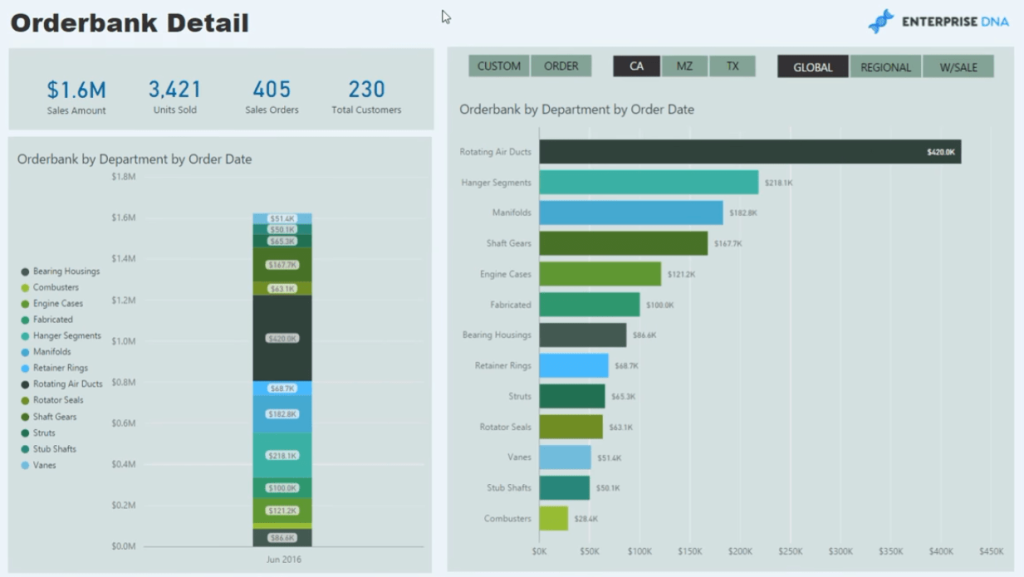
There are filters which enable us to look at very specific parts of the data.

Holds Summary
The next report looks at the holdups or delays in our manufacturing operations.
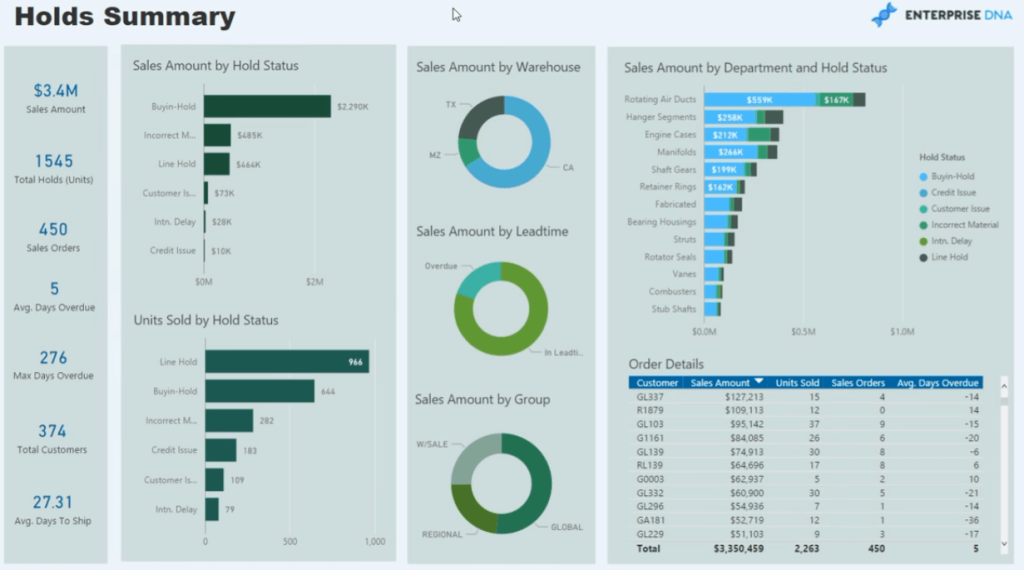
We can easily identify the reasons of the delays from a warehouse and group perspective.
Moreover, we can also look at the data for each individual, order or client. We can see a summary of the Total Sales and Units Sold, among others.
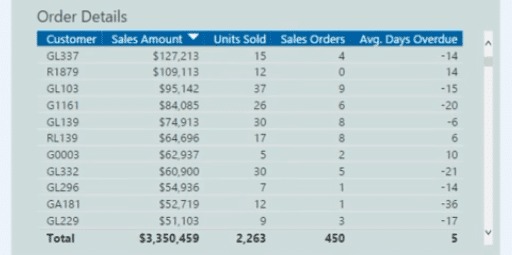
This way, we can manage our clients’ expectations and identify which of them are affected by holdups in a specific manufacturing facility or process.
Overdue Details
In this report, we can see the segmented or grouped orders that are overdue.
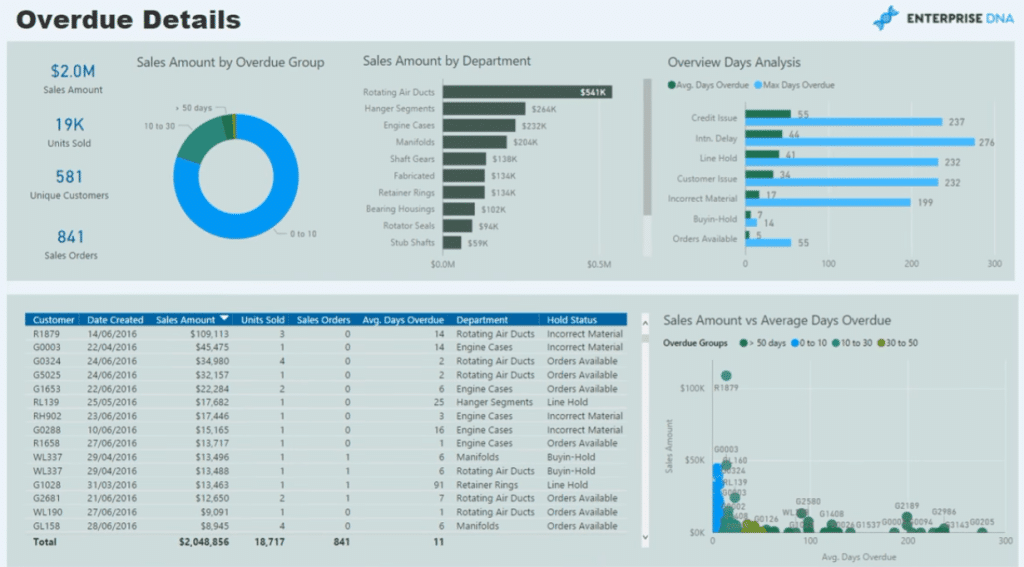
This makes it easy to navigate and see which ones are most at risk of getting a high dissatisfaction rating from a client.
We can navigate to products that have been 50 days overdue by selecting it on the chart.
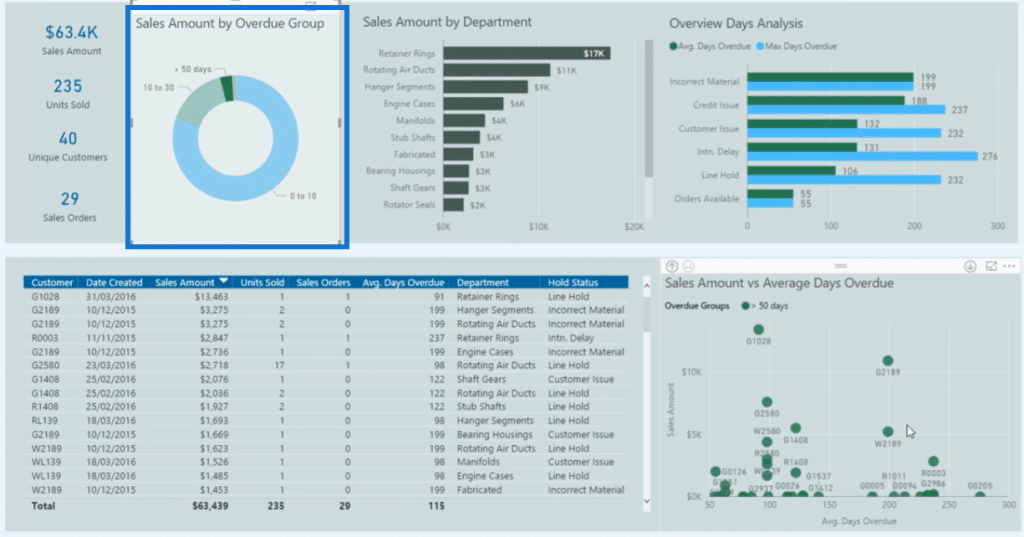
This is going to give us a summary of the products that belong to that group. We can also analyze why they’re overdue.
We can also look at that data by an individual customer level.
So, for example, let’s select a product in this chart that’s almost 200 days overdue.
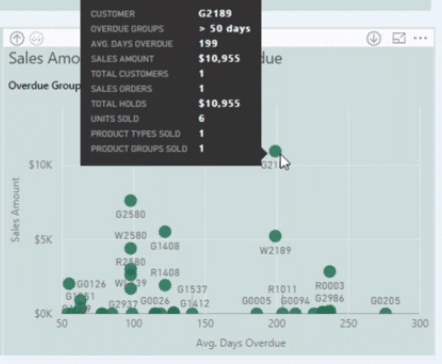
With this, we can then identify that the reason for the delay is because of incorrect material and a customer issue.
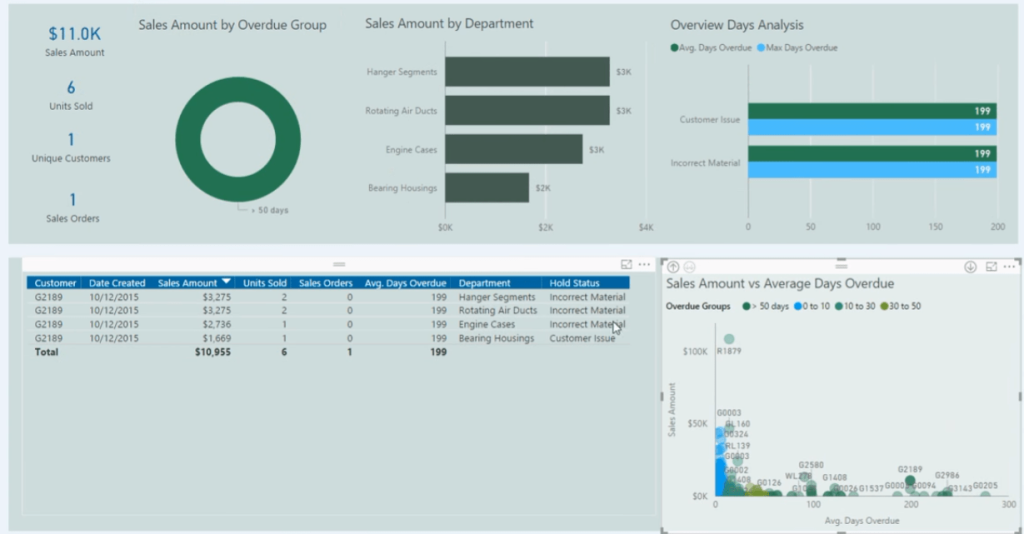
By clicking on an image in the chart or report, we can dynamically navigate to the information that we need.
Annual Review
The last report shows a review of our annual data.
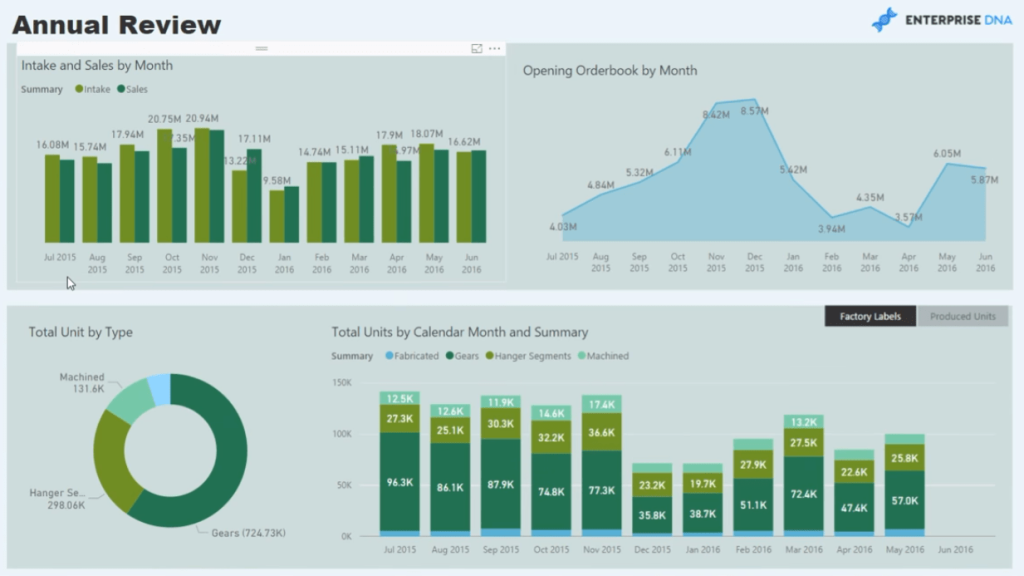
This is similar to the first report; however, it shows our annual performance instead.
***** Related Links *****
Procurement Decisions Model And Analysis In Power BI
Supply Chain Management Techniques In Power BI
Driving Business Results Using Customer Data Analytics
Conclusion
The reports presented in this Power BI Showcase provide a great overview on the overall performance of a manufacturing business.
The information we get from each chart and table allows us to quickly identify areas that are performing well and those that need improvement.
All the best,
Sam
[youtube https://www.youtube.com/watch?v=LLqNTIB0Hkg&feature=youtu.be?rel=0&w=784&h=441]


