I’m going to share with you an interesting Power BI reporting technique, which is about creating some application-like reports using one of the amazing features inside Power BI. You may watch the full video of this tutorial at the bottom of this blog.
These Power BI reporting features can really take your models and reports to the next level in terms of functionality and customer usage.
This tutorial is a sort of an overview of the topic, which I discussed in detail in one of the Enterprise DNA Learning Summits around visualization tips and techniques. Here I talk about how to create a navigation view of reports, which is quite similar to how applications function and look.
First, I’ll show you the report navigation that I made. Then, we’ll dive into the steps on how to set it up.

Sample Application-Type Power BI Reporting Setup
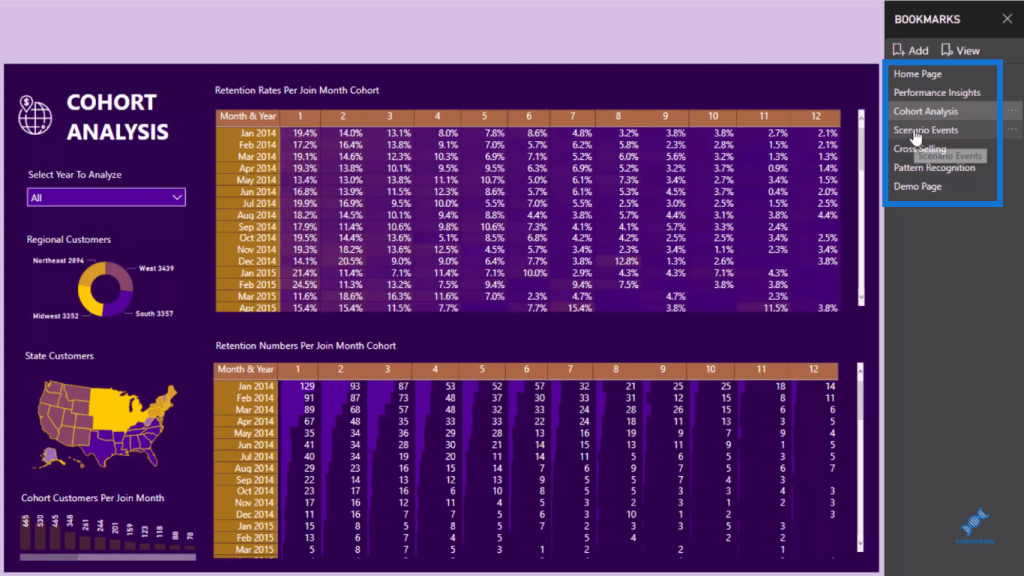
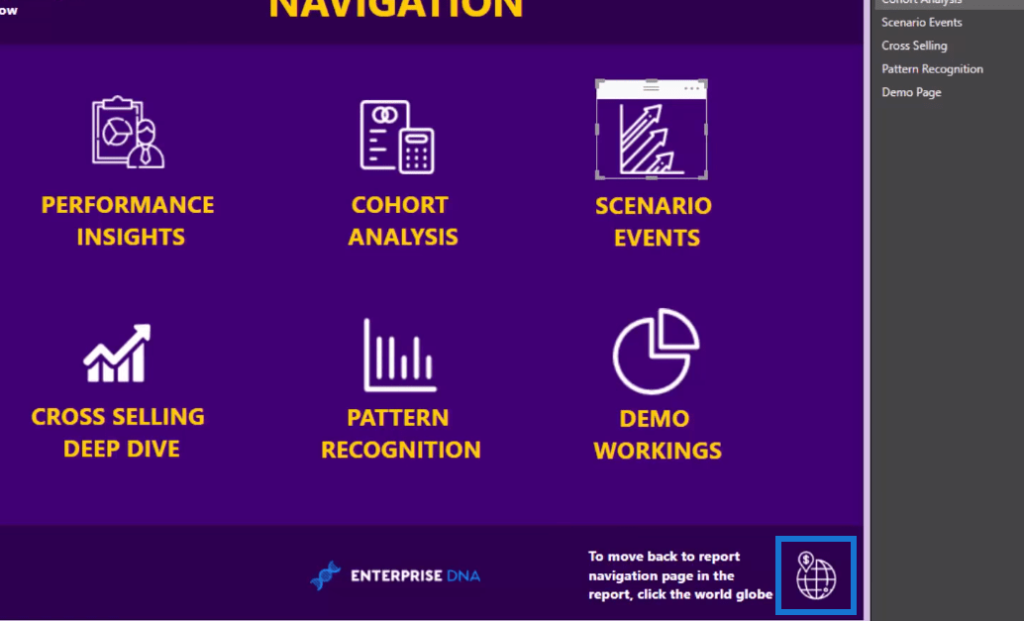
In this demonstration, I’m showing the report navigation that I made, which is from a published website. I wanted the consumers to be able to work through the report easily. The goal was to help them just click through the individual reports seamlessly.
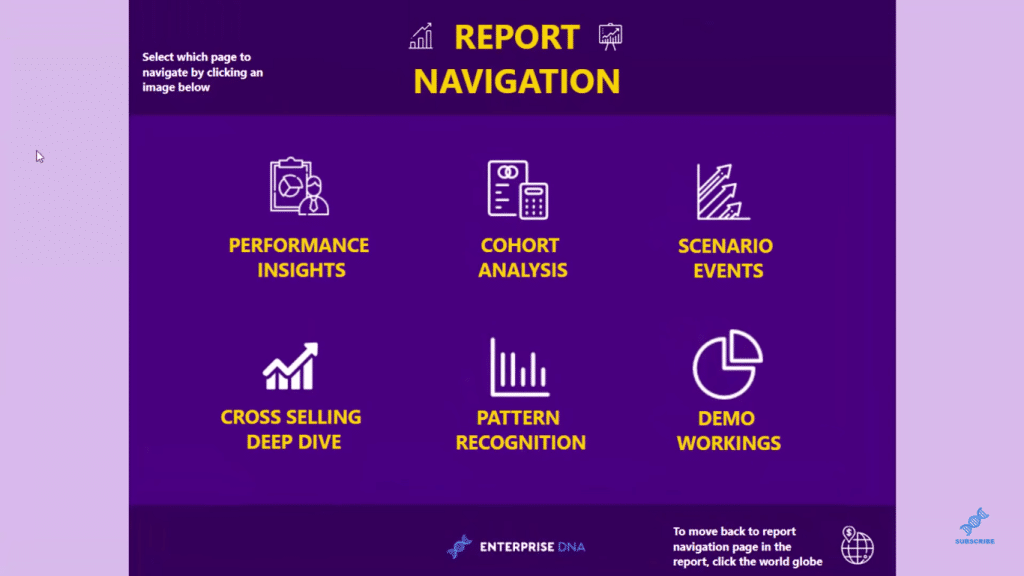
I’ve set it up with these icons, which I’ve embedded into my report as images. Then, I’ve linked them to other pages via bookmarks, which is the key feature here.
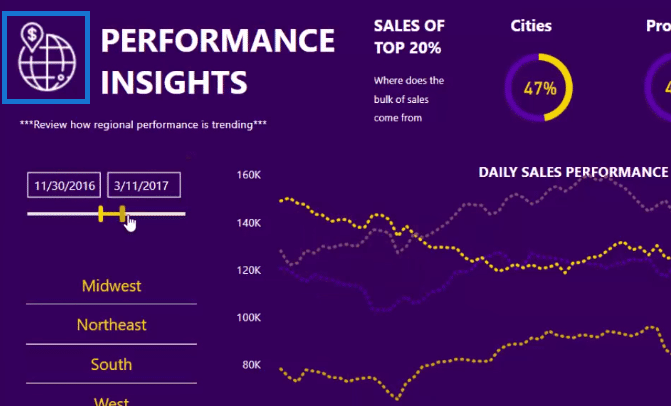
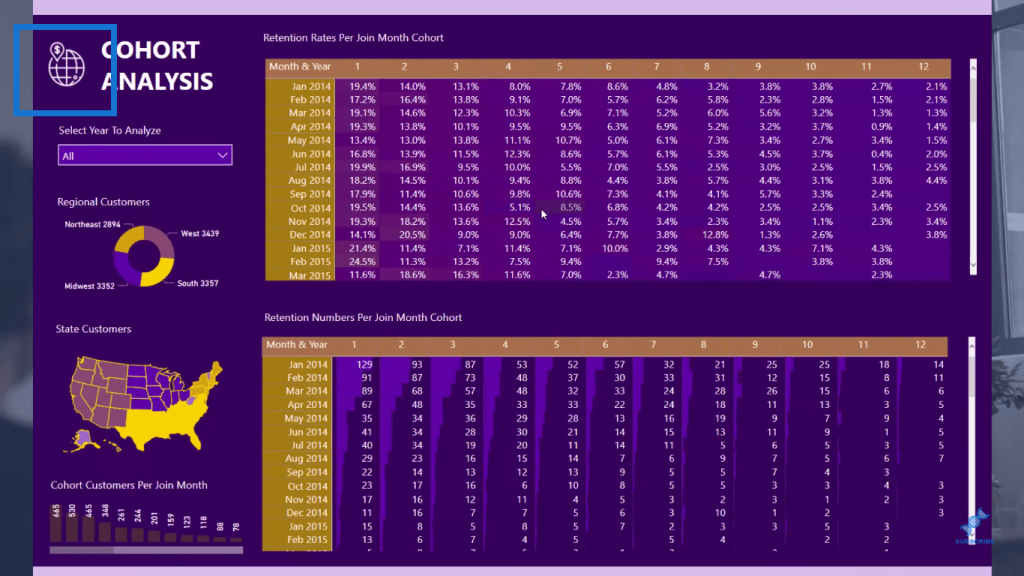
So, if I want to jump to a particular report page, I can click on the icon and it will take me to that page.
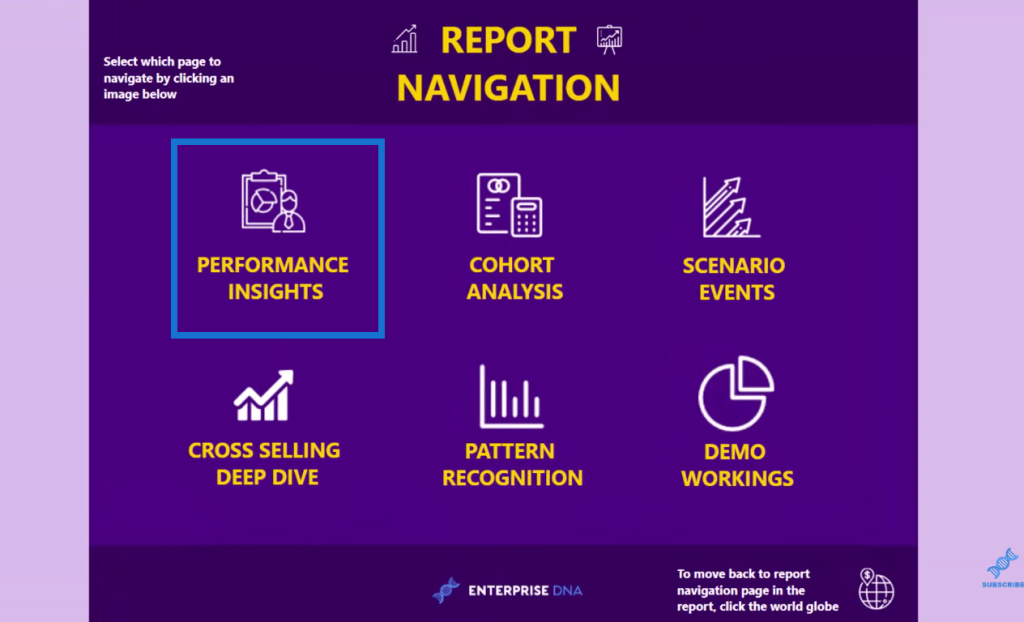
I can click through the report and dive into whatever analysis I want.

I’ve also set up navigation back with this little globe icon in the upper left corner of the page.
You can see the instruction on the navigation view/homepage in the lower right corner.

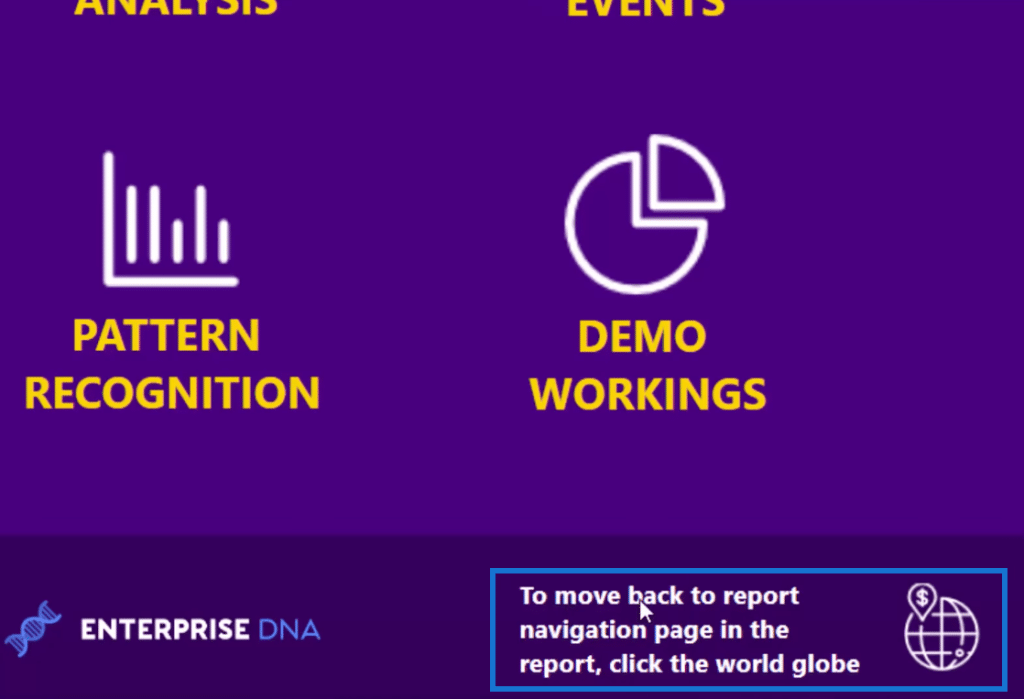
I strategically placed these globe icons throughout the reports, so I or any other user can click back and forth easily. I believe this technique is quite effective in Power BI reporting.
Creating A Bookmark
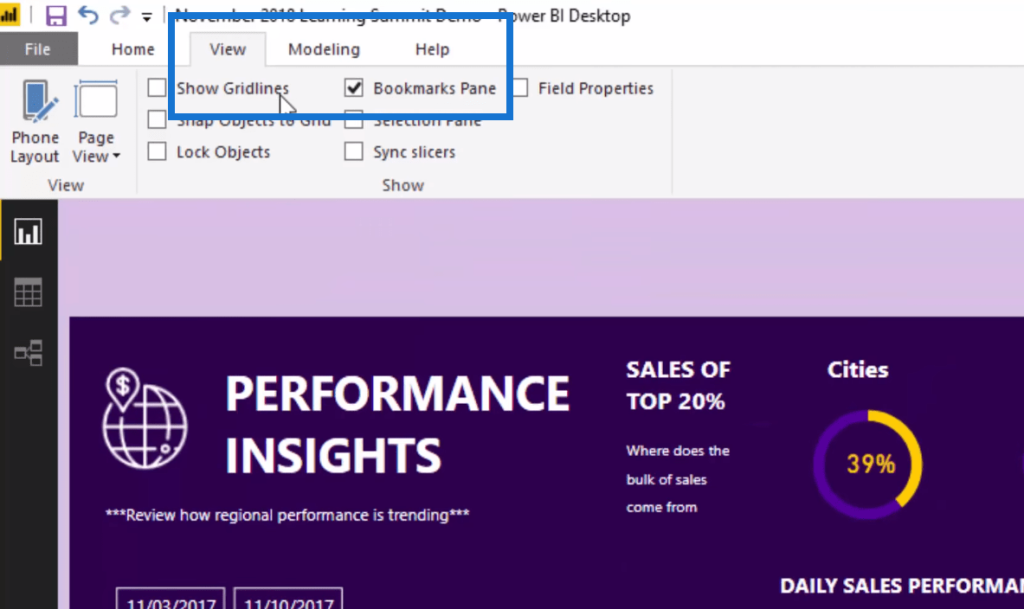
As I mentioned, I’ve used the Bookmark feature to create this report navigation view. To create a bookmark and link it back, we need to select whatever setup we want on our page, which can also mean whatever filters we want. We can bookmark anything. It doesn’t have to be the actual page. It can be any subset or sliced part of that page. Then, we turn on Bookmarks by clicking the tick box here on the View ribbon.
Whatever we’re setting or whatever filters and look that we want on our page we then click Add to create the bookmarks.
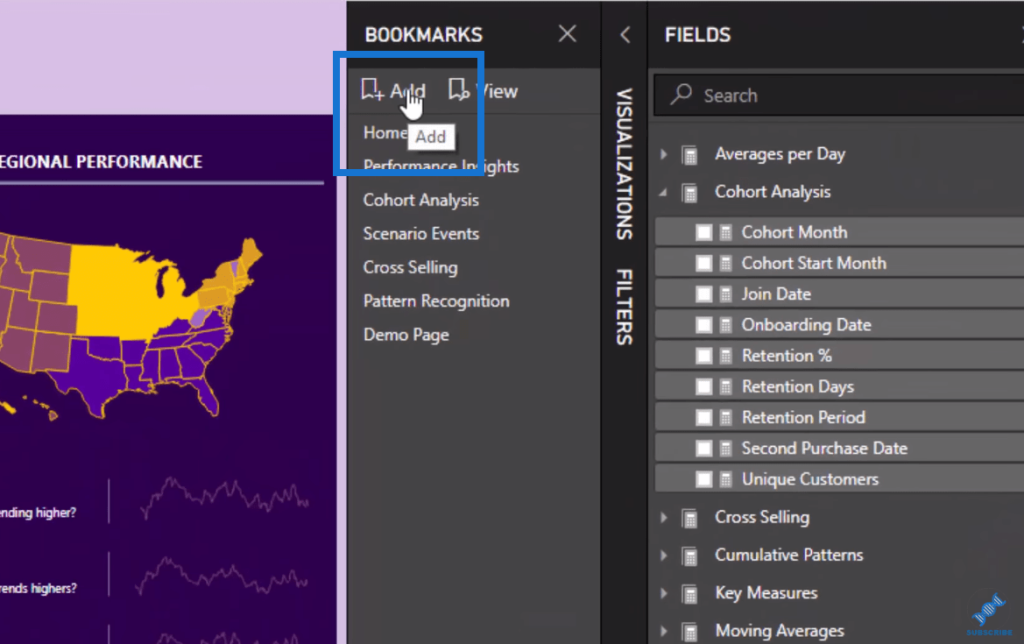
You can see that I’ve already done a lot of these bookmarks. I can click through them and the filtering changes because I set it up that way when I created these bookmarks.
Once we have that set up, we then integrate these bookmarks onto images that we can click. Each image represents a particular bookmark.
Integrating Bookmarks To Images
To integrate bookmarks into images, we simply click on an image and then navigate towards Action.
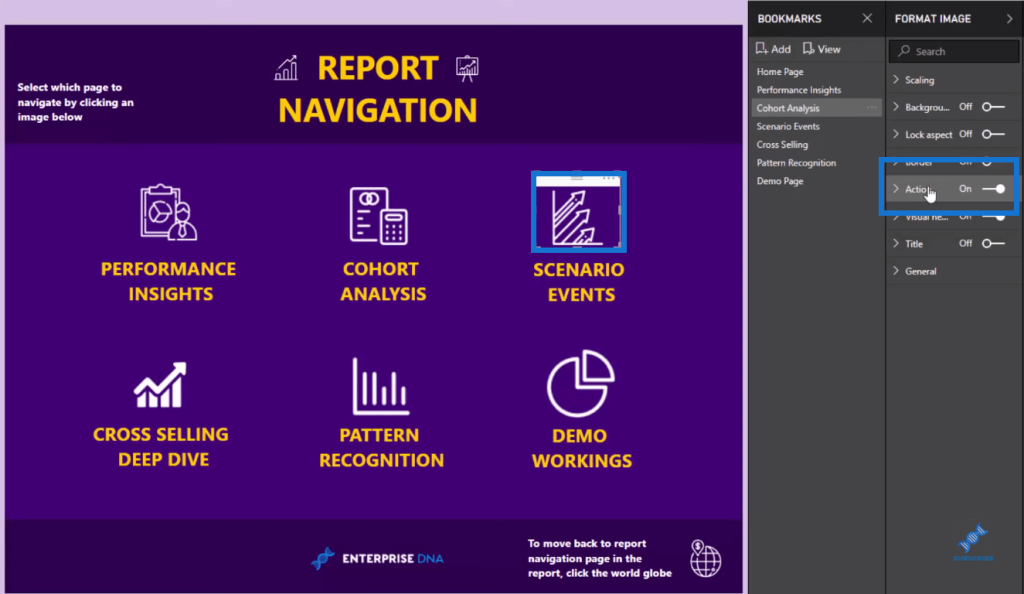
We turn it on, and then we go Type and choose Bookmark.
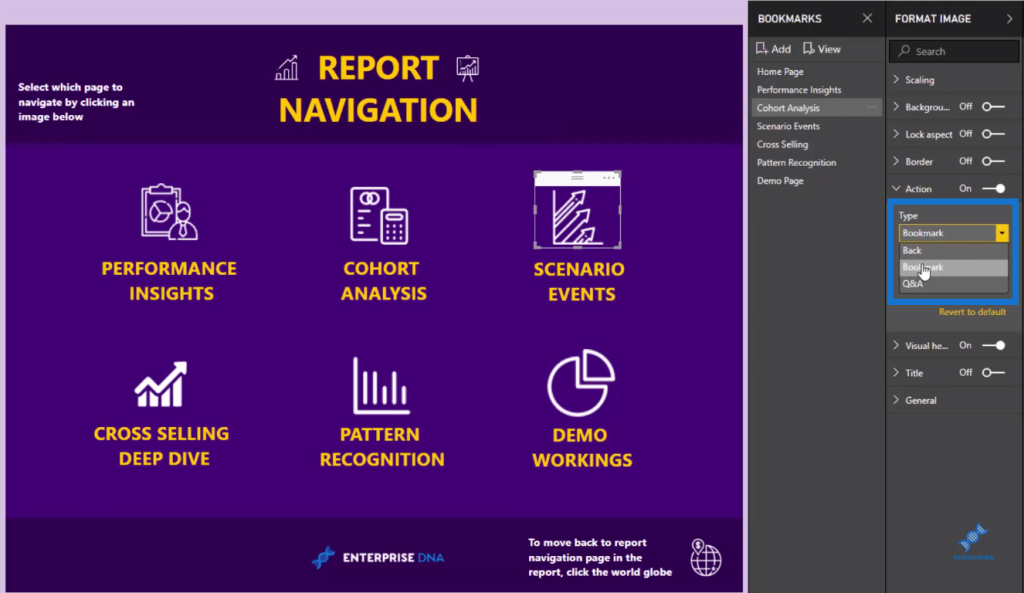
Next, we select the appropriate bookmark that we already have set up. You’ll see that as I click through the images, it’s changing and showing the bookmark selected here under the formatting section (Action) because I’ve already set these up.
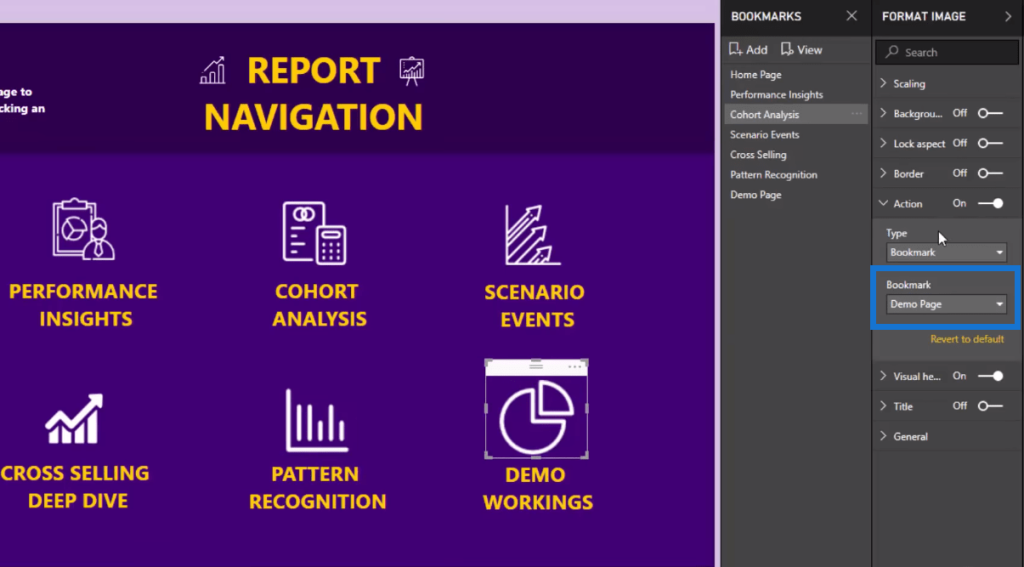
I did the same for the globe image or icon, which also appears in each report page.
Once that’s all set, we now have a fully functioning web-based Power BI reporting application.
Conclusion
This Power BI reporting technique is a great way of enhancing the experience of your consumers as they navigate through your reports. I highly recommend exploring it further.
This bookmark feature enables amazing story telling with Power BI. You don’t have to jump between different pages or filters on a page. You don’t even have to be on a different page; you can be on the same page. So you can have images on the same page and determine what bookmarks get placed on your reports based on a selection.
There are so many ways that you can utilize this great feature inside Power BI. Check out the links below for more Power BI reporting tutorials.
Cheers!
Sam

***** Learning Power BI? *****
FREE COURSE – Ultimate Beginners Guide To Power BI
FREE COURSE – Ultimate Beginners Guide To DAX
FREE – 60 Page DAX Reference Guide Download
FREE – Power BI Resources
Enterprise DNA Membership
Enterprise DNA Online
Enterprise DNA Events

***** Related Links *****
Using Filter Fields & Visual Interactions To Create Compelling Visualizations In Power BI
How To Add Custom Icons Into Your Power BI Reports
Power BI Mobile Reporting Tips And Techniques
***** Related Course Modules *****
Data Visualization Tips
Dashboarding & Data Visualization Intensive
Financial Reporting w/Power BI
***** Related Support Forums *****
Build A Power BI Report From 3 Different Reports
Power BI Reports Multi Select – Phone View
Public Dashboards
For more power bi reporting queries to review see here…..