
Showing trends and how they change over time can add a lot of value to your consumers and decision makers. In this post, I will show how to use conditional formatting inside Power BI tables to showcase this insight really well. Obviously to show a trend analysis in Power BI, we actually need to calculate growth rates. You may watch the full video of this tutorial at the bottom of this blog.
This is also a great use of the DAX formula language. I will show you how you can use a combination of formulas, including time intelligence calculations, to come up with the correct results.
I will also show a quick way to discover which products are performing well and which are not over a certain time frame. Sometimes you just want to see what is currently trending in your sales, and identify it right away. Other times, you want to identify these trends on a longer time frame.

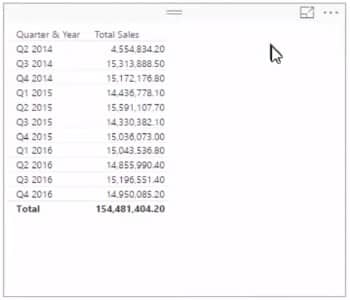
I’m going to show you how to do a trend analysis in Power BI very quickly on a quarterly basis and then transition to a monthly basis. First, we start with Total Sales. We need to identify what is the growth from one period to the next and look at it from a quarterly basis. We will create a measure and get the sales per quarter in a relatively straightforward fashion. All we have to do is create a quarterly context by dragging in the Quarter & Year column and associating it with the Total Sales column.
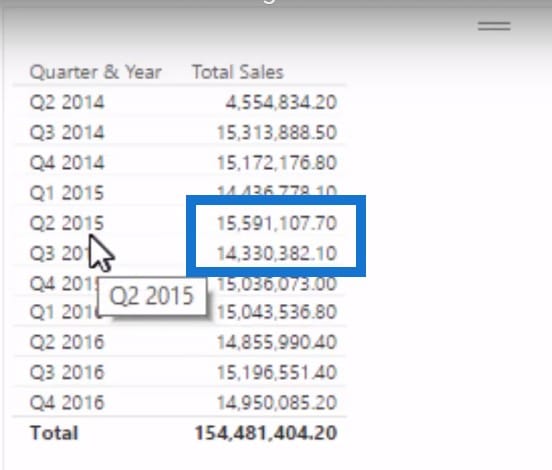
But what if we wanted to see what was the growth quarter from the current quarter to the quarter before? For example, what was the difference between Q3 2015 and Q2 2015? If you were able to see that these numbers were all negative, then you can identify a downward moving trend in your sales and actually do something about it.
Getting Quarterly Sales Growth
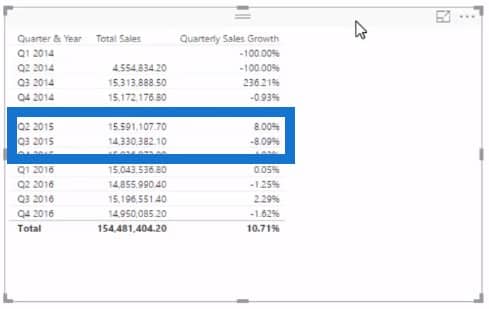
To achieve this, we need to add a bit of logic here. We will create a table and call it Quarterly Sales Growth, divide our Total Sales, use the CALCULATE function, and then add the DATEADD function to jump back a quarter. We will then put in the alternative result of 0, and then add -1 to get the percentage growth.

Lastly, we put the formula into percent and then drag it into the canvas. You can now see we’re getting percentage growth month on month. As you can see that on Q3, we’re down 8.09% from Q2.
Getting Product Growth
But what if we want to identify and see the trends in specific products? The first thing we need to do is get rid of Sales and turn this into a matrix. Then we will find our Products and put it in Rows. We can now see the growth per product for every single quarter.

Using Conditional Formatting
So now we can see the results, which is great. But just by looking at it, I can’t really tell anything quite honestly. So how do we make this visually compelling, or change it in such a way that we can quickly tell what is going on? There’s a feature in Power BI called Conditional Formatting.

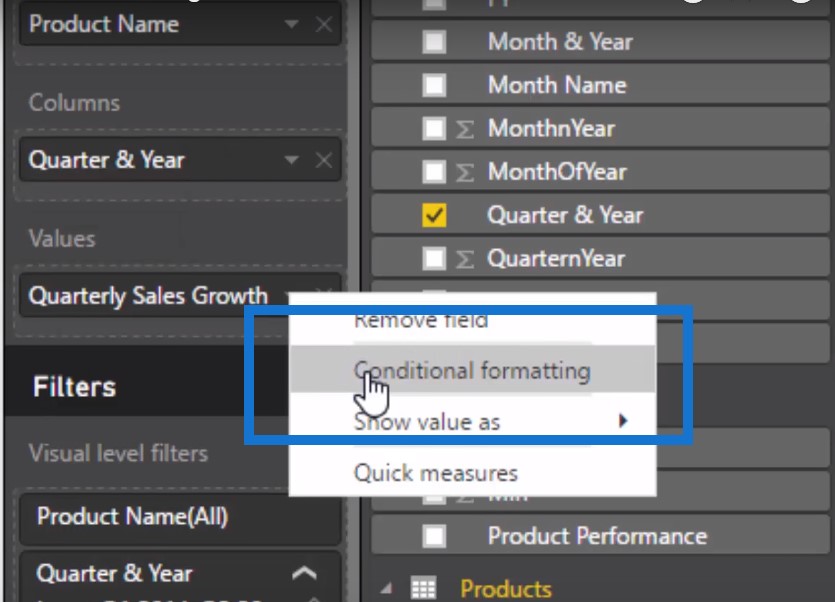
When we click on this, it will bring up the Conditional Formatting box. We just put in a number on the Minimum and Maximum fields and assign a colour to them.
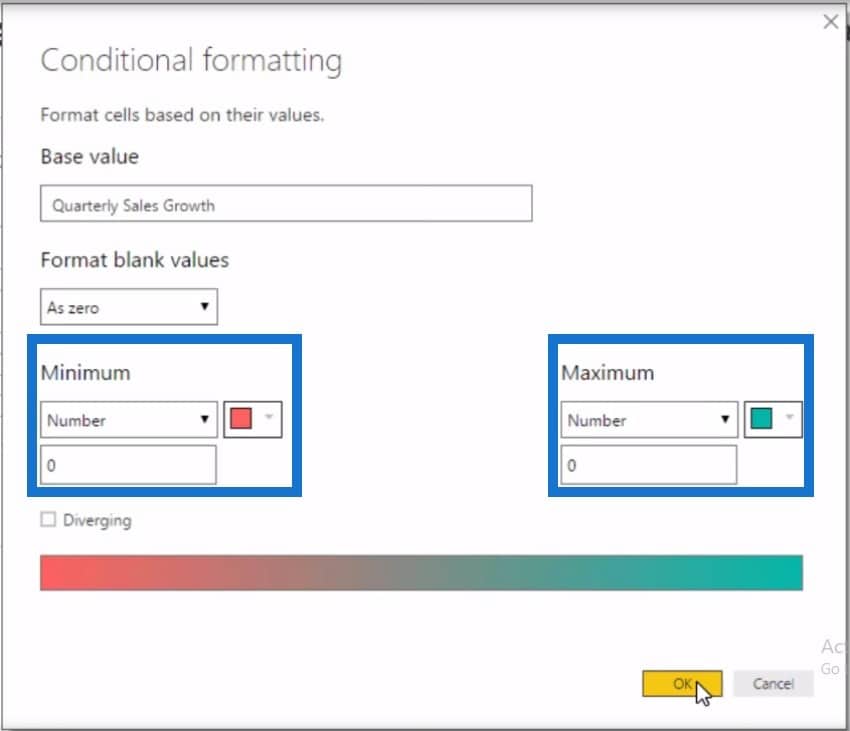
Once we click on OK, we can see how our products are faring quarter after quarter and determine if they are trending up or trending down.

Tracking Trends On A Monthly Basis
We can do this on a monthly basis as well. We just copy and paste the table and measure we are working on. Then we are going to change the title from Quarterly Sales Growth to Monthly Sales Growth, and then change what DATEADD is qualifying from Quarter to Month.

Then we’ll grab the Month and Year numbers to our table, change the format to percentage, and apply Conditional Formatting as well.

Let’s say we work on a retail store or a supermarket. We are selling a number of things constantly every single day and we need to identify trends very quickly, so this is going to be useful. If there are lots of negative numbers, then we have a problem in our hands and need to figure out what’s going on with these particular products.
On the other side of the coin, if the numbers are going up, then we can figure out what we’re doing right with these products and see if we can apply them to those that are not doing so well. Think about how you can use this trend analysis in Power BI in different ways, not just in sales.
***** Related Links *****
Using Moving Averages To Showcase Trends in Power BI
Showcasing Deviations & Trends With Power BI Using DAX
Analyze & Showcase Quarter On Quarter Sales Trends In Power BI
Conclusion
There’s a little bit of DAX in this tutorial, so if you’re just starting out with formulas inside of Power BI check out Mastering DAX Calculations at Enterprise DNA Online. This course covers all the ‘need to knows’ around DAX. Using DAX effectively is extremely important in Power BI. Any quality analytical insight and trend analysis in Power BI can be achieved by implementing DAX well and having a data model which is built correctly with the right relationships.
The tables inside Power BI are fantastic. They are so much more than just a static table of information. Firstly, they’re dynamic, so they’ll show your results based on the filters that are applied to your reports. They also have some good conditional formatting options, but they can also be used as a filter inside your report. So many options and opportunities to use these effectively to showcase great insights.
I always like to use tables to show granular levels of detail. You might have your bar or column chart aggregate information up, but then you may also want to see every single sale or transaction and examine the details of that. Tables are perfect for this.
This example does actually show the matrix visual, but tables are very similar, and all similar techniques can be applied across both from a visualization perspective. Place a comment below if you have any thoughts or feedback.


