In this article, we will review how to find the percent of the total calculation in Power BI.
Although you might have already learned this from the other modules, reviewing it would be beneficial for its common usage in various scenarios.
Percent Of Total In Total Sales
To show you a simple example, we will create a measure for Total Sales.
To create this measure, I will use the SUM function and then put in the Total Revenue column.

Then, I will drag Total Sales into the canvas and make an association with the Product Name dimension.

Then, we need to figure out the percent of sales of all the products under the Product Name column through the total.

To do this, we need to divide every single number in Total Sales by the total. The only way to achieve this is to change the context of the calculation so that the Product Name column would be ignored.
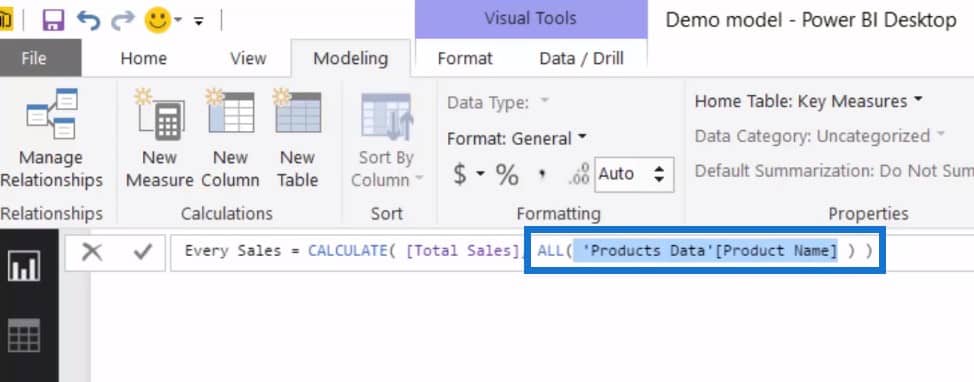
We will create a new measure called Every Sales, reference the Total Sales inside CALCULATE, and then use the ALL function with the Product Name column since it can remove filters from the dimension.

After dragging in the measure, you can see that every single row has the same result.

This is because in this entry, the context which is Product 7 is already removed by the ALL function, making every single row show the same result.

To get the percent of total, we will create a new measure called % of Total which uses the DIVIDE function to divide Total Sales by Every Sale, and then put in a zero as the optional alternate result.

We can now drag in our new measure and change the format to show percentages.

These two measures would not be necessary so we can remove them.

After removing those two intermediary calculations, this is how the table would finally appear.

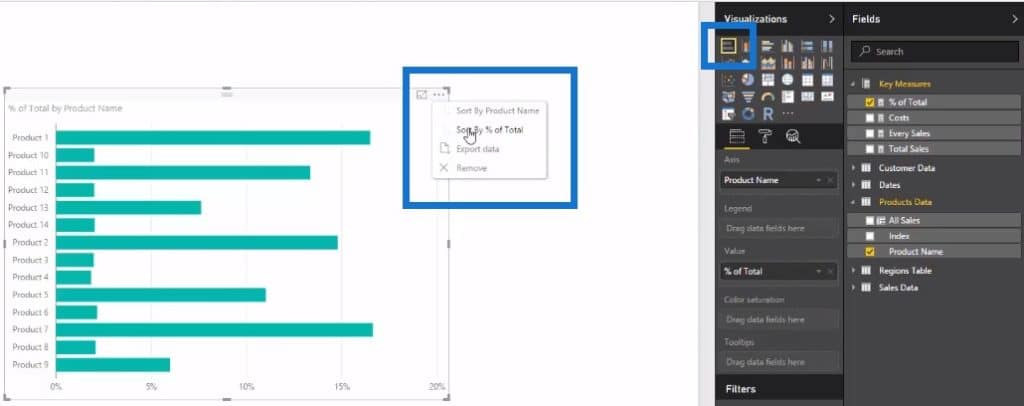
To better visualize the percent of total table, we can select the stacked bar chart under Visualizations and then sort the results into a descending order.


Getting the percent of the total was very simple since all we had to do is to put in the correct dimensions then use the ALL function to remove the filters for that calculation.
Percent Of Total Power BI: Context Considerations
In this section, we will discuss the context considerations surrounding percent of total in Power BI.
A lot of the results that you get from percent of total calculations heavily depend on the context where you place your formula.
For example, the context in this particular example is Product 7.

All of these percent of total results add up to 100% since we have removed the filters for Product Name inside the formula of Every Sale.

Because of this, we are able to do that intermediary calculation with DIVIDE wherein the sum of the total was used as the denominator.
However, the percent of total formula can return a different result depending on which context you put it into.
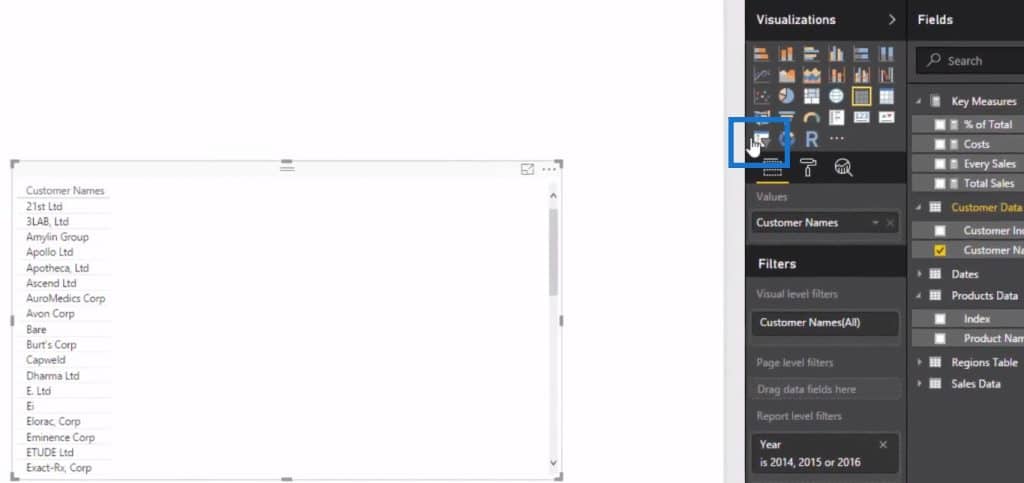
For example, I will copy and paste the table and then use Customer Names as the context for the calculation.

As a result, the percent of total in every row displays 100%.

This is because the % of Total measure does not work in this context since we need to remove the filters first.
However, if we put in the other dimensions, the Every Sales measure would not work since only the filter in Product Name is being removed in our formula.
To show you an example, the Every Sales measure here is still returning the values from the Total Sales of the customers.

If we want to get the percent of total per customer, we need to make changes in the Every Sales measure or change the table using a slicer.

By selecting a customer through a slicer, the table of results will now work since the percent of the total is now being filtered by a particular customer.

Whenever you click a customer name within the slicer, you are looking at a reduced Sales table instead of looking at the entire Sales table.

Instead of selecting one customer at a time, you can also change the slicer settings so that selecting multiple customers would also be possible.

Selecting multiple customers will still yield correct results since the Product Name context is properly used.

Simply changing the context or using slicers would enable you to efficiently retrieve desired results in various situations.
***** Related Links *****
Calculating Dynamic Percentage Of Total Change Using Power BI Time Intelligence
Power BI Percent Of Total – Using CALCULATE Statement
Calculating Percent Profit Margins Using DAX In Power BI
Conclusion
That is how you get the percent of total in Power BI and how using different contexts affect your calculations.
Understanding how context works is very important since you can get drastically different results by changing it as shown in our examples.
These are just the basics when dealing with percent of total calculations. Combining what you have learned with other concepts would eventually allow you to do more advanced calculations.
All the best,
Sam


