This tutorial will discuss about a productivity tool inside the Power BI Desktop called Tabular Editor 3. You’ll learn about the tabs, menus, and panes inside the editor which you can use for your data report. You’ll also learn how to personalize the editor to your preference.
Opening Tabular Editor 3
There are multiple ways to open the Tabular Editor. The first one is to go to the External Tools tab and select Tabular Editor 3.

Inside the Tabular Editor, you can see Power BI files and tables in the TOM Explorer.

Another way is to go to the start menu and search for Tabular Editor. If you click and open the editor, you’ll see that there are no tables inside the TOM Explorer.

Add the Power BI files and tables by connecting the Tabular Editor 3 to the Power BI Desktop. First, click File and select Open. Next, click Model From DB to get the data from the database.

Then, select the file that you will use in the editor and press OK.

After that, you’ll see all the tables and Power BI files in the TOM Explorer.

Familiarizing The Layout Of The Tabular Editor 3
The layout of the Tabular Editor 3 differs depending on your preference. For this tutorial, the classic layout is used. If you want to switch to the default layout, go to the Window tab and select Default.

The Panes
On the left-hand side of your editor, you have the Tablet Object Model Explorer or TOM Explorer. It contains the tables, measures, and hierarchy. In this example, you can see Relationships, Roles, Shared Expressions, and calculated tables or calculation groups.

On the right side of the TOM Explorer, you’ll see the Expression Editor. This is where you’re going to write your DAX code.

Below the Expression Editor, you’ll find the Properties pane. Depending on your selection, the properties might differ because one property may not be applicable to another field.

The Data Refresh option, which is more geared towards the analysis services, can be found at the right-hand side of the Tabular Editor along with the Macros option. The Macros option is for scripting the DAX or the C# scripting in the advanced section.

At the bottom left corner of the editor, you’ll see the Messages pane. Whenever you write DAX codes, a message will appear in the pane showing you suggestions or corrections for the codes used.

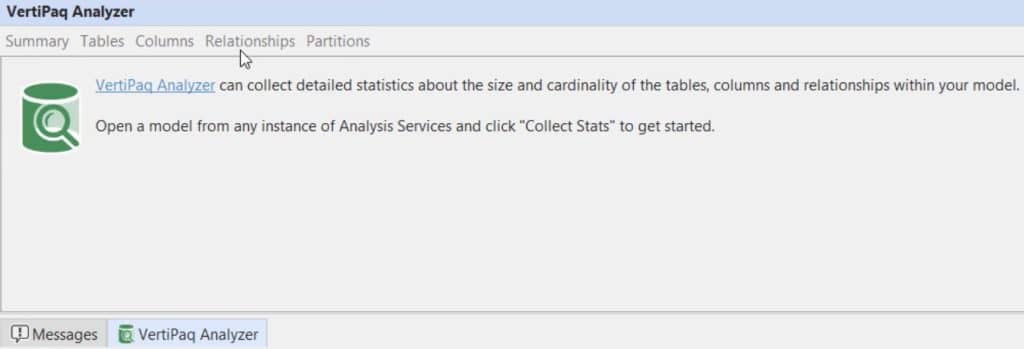
Beside the Messages pane, you’ll find the VertiPaq Analyzer pane which stores data in memory and reads the structure of the data you’re using. The data inside a Power BI file is an in-memory columnar database. This means that data has to reside on the RAM.
The Toolbars
At the upper left corner of the editor, you’ll see different toolbars that you can utilize. Inside the File toolbar, you can create a new DAX query, Pivot Grid, DAX Script, Diagram, and a C# Script. It also shows common options like Save, Close, and Close Model.

In the View toolbar, you can open any pane that you want.

The Edit toolbar also has options to script DAX, create a measure, and view dependencies.

In the Tools toolbar, you can customize the Tabular Editor or check preferences.


Finally, in the Help toolbar, you can read the Tabular Editor 3 documentation or raise an issue about the editor.

Changing Themes And Workspaces
Tabular Editor 3 is not only a productivity tool. It also takes care of your basic needs like being able to change the themes of your favorite software like Visual Studio. There are different themes available inside the editor which you can use in developing reports.
If you go to the Window toolbar and select Theme, you can see 5 themes that you can utilize depending on your preferences.

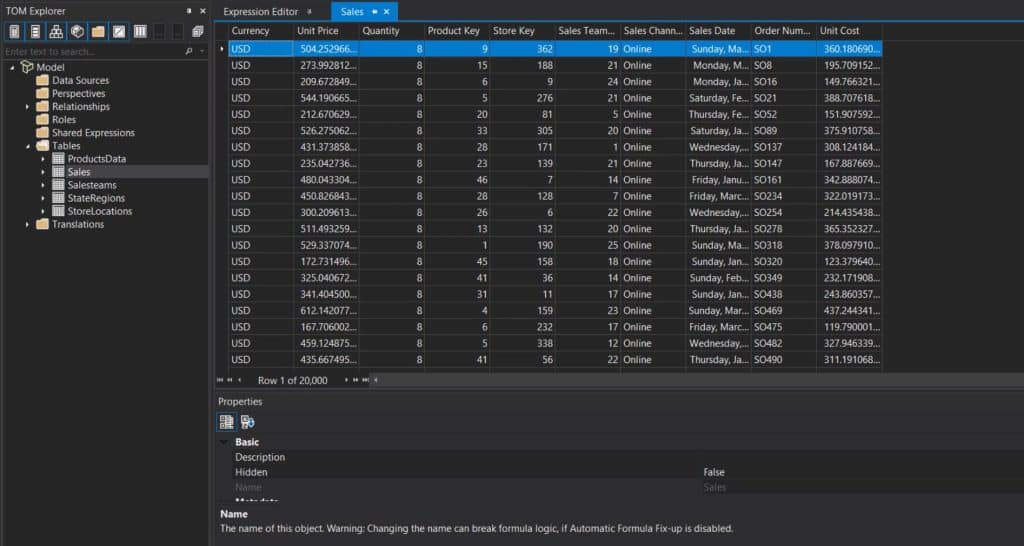
For example, if you select the Black theme, your Tabular Editor will look like this.
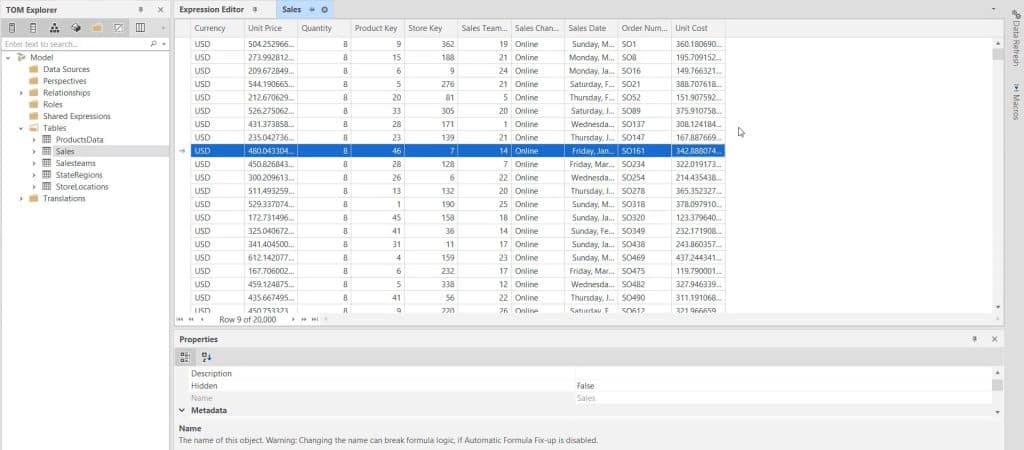
If you use the Bezier theme, the editor will look like this.
The workspace in the Tabular Editor 3 allows you to create a setup of the panes and menus that are available in the editor. If you want to create your own workspace, you can drag a pane and place it at any arrow on the screen.
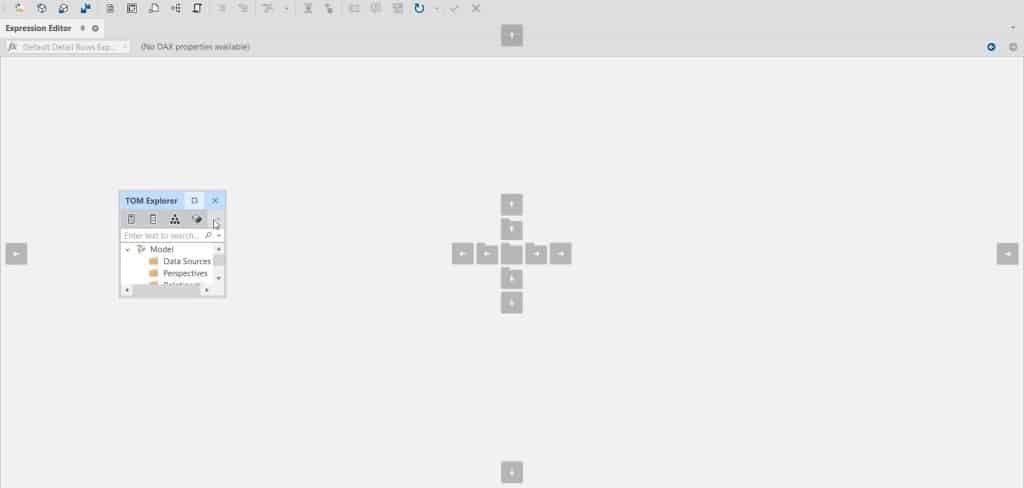
In this sample workspace, the TOM Explorer and Expression Editor panes are moved to the bottom and right side of the editor, respectively.
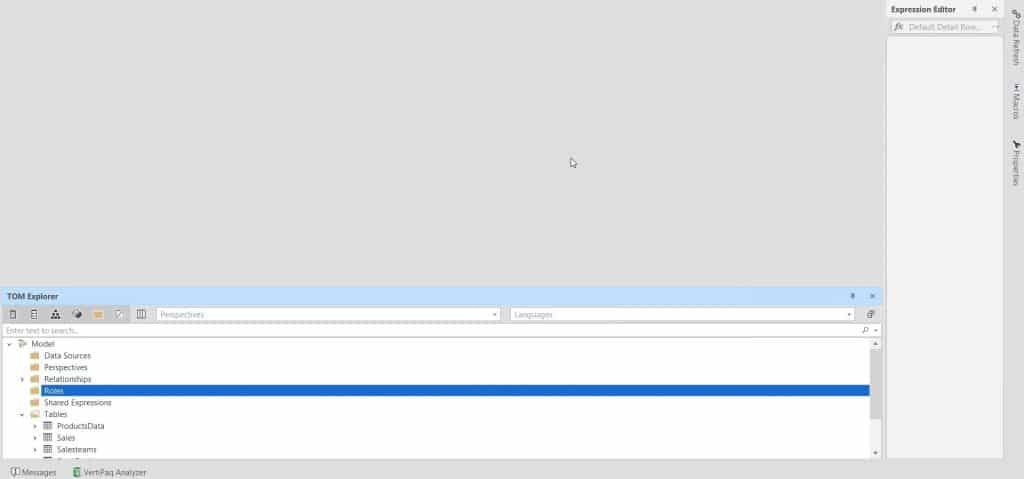
Once you’ve completed your setup, go to the Window toolbar and click Capture Workspace.

Name the workspace and click OK.

If you’re using the default layout and you want to switch to your new workspace, click the Window toolbar and select the workspace that you created. It will instantaneously change the layout.

To remove a workspace, go to the Window toolbar and select Workspaces.

Select a workspace and then click Remove Workspace.

Sharing Workspaces
Sharing workspaces is also possible in Tabular Editor 3. To share your workspace with other people, go to the Window toolbar and select Workspaces.

Select the workspace that you want to share and click Save Workspace As. Then, save the file on your desktop and share it with your team.

Your team can load that workspace by clicking the Load Workspace and opening the file.

Tabular Editor 3 allows you to move toolbars to different locations. If you click and drag the ellipsis beside the toolbars, you can move them to any location on the screen.

If you want to have additional space to see more code, you can place the toolbars at the extreme side of the editor.

You can also remove the status bar at the bottom of the screen by right-clicking on that pane and deselecting Status Bar.

Customizing Tabular Editor 3
Tabular Editor 3 also allows you to customize the toolbars. If you go to the Tools toolbar and select Customize, you can see multiple options to customize your toolbars.

If you check any tool, it will appear on the toolbar above. You can also add commands in the toolbar in the Commands section. Do this by dragging and dropping a command in the toolbar.

In the Options settings, you can adjust the size of the icons and personalize menus and toolbars.

Reporting Bugs And Errors In The Tabular Editor
Tabular Editor is a relatively new tool that was released in June 2021. Even in its latest version, there are still some bugs that need to be fixed.
If you find any kind of bug while developing your tabular models, go to the Get Help tab and raise an issue so that it can be taken care of.
There is a bug in the current version where the Tabular Editor 3 crashes. If you create a Pivot Grid and right-click on the pivot shelf, an error message will pop out.


If you select Ignore and close the Pivot Grid, nothing happens. However, if you select Abort and close the Pivot Grid, the Tabular Editor crashes and closes.
In this other example, a similar bug occurs when the VPAX BPA workspace is selected.
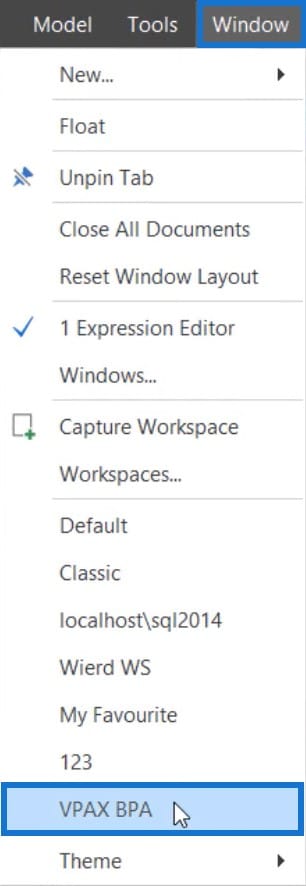
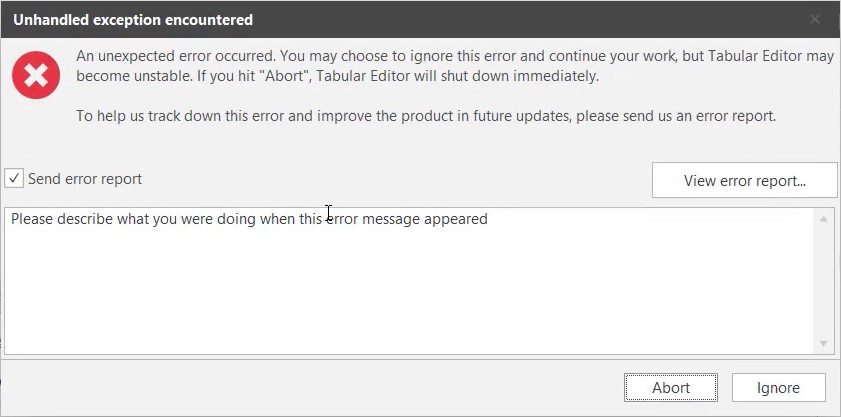
You can also see a red mark at the bottom of the editor.

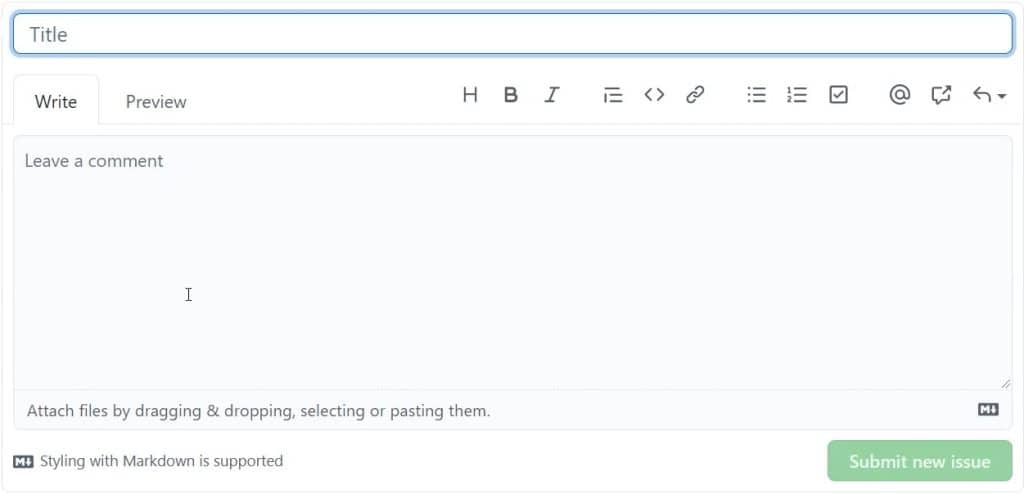
Another option to raise issues on any kind of bug on this website is by clicking the New Issue button.

Then, you can provide a title and a descriptive comment about the issues that you are facing or a bug that you’ve encountered.
***** Related Links *****
Tabular Editor 3: Beginner To Advanced
Use Tabular Editor To Create Calculation Groups In Power BI
How To Set Up Your Workspaces In Power BI
Conclusion
The Tabular Editor 3 is a productivity tool for Power BI and Analysis Services. It helps you create data reports efficiently by allowing you to change and set your workspace comfortably. You can utilize and maximize it to make data development easier.
Enterprise DNA Experts


