
Over the last few months, I presented several tutorials, showcasing best practices for Power BI report development for each of the four pillars of Power BI. In this blog, I wanted to take this opportunity to present my personal top 10 list. You may watch the full video of this tutorial at the bottom of this blog.
This will be a little different from a traditional top 10. Rather than a rank top 10, I’ve chosen 10 of my favorites. There are so many components to a great Power BI report, and it was really hard to pick only 10. But before I get to that, I want to highlight the three optional settings that are, in my opinion, essential to any Power BI report.
The first one is Disable Auto Date/Time. This can be done either each time for the current file or globally for all new files. Globally is recommended.

Next is Disable Auto Detect Relationships. Unfortunately, this option cannot be set globally, so it needs to be adjusted for each file.
Lastly, we have Enable Cross Filtering. This cannot be set globally as well, but it is more audience-dependent and should be adjusted on a report-by-report basis, depending on how the consumers wish to view their data. My preference is for Cross Filtering all the time.
Top 10 Best Practices For Power BI Report Development
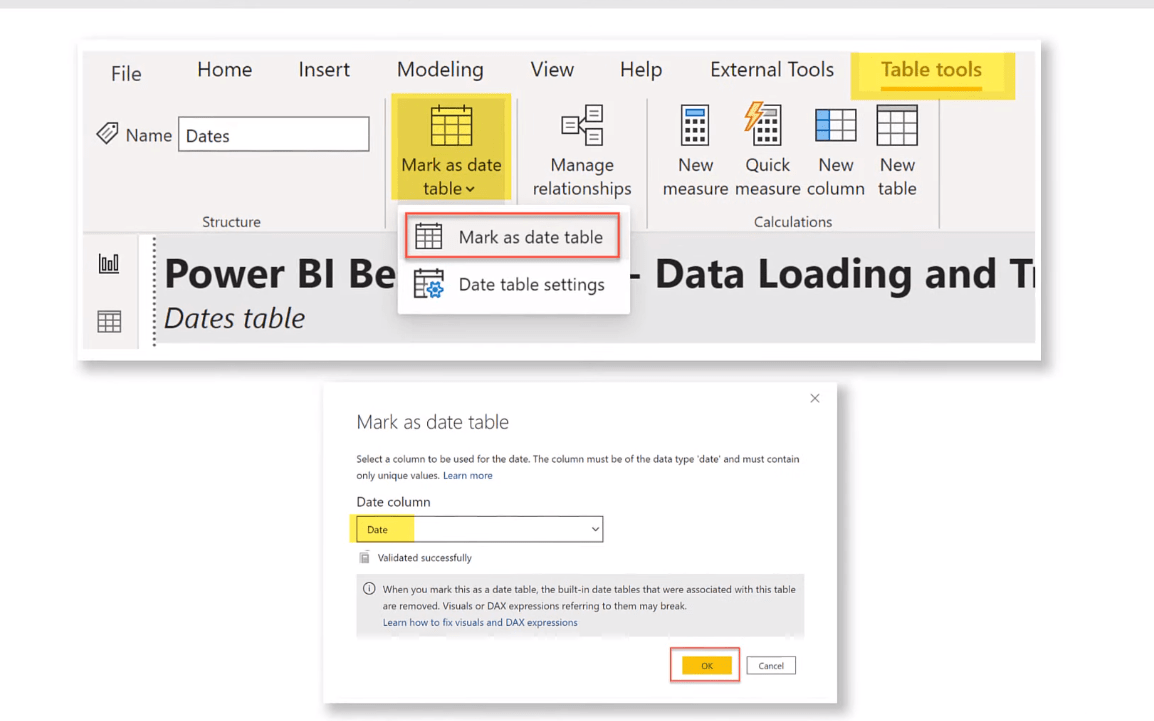
1 – Dedicated And Marked Dates Table
Once those three options have been set, my number one favorite is using a dedicated Dates table and marking it as such. This is literally the first thing I ensure whenever I’m developing or looking at a Power BI report, and I cannot recommend it highly enough.
Your Dates table should have full years and one row per day. I find year, quarter, month, week, and day offsets extremely useful and rarely develop without them.
2 – Staging And Referencing Data
Next is Staging and Referencing data for multiple reasons. Loading or staging your data as an untransformed table will maximize loading performance and minimize the stress on your data source. Creating or referencing your fact and dimension tables as desired from your stage data will minimize or alleviate missing relationships. And as a bonus, this ensures you’ll need to create and edit the relationships between the tables yourself, which can only improve your mental picture of the data model.
So, if I go into Power Query, we’ll see that I have the flat table imported as a Staging query. If I right-click on it, we’ll see that I have Enabled Load disabled.

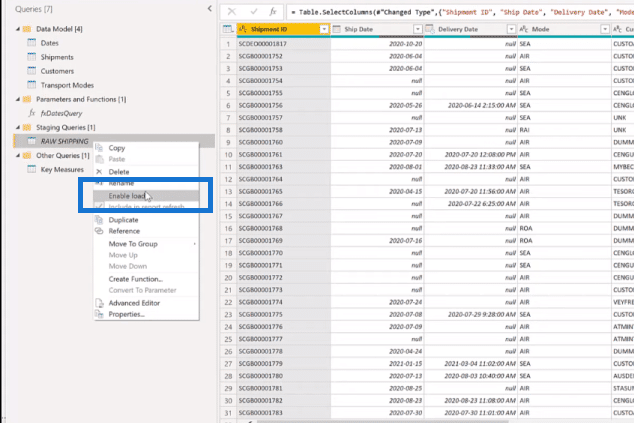
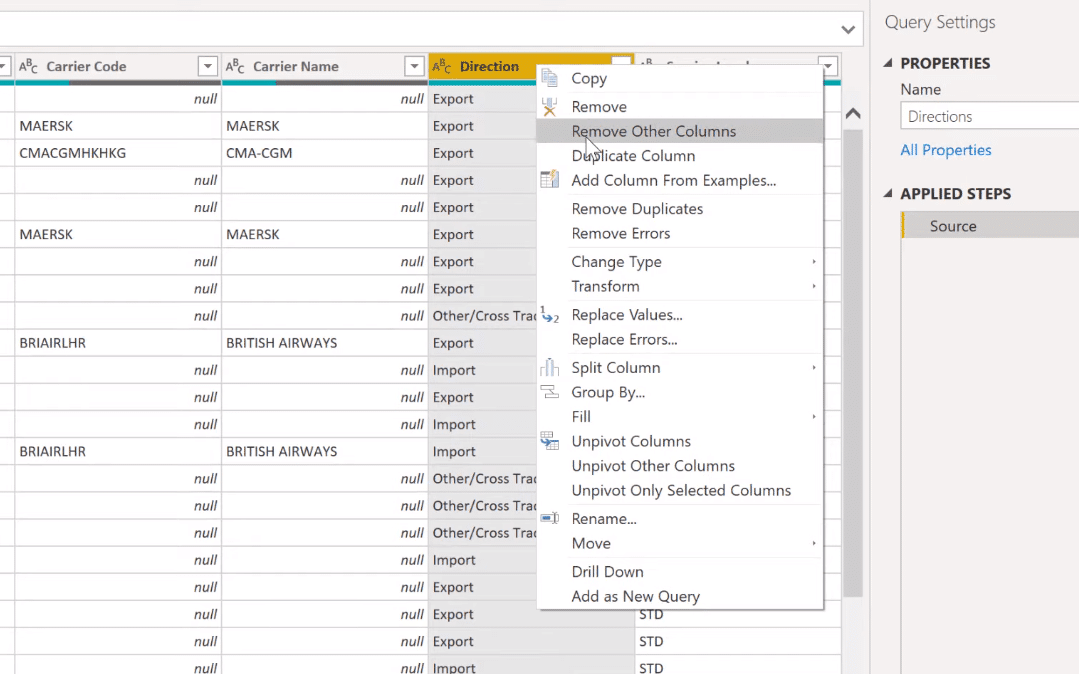
Let’s just create a reference of this for another table, so I’ll right-click on it, create a reference, and rename it to Directions. Then, I will come over to the Directions column, select only it, right-click, and Remove Other Columns.
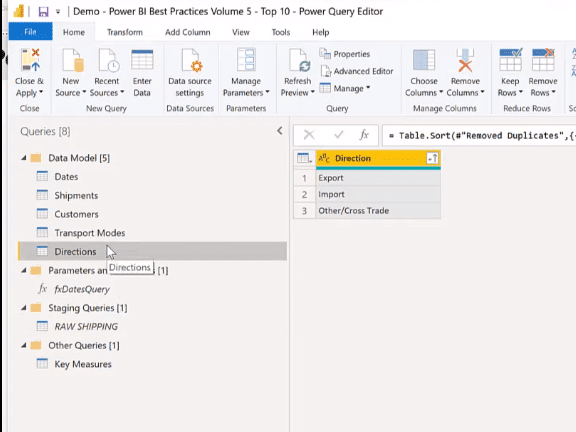
Then, I right-click from here and remove duplicates. And then, I will sort the column.
3 – Reduce Data Volume
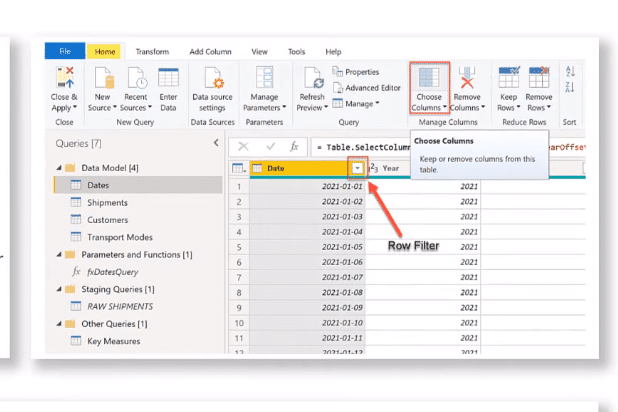
The next best practice is Reducing Data Volume. You can filter your data ideally at the source to avoid even loading rows or columns of data that are not necessary to answer the specific questions that are the purpose of your report.
If you can’t adjust the source, then you can use the row filter dropdowns to remove unnecessary rows and the choose columns button in Power Query to remove unnecessary columns from your data model.
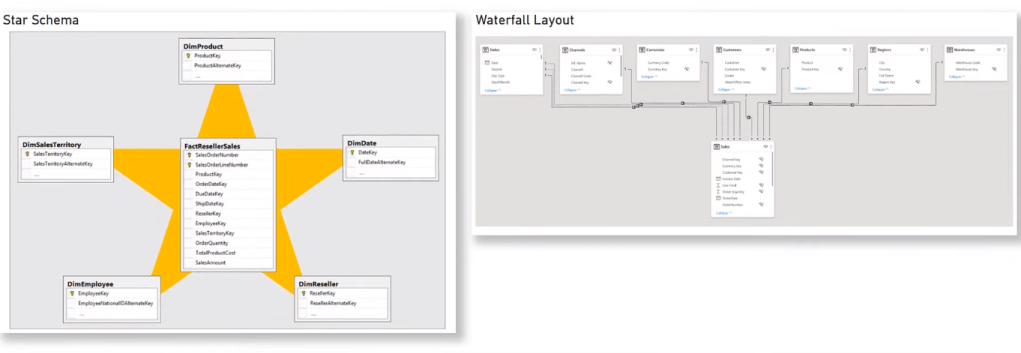
4 – Star Schema Or Waterfall Layout For Data Model
The next one is Star Schema, which is the ideal structure of your data model. You should always strive for the simplest possible data model with dimension or look up tables above or surrounding the fact table. The importance of this waterfall or star layout cannot be overstressed, as it only improves your mental picture of the data model. It also often permits the best possible DAX and visual performance.
5 – Use 1-to-Many Relationships
As far as relationships go, strive to make all relationships one-to-many, with a One end at the dimension and the Many end at the fact table. Avoid bi-directional relationships if you can, unless you’ve determined that your model really needs them and that you really understand their use as well.
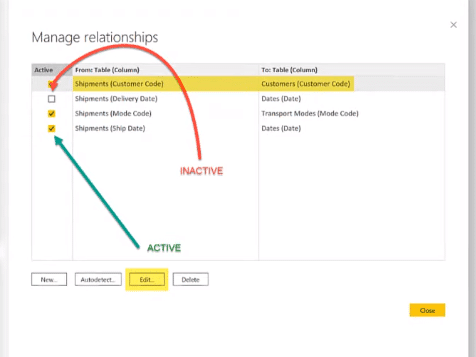
Remember that you can only have one active relationship between any two tables, but you can’t have many inactive relationships.
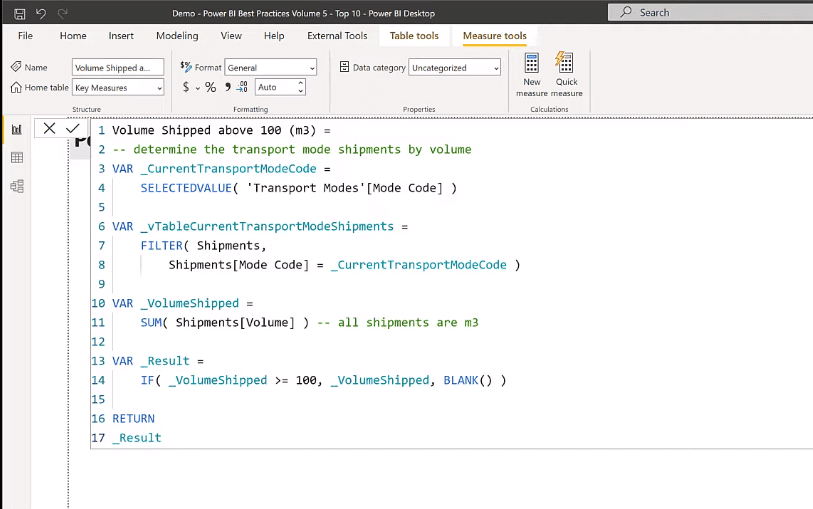
6 – Use Verbose Variable Naming
With respect to Verbose Variable Naming, I’ve always tried to code for clarity, and I find that using verbose variable names really helps my code to be clear. When I use verbose variable names, I rarely need to add explanatory comments and it greatly reduces the simple errors in my code when I choose the wrong variable.
I also use the underscore prefix on my variable names. It increases readability and it improves the type of headless provided by IntelliSense.
7- Use SWITCH TRUE Instead Of Nested IF Statements
Another best practice in Power BI reporting, which I highly recommend, is the use of SWITCH TRUE. As I’ve said before, I strive to code for clarity, and I find that one of the best ways to do this is to avoid the use of nested IF statements.
Let’s look at an example here using a nested IF statement.
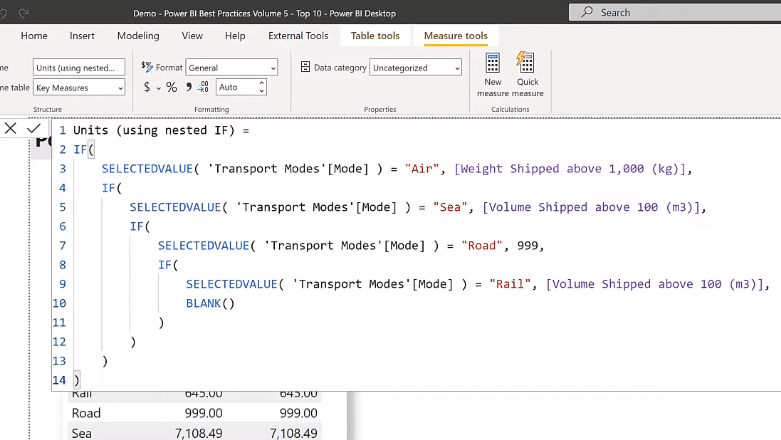
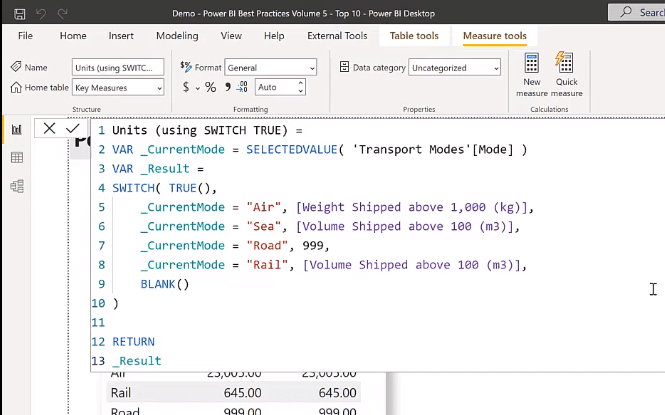
I prefer to use the SWITCH TRUE logic instead especially with the use of variables above it. The SWITCH TRUE statement and RETURN Result construct are clearer than when using nested IF statement.
In the formula using SWITCH TRUE, I find it much easier to read.
8 – Use Measure Branching Technique
Part of my Top 10 Best Practices in Power BI reporting list is measure branching. It’s one of the best ways to develop DAX calculations. You start with your simple or basic measures and build up complex calculations.
I find that measure branching as one of the best techniques for writing clear code. It makes it far easier to debug complex calculations as the individual components can be easily added to a validation table on a work page.

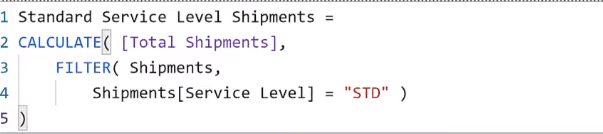
Let’s have a quick look at this example below. My base measure here is Total Shipments, which is a simple COUNTROWS. I can branch off to Standard Service Level Shipments, which is a simple CALCULATE using that Total Shipments-based measure.
9 – Use FORMAT/GENERAL For Visual Sizing Or Spacing
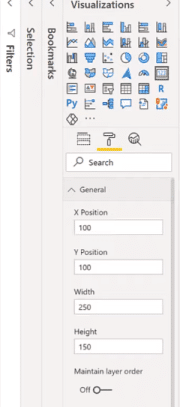
I’m a big believer in consistency, and I often find that report consumers comment first on small differences in size alignment or spacing rather than data. So, one of the best ways to achieve this is to use the General section of the Format pane to set specific pixel values for the X, Y, width, and height to multiples of 10. This ensures consistency and I think it looks better.
Let’s have this Sea Shipments card as an example. Obviously, it has a different sizing setting from the Air Shipments card.

If I expand the Visualizations pane to the Format pane and open the General section, we’ll see that the X, Y, width, and height are set to multiples of 10.
10 – Table-First Development
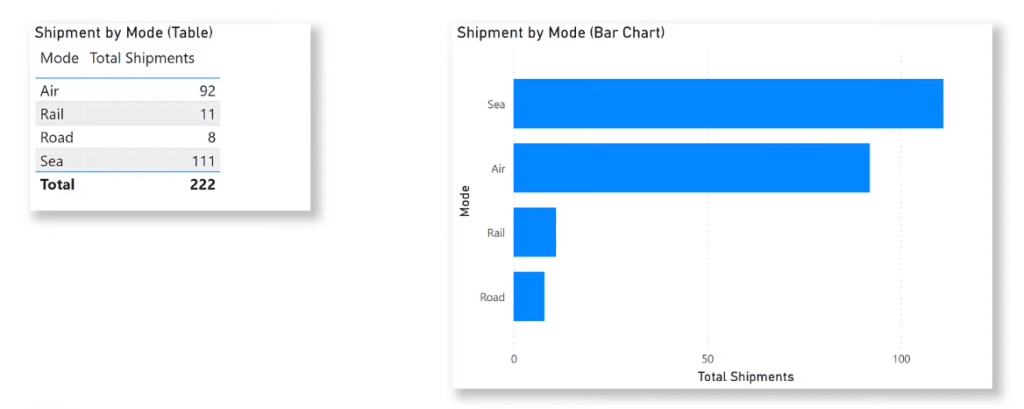
Last but not the least, we have Table-first Development. One of the most often overlooked truths about many visuals in Power BI is that they are really just tables rendered in different ways.
Sam has mentioned many times in his tutorials that one of the best ways to ensure that a visual presents the data you want is to create a table first that displays the table correctly. Then, create a copy of the table and change the visual type of the copy to the desired type, such as a bar chart or an area chart.
***** Related Links *****
Power BI Design – Best Practice Tips For Dashboards
Tips For Power BI Report Design – Best Practices
Top 3 Best Practices To Organize Your Power BI Models
Conclusion
That’s it for my 10 favorite best practices in Power BI report development plus my three favorite options. I recommend that you try and implement all these techniques when you’re creating your own reports.
I hope this is helpful for your Power BI journey. Check out the links below for more related content
All the best!
Greg


