
In this blog, I’m going to compare Power BI calculated column and measures, and then cover some of their differences. You may watch the full video of this tutorial at the bottom of this blog.
I’m also going to show you optimal situations where you can use either of them.

Creating Calculated Columns
I’m going to start by creating a calculated column in Power BI. This is probably what you’re most familiar with if you come from an Excel background.
In Excel, you’re used to getting a table of data, entering some Excel formulas, and then doing it all over again until you get the desired result.
You can also do this inside Power BI.
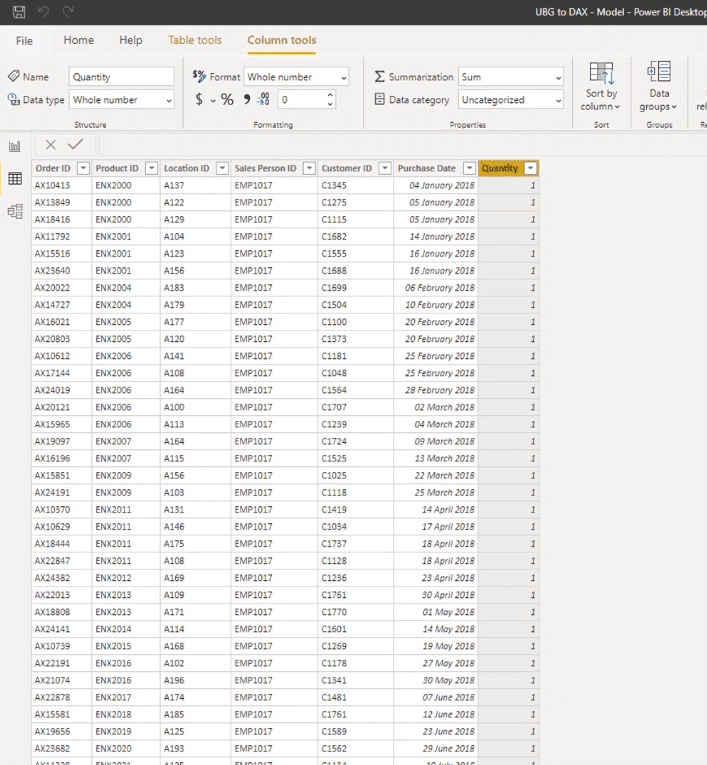
As you can see, there isn’t really that much information in the Sales table that I have.
However, in my Products table, there is quite a bit of useful information that I could use, such as the current price of the product, the cost of the product, and so on.

I’ll add a calculated column in the Sales table then find a formula or a function which will enable me to bring the pieces of information from the Products table to the Sales table. I would then place it inside that calculated column.
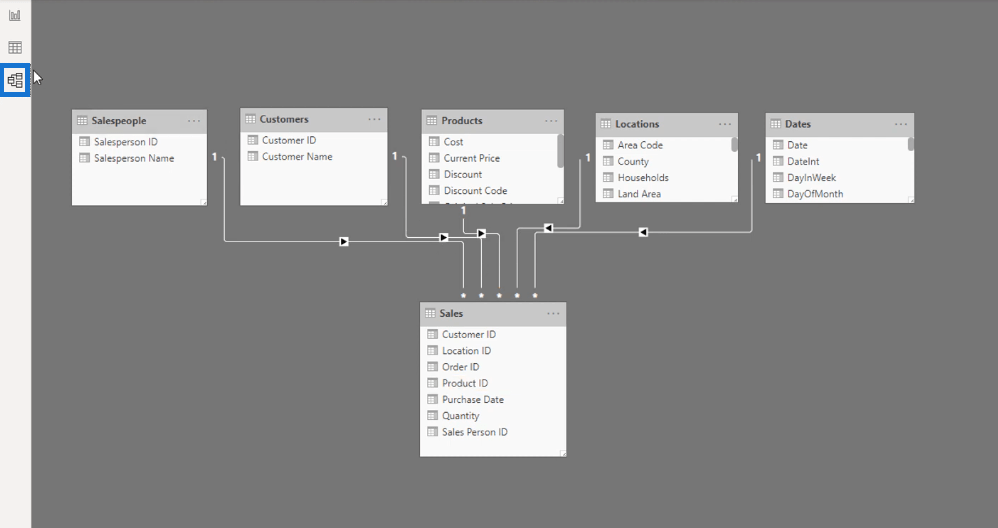
The model is a big part of why I can do this. This model that I’ve built enables me to achieve such a thing.

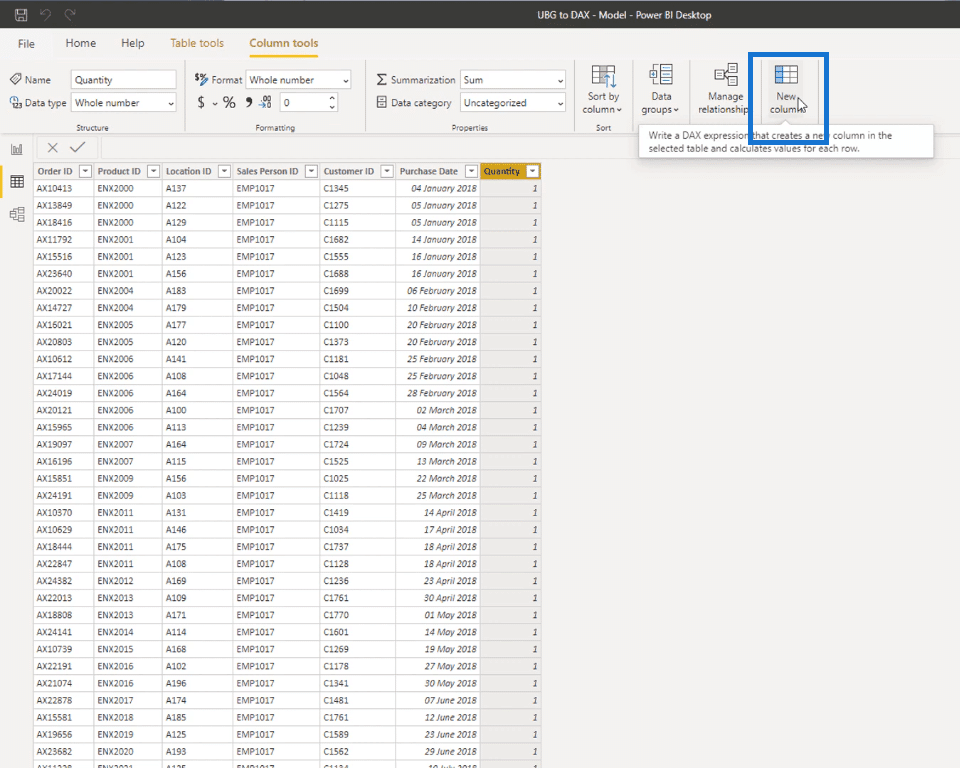
To create a calculated column in Power BI, click New Column.
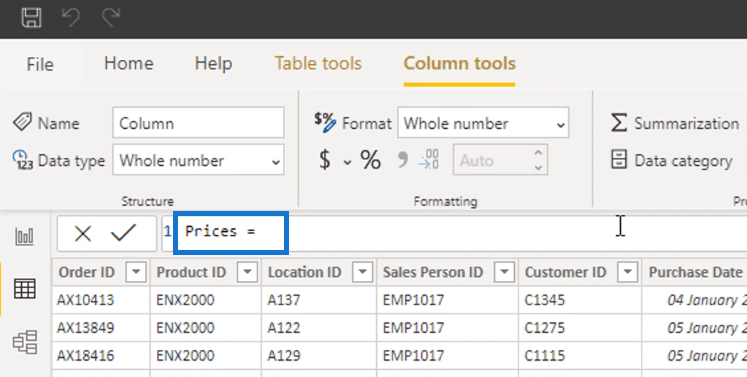
I’m going to name this column “Prices”.
In the formula bar, I’ll change “Column” to “Prices”.
I’m going to start adding the formulas I need.
First, I’m going to use the RELATED function, a function that returns a related value from another table.
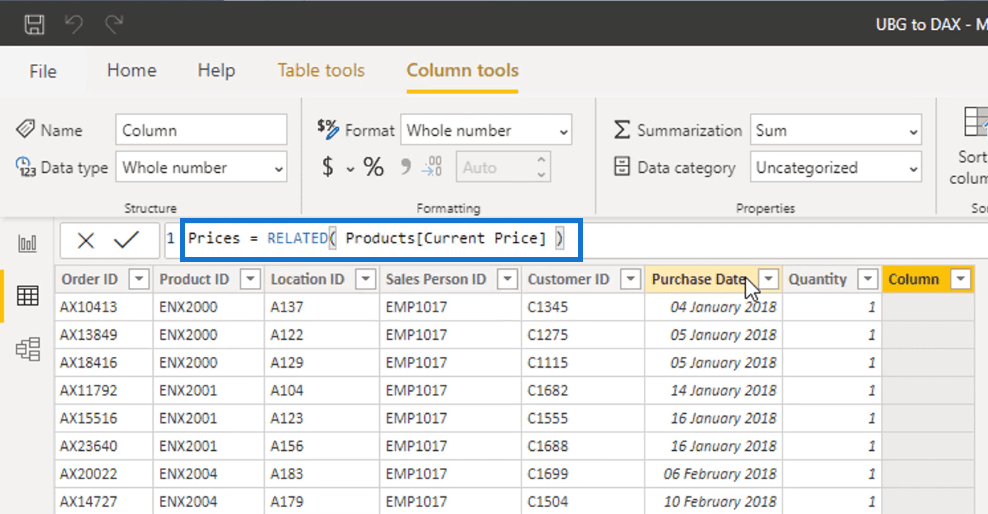
Inside the RELATED function, enter “Current Price”, select the Current Price column from the Products table then close the parentheses right after.
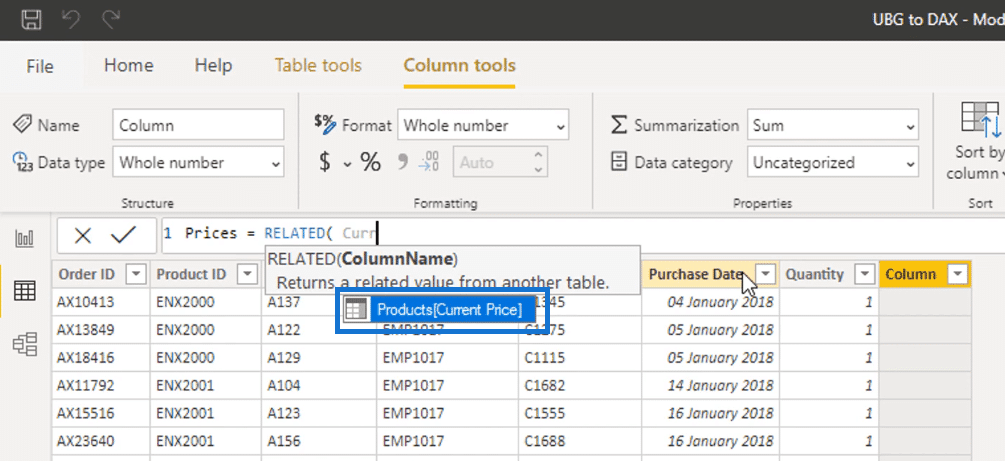
Basically, what I did was I transferred the values from the Current Price column in the Products table to the calculated column. I did this by referencing the Current Price column inside the RELATED function.
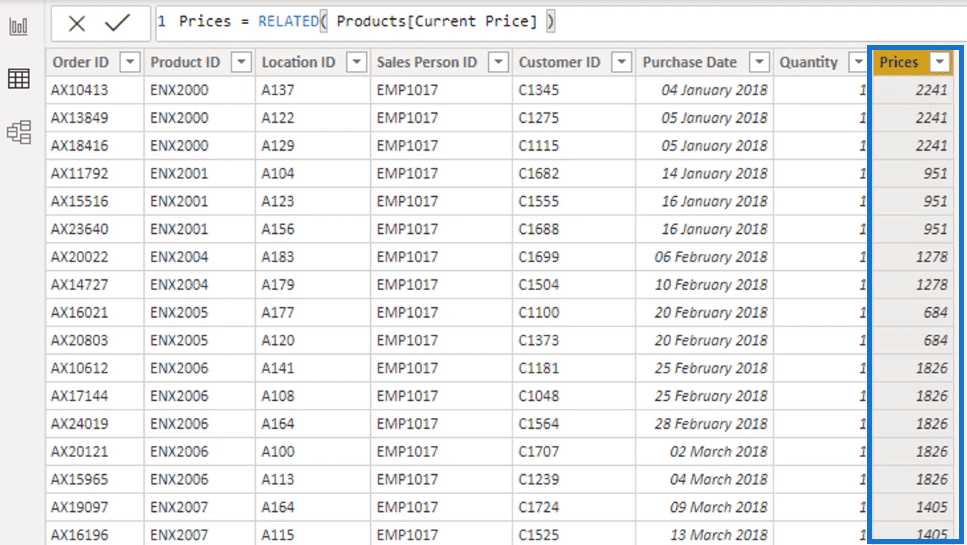
Every row of this Sales table represents a single transaction.
Notice that after entering the formula, the prices that correspond to each Product that was bought in every transaction are now showing.
I can also add a new Power BI calculated column which I will call as Revenue.
To do this click the New column again.

Then in the formula bar, change Column to Revenue.
Enter Prices and then click the Prices column from the Sales table to reference it.

After doing that, I’m going to multiply the values in this column to the values in the Quantity column.
I’ll enter the multiplication operator ‘*‘ and select the Quantity column from the Sales table.

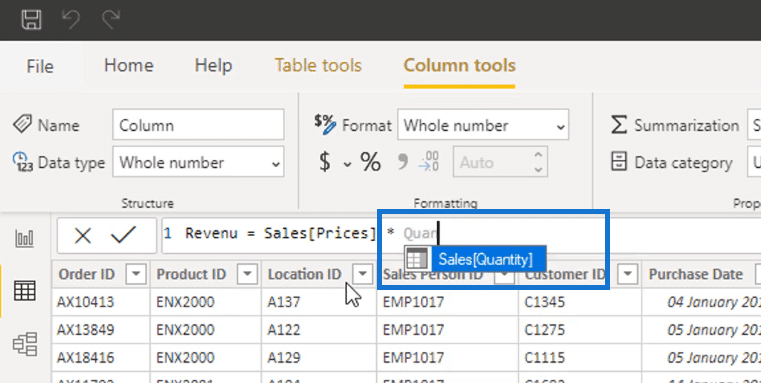
I added the Revenue column in the Sales table by referencing the Prices column and then multiplying it by the Quantity column.

To add additional information into your tables just like what I did here, you will need to create lots of calculated columns.
However, the great thing with Power BI is that if you set up your model correctly, you do not need to do this. You can use measures and DAX functions inside these measures instead of calculated columns.
While calculated columns do have their purpose, putting them in your fact table isn’t really an optimized way.

However, it does make sense to use calculated columns in the lookup table. I will explain why later.

But before that, I’ll show you how measures works inside Power BI.
Creating Measures
First, I’m going to grab the customer’s name, and then drag it to the canvas.

And then, I will turn it into a table by clicking on the highlighted icon in the Visualizations tab.

Now, I’m going to write a formula as a measure to show you that I can also calculate the Revenue number that I got earlier without the need to add data points inside the fact table.
In the Fields tab, under the Sales table, I can see the Revenue column that I made earlier.
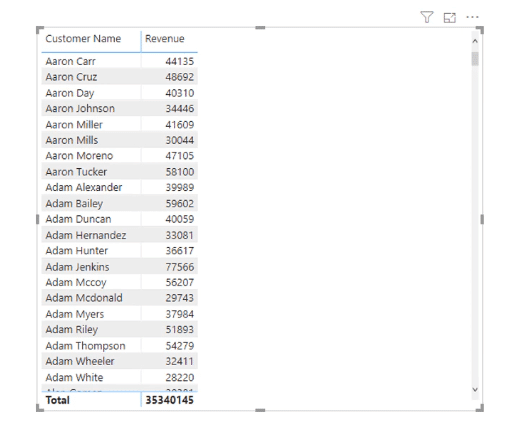
I’m going to grab this column and drag it to the table.

After doing that, I can now see the Revenue that I get from each of the customers.
I don’t want you to do this in Power BI. When you want to bring some calculations into your visual, grabbing a column and dragging it into your visual isn’t the correct way to do it.
Using measures for calculation is the more optimal way of doing things.
I just dragged the column into my table to check if I could really get the same result using measures.
Measures, which are very different from calculated columns, are like virtual calculations.
While a Power BI calculated column runs a calculation and then embeds data into a table, a measure runs a calculation only when you bring it into a visual.
It’s an amazing way to get lots of calculations done in your model without taking up room.
Now, I’m going to show you how a measure works. First, go to the Home tab, and then select New measure.

I’m going to call this measure Total Sales.


The first function that I’m going to use is called SUMX, an iterating function that returns the sum of an expression evaluated for each row in a table.
To add this function, I’m going to go to a new line by pressing Shift + Enter in my keyboard and then enter SUMX.

As you can see, the function requires me to enter a table and an expression.
The function will iterate through a table, and will then run an expression or a logic, depending on what you enter inside the function.
Here, I’m going to use the Sales table I have.
Inside the function, I’ll enter Sales and then click the Sales table to reference it.

For the expression, I’ll iterate through the Sales table. Then at every row, I’m going to multiply the values from the Quantity column to the values from the Current Price column in the Products table.
Just like what I did earlier, in order to retrieve the values from the Current Price column, I need to use the RELATED function.
To do this, enter Quantity and then select the Quantity column from the Sales table. Then enter the multiplication operator ‘*’ right after.

Now, to get the values from the Current Price column, enter the RELATED function. Inside it, type in Current Price and then select the Current Price column from the Products table.

The RELATED function returns a related value from another table, which in this case, is the Products table.

The formula that I’ve set up, which is seen above, might seem familiar to you. This is what I did exactly in the calculated columns to get the Revenue number.
The main difference here is that within the measure, the calculations are done virtually. This means it runs the same logic, but it doesn’t require me to add any data points inside the fact table.
After pressing Enter, you can now see the measure in the front end of the Sales table under the Fields tab.
You would know that it is a measure when the name has a calculator icon next to it.
Grab the Total Sales measure, and then drag it into the table.

You will see that I got exactly the same result without adding data points inside my fact table. This has been done virtually in a more optimized way using DAX functions.

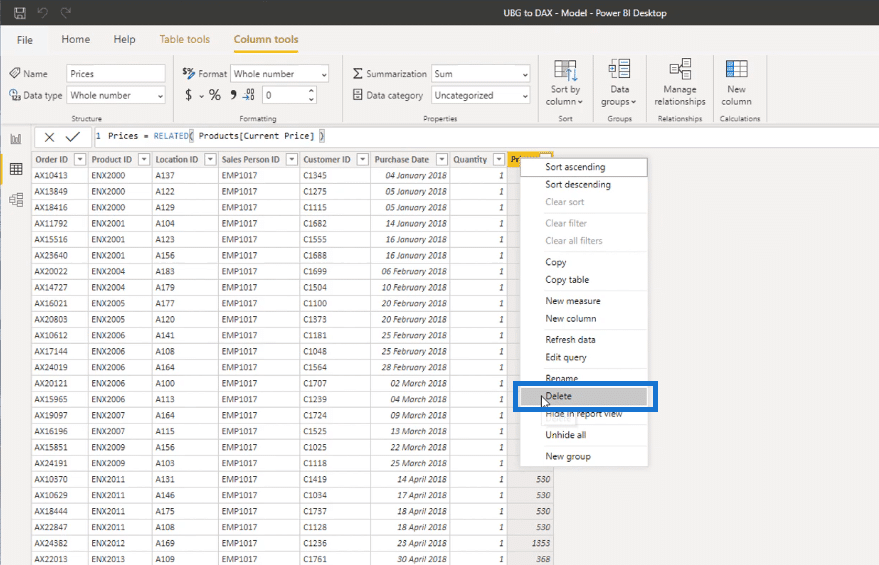
Now, as I said earlier, I don’t recommend dragging in columns into your visuals. I’m going to remove the Revenue column by clicking X as shown below.

Since I can calculate the Revenue without the calculated columns that I made earlier, I’m going to remove them since I don’t really need them.
First, I’ll delete the Revenue column.

And then, I will also remove the Prices column.
Every data point in your model takes up some memory. In smaller models, having unnecessary data points is not a big deal.
But sometimes you would encounter models with millions of rows. In that case, we’re wasting some memory on the millions of rows that we don’t really need.
In this particular table, I have 15,000 rows. By removing the unnecessary data points in the table, I optimized my model. I removed many rows that I don’t need.
Now, the Total Sales measure that I’ve made is totally dynamic. And I’ll show you why.
Under the Fields tab, grab the Salesperson table, and drag it into the visual.

After that, I’m going to add a filter by clicking the highlighted icon in the image below.

In this filter, you can see the Total Sales from each Salesperson.
Let’s select Carl Elliott.

You can see that the number changes. These new numbers now represent the Total Sales that you get from the products that Carl Elliott sold.
You could sort these numbers by clicking the header of the Total Sales column.

Here is another visual representation that you get by clicking the highlighted icon under the Visualizations tab.

If we select Ernest Wheeler in the Salesperson slicer, we get the Total Sales from the products that he sold.

As you have observed, the numbers or the visuals change every time we change the Salesperson.
This is why measures are dynamic. All of the calculations are made virtually behind the scenes, depending on the context.
This is just one formula. There are still a lot of DAX formulas that you can use for various purposes.
If you use DAX measures well and combine them with the right model, you can virtually calculate anything you can dream of.
If you don’t understand what’s going on inside your model, you’ll start thinking that you need to write more complex DAX formulas. However, DAX is easy to implement if you set up your model well.
DAX is certainly not simple. But the learning curve for it is not that huge, especially if you know how to correctly set up your model.
Now, as another example, I’m going to create a new measure.
In the Home tab, click New measure.

I’m going to name this new measure as Total Quantity. In the Formula Bar, change Measure to Total Quantity.

In this measure, I’m going to calculate the Total Quantity of products that I sell to each customer.
To do that, I’m going to use SUM, a function that adds all the numbers in a column. Inside the SUM function, I’m going to reference the Quantity column from the Sales table.
This is how I’ve set up the formula.

What happens is that the function adds up all the numbers inside our Quantity column. I’m basically adding up the quantity of the products that I’ve sold.
Now, grab the Total Quantity measure under the Fields tab, and drag it to the table.

After doing that, you can now see the number of products you sell to each of your customers.

If you want to see a breakdown of the products that you’ve sold and see what products in particular you have sold to each customer, you can drag the Product Name column to the values tab.

So now, I have a breakdown of the Total Sales and Total Quantity in terms of the Customer and the Product Name. This was only made possible by the data model that I’ve set up.

Proper Usage Of Calculated Columns
The last thing I want to show you is where to use a calculated column in Power BI. Calculated columns help build out your slicing and filtering possibilities.
Since all your transactions are at the base of your model, which is also your fact table, all the calculations are done there.
On the other hand, the top parts of your model, which are your lookup tables, filter all of your calculations depending on what logic you put into your calculations.
As an example, I’ll go to the Dates table.

Say for example, I want to filter my calculations according to Months. But for visualization purposes, I want the names of the Month to be short, so I will only use the first 3 letters of the Month’s name.
Since I don’t have that Short Month filter in my Dates table, I’m going to make one.
Add a new column to the Dates table by clicking New column.

Since I want to name this column Short Month, I’m going to change Column to Short Month in the formula bar.

Then, I’m going to use the LEFT function that returns a specified number of characters from a text.
Enter the LEFT function, and then inside it reference the MonthName column from the Dates Table. Put 3, since we only want the first 3 letters of the Month Name.
This is how I’ve set up the formula.

The formula takes the first 3 letters of every value in the MonthName column and returns it to the Short Month column that we just made.

This is what I mean by building out your filtering tables.
Here, you can’t actually use DAX measures since there is no calculation involved.
So to construct the columns that you will be using to filter your calculations, you need to use calculated columns.
Let’s now use the column that I just made to filter out our earlier calculations.
Under the Fields tab, grab the Short Month column and drag it into your table.

To create a filter using the Short Month column, click the highlighted icon under the Visualizations tab as shown below.

Now, if you choose a certain month, you can see that the calculations are being filtered depending on the sales that you’ve had on that month.
Here is an example if you choose January as your Short Month filter.

As you can see, the months in the Short Month filter are not really sorted out. To fix this, go back to the Dates table. You can see the MonthOfYear column that you can use to sort your filter out.

To sort your filter out, select the Short Month column, go to the Column Tools tab, select Sort by column, and then click on the MonthOfYear column.

After that, you’ll see that your filter is now in the correct order.

***** Related Links *****
Learn How To Harvest Power BI Slicer Selections To Use Within Other Measures
Placing Workday And Weekend Day Numbers Into The Date Table In Power BI
Show Results Up To Current Date Or A Specific Date In Power BI
Conclusion
In this blog, I covered the differences between Power BI calculated column and DAX measures. I also discussed the optimal ways of using either of these.
In your calculations, it is much more efficient to use DAX measures. You can do them without adding data points inside your fact table.
But when building out the lookup tables that you will use to filter your calculations, it makes sense to utilize calculated columns.
I hope this helps in your analysis, and I am excited for you to use both!
Have a good day!
Sam


