
What I’m looking to achieved here is to showcase how you can create a table on the fly in Power BI, then place a column of that table into a slicer to then extract or ‘harvest’ a value inside a measure. You may watch the full video of this tutorial at the bottom of this blog.
Then be able to insert this into an existing calculation or another measure that you have in your Power BI model.
Previously, the GENERATESERIES/SELECTEDVALUE functions within Power BI did not exist. So this was the old way you had to create simple tables or columns of information that could be used in slicers.

But this is still a great technique to learn and adapt in other situations.
Harvesting a Value Using a Slicer in Power BI
Let me walk you through the step-by-step process that you can use.
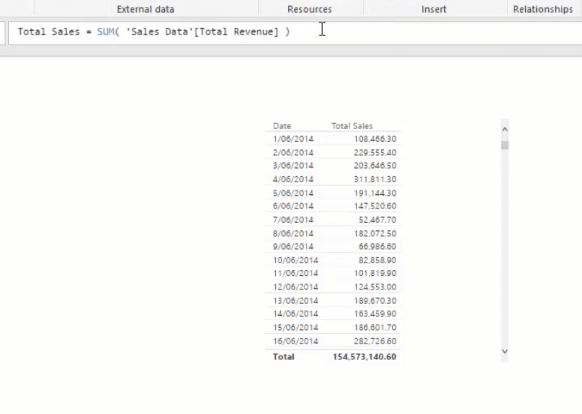
1. Create a table with the total sales measure where total sales is the sum of total revenue.
2. Add a percentage change column in the table.
3. To make it dynamic and to be able to see what the sales will be if it is increased by a certain percentage, create another table. This can be called percent change table.
4. Add the percentage. Let’s say 15%, 20%, 25%, and 30%.

5. Load that in to create the second table and turn it into a slicer.

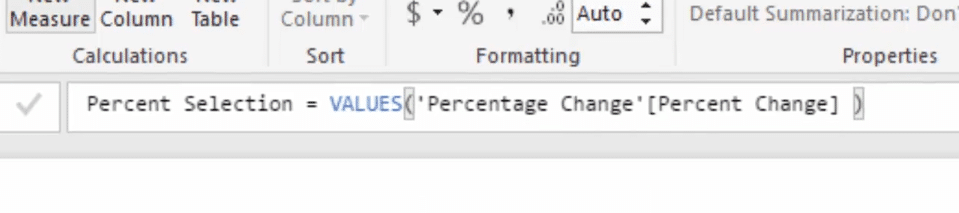
6. We can use the VALUES function to harvest the values from the Power BI slicer. Here is the formula:
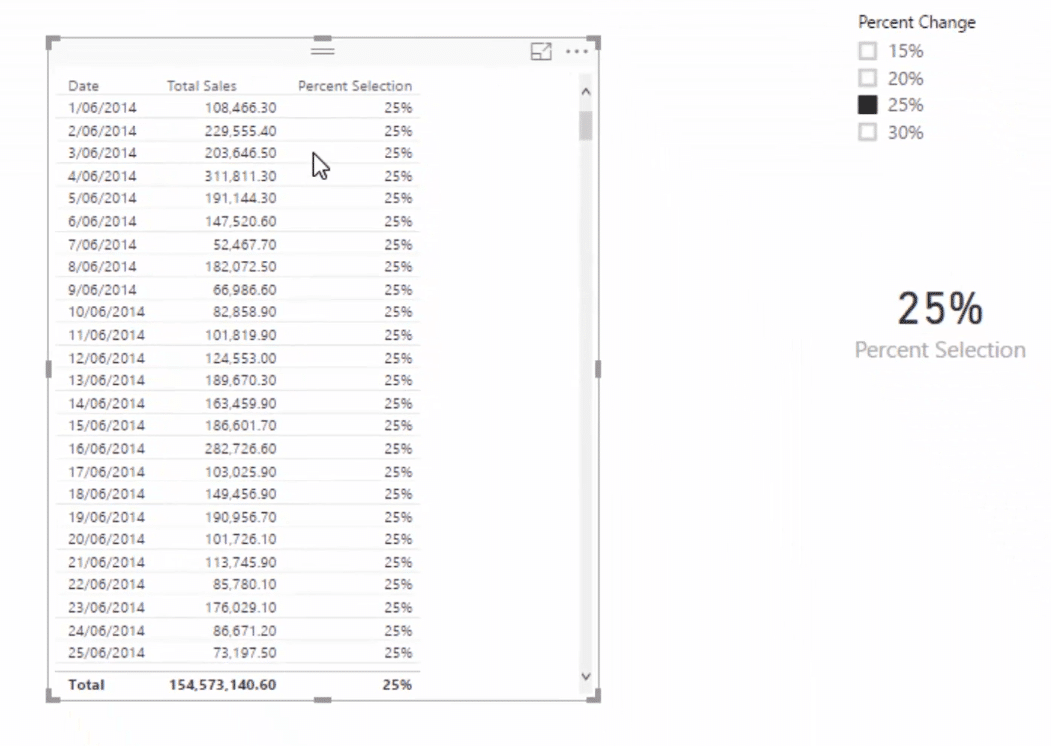
7. Load the percent selection measure and turn it into a card. The card will show whatever is selected in the slicer.
8. Drag the percent selection into the first table. Whatever is shown in the percent selection card will then be included in the table. In this case, 25% appears in every single row.
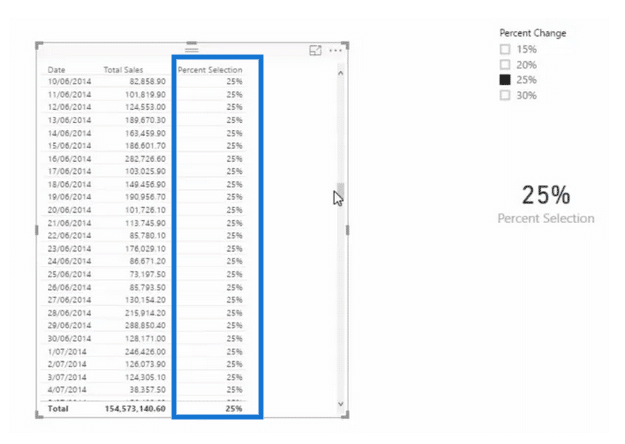
Now we have a dynamic calculation. Just select the percent change that you want to utilize.
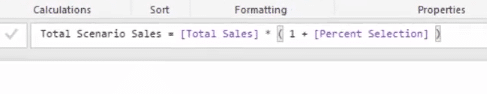
9. We can then create another measure and call it Total Scenario Sales. And then all we need to do is write a simple logic. This will be Total Sales times by 1 + the percent selection. The formula will look like this.
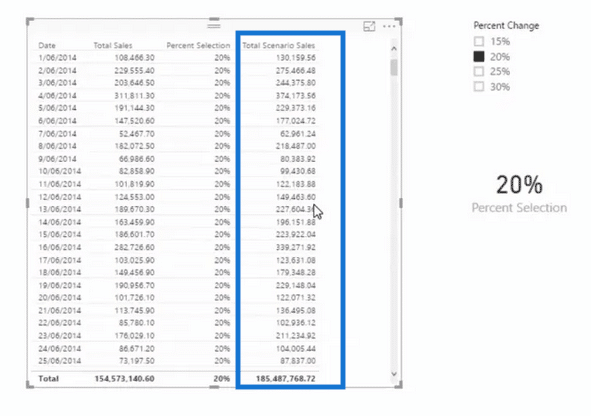
10. We can now bring out Total Scenario Sales which adds in the percent selection. We can select any of the different selections in the slicer and get the corresponding result.
In the table below, the total scenario sales column shows the total sales increased by 20%.
Resolving Possible Issues
We encountered a couple of issues while working on the example. In case you experience them too, this is how you can resolve them.
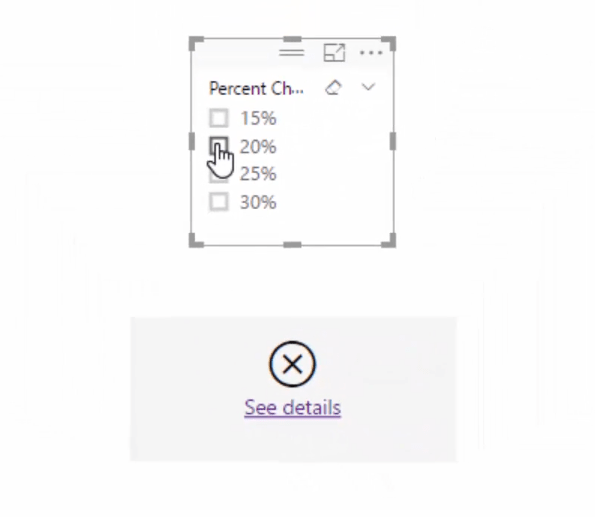
The first issue we encountered was, after creating a card, we get an error when nothing is selected in the slicer. Notice the “X” in the image below.
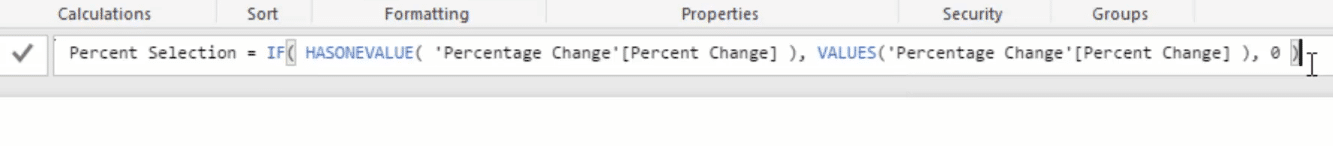
We need to add a simple logic in the percent selection formula to resolve this. What we can use here is the IF function, with the formula IF(LogicalTest, ResultIfTrue, [ResultIfFalse]).
Using the IF function, we’ve got IF(HASONEVALUE, then we’ll add the same column, (‘Percent Change’ [Percent Change]).
If that is true, then return that result, VALUES(‘Percent Change'[Percent Change]). If not, return zero percent change.
The new formula will be something like this one below.
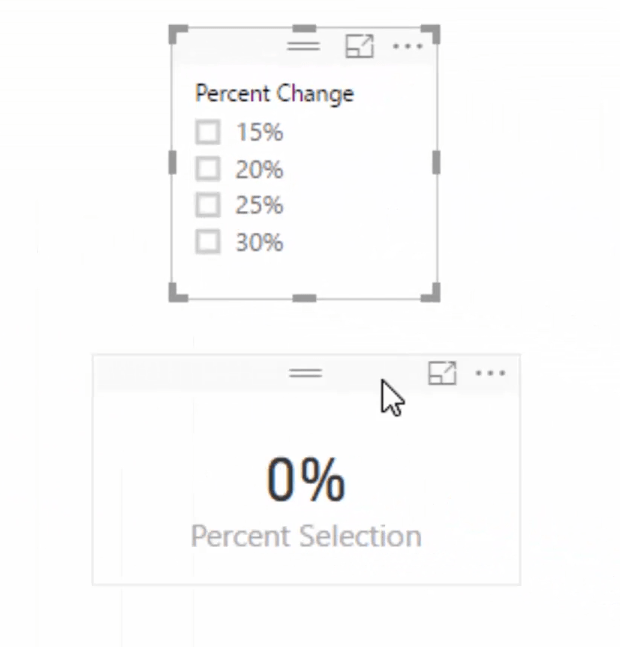
This will then give you a zero percentage if nothing is selected.

The second issue that we ran into was the table also shows the dates that don’t have any sales.
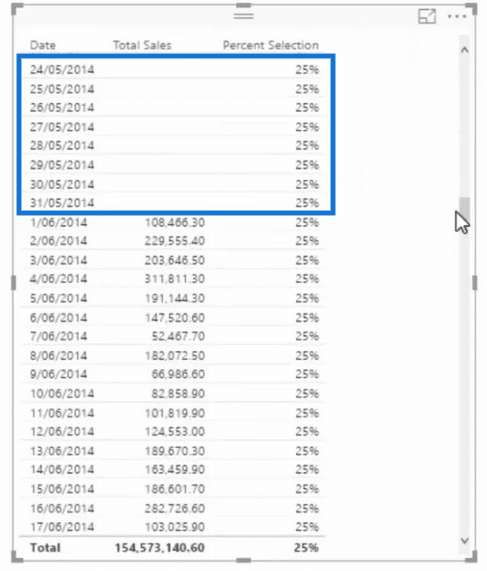
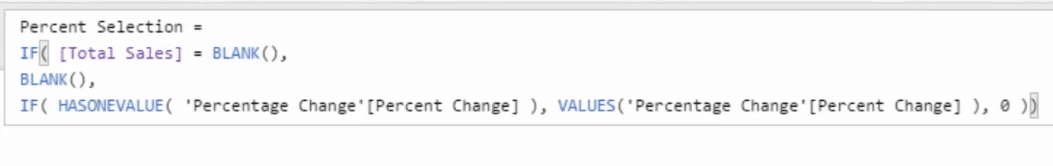
We want to remove them so that all that will be shown are the dates that have sales. To do this, we need to go back to our percent selection formula and add another logic.
In this case we need to add IF([Total Sales] is equal to blank, then we want it equal to BLANK, and if not, we want it to return the results.
The new formula will then look like this.
We are now able to remove all the blanks and the table shows only the data that we want.
***** Related Links *****
Quick Measures Deep Dive – How To Use Them in Power BI Models
Implementing DAX Measure Groups Into Your Power BI Reports – Modeling Review
Calculating Percent Profit Margins Using DAX in Power BI
Conclusion
When using Power BI you sometimes think you are limited to the data sitting within your tables. Well that is certainly not the case. You have tremendous flexibility to build on top of your data by bringing in values from additional tables to flex the numbers or stress your results with scenarios.
There are just so many applications for this in Power BI which is why I call this type of analytical work as building on top of your model.
As you start with the core data that you might extract from your database, bring in all these additional values to adjust results and see what may or may not occur within your results.
These techniques are how you really take your analysis within Power BI to the next level as you have almost unlimited ways to evaluate insights from your initial key metrics.
Check out the video below for more details on this technique (remember similar things can be achieved now with the GENERATESERIES/SELECTEDFUNCTIONS function and with the ‘What If’ parameter feature)
All the best,
Sam


