
One of the key features of Power BI is the slicer, which allows you to filter your data based on relevant metrics.
The default slicer value in Power BI refers to the initial selection that is displayed in a slicer when the report is loaded or refreshed. It determines which data subset is shown by default without any user interaction. In many cases, it’s essential to set a default slicer value to provide a meaningful starting point for your users when they open your report or dashboard.
Slicers in Power BI are particularly useful when you want to display specific date ranges, categories, or other attributes that drive focus on critical information.


With just a few clicks and customization, you can enhance your Power BI report’s functionality and cater to your target audience’s specific needs. Configuring your default slicer value can be easily achieved without advanced technical skills.
Let’s get started!
Working with Slicers in Power BI
Slicers take your data analysis to the next level by not only allowing you to sort and filter your data but also allowing you to define and benchmark visual aspects of your report.
In this section of the article, we’ll discuss some key aspects of working with slicers to transform your Power BI Dashboards.
1. Slicer Visual
Slicers are a visual way to add filters to your Power BI reports, allowing you to view and analyze your data model more efficiently.
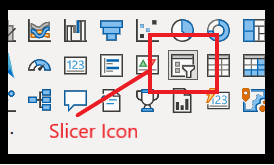
To get started with slicers, go to your report page in Power BI, go to the Visualizations pane, and click on the Slicer icon.

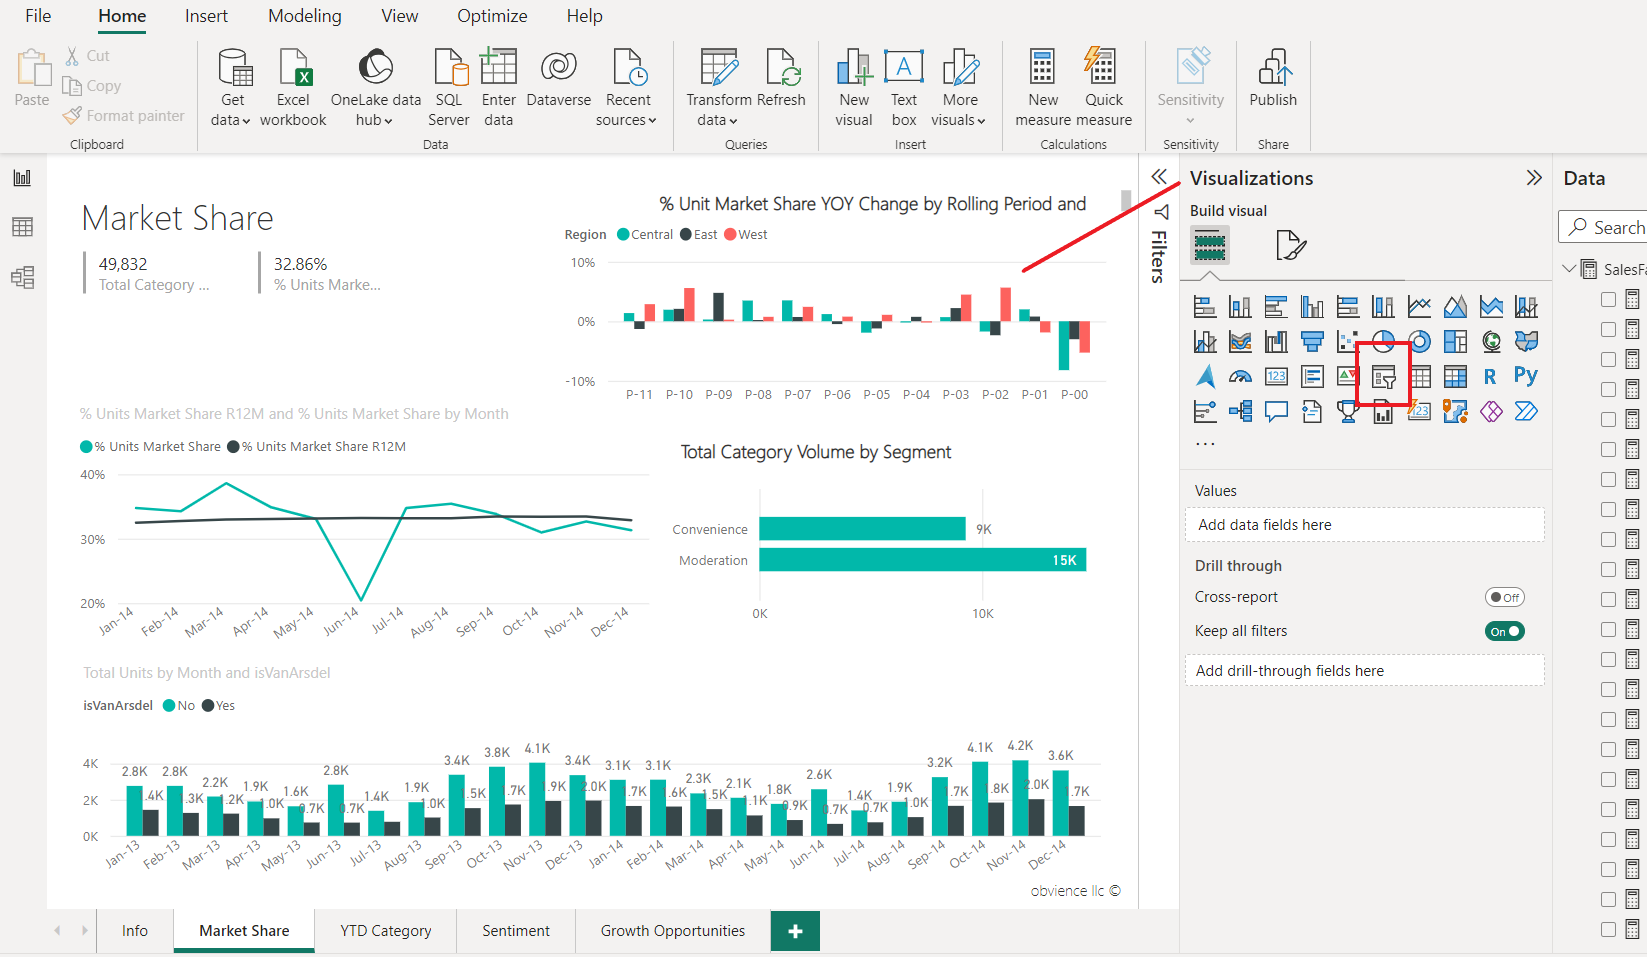
The slicer icon has been displayed below.
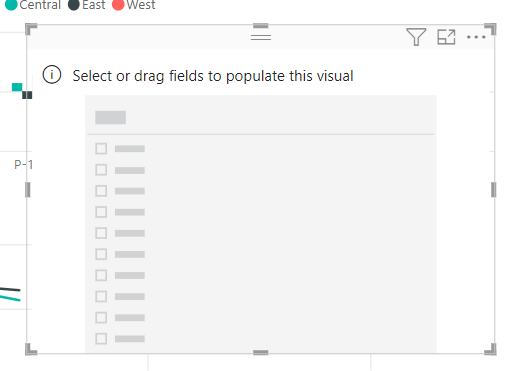
When you click on the slicer icon a new empty slicer will be added to the report page.
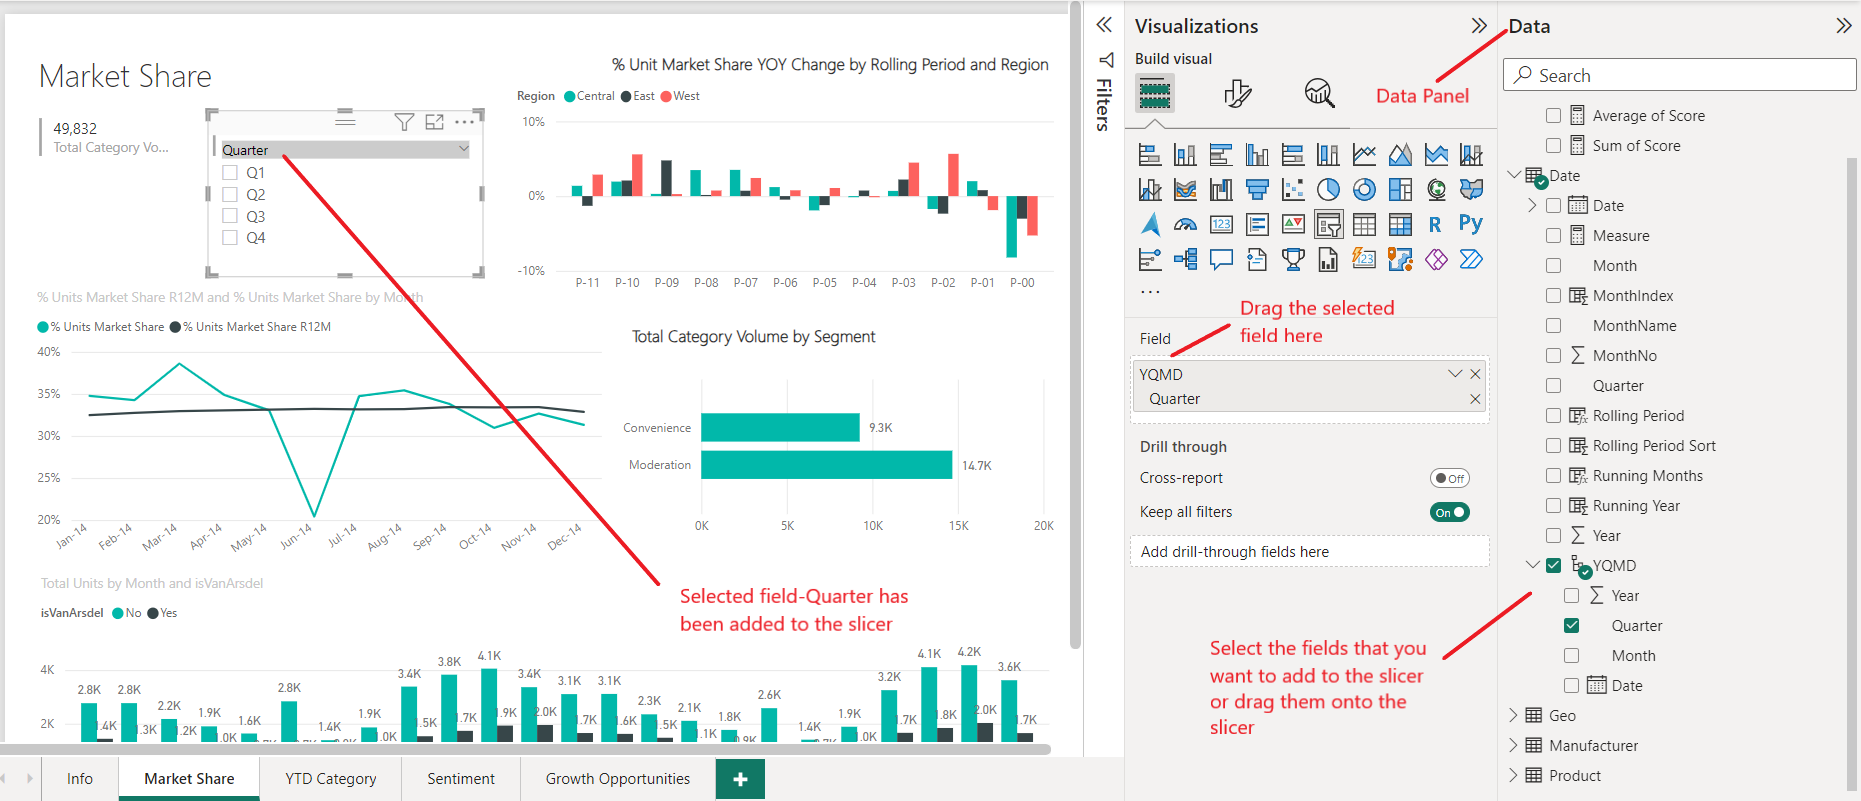
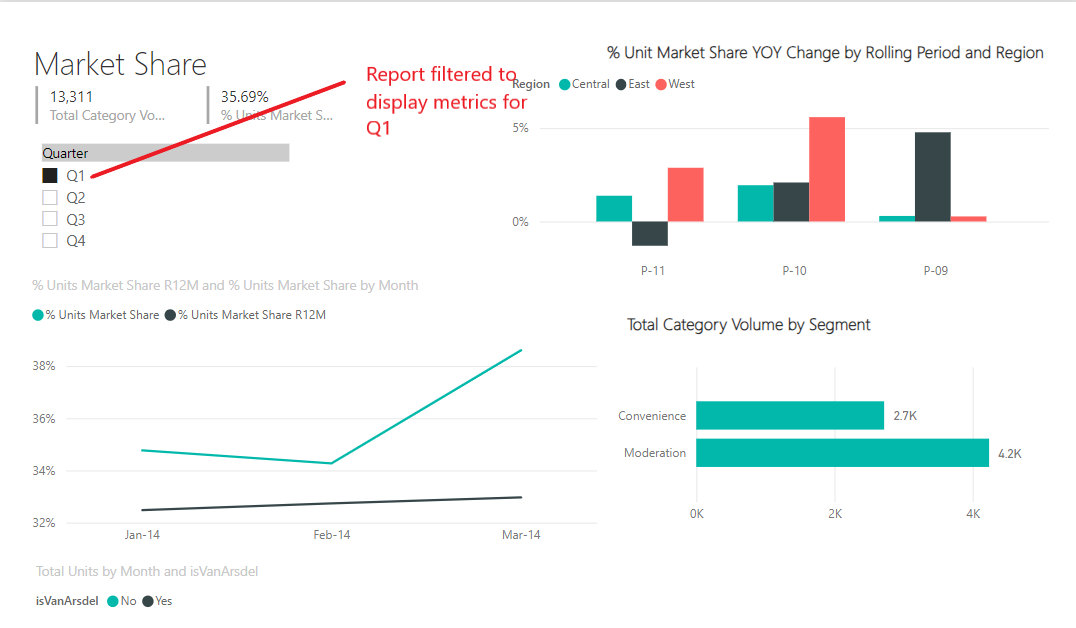
Select the fields that you want to add to the slicer from the Data panel, or simply drag and drop the field that you want to use to filter your data into the Field section under the Visualizations panel. In this case, we’ve sliced the data by quarters.
2. Filtering Using Slicers
Once you’ve added a slicer to your report, filtering your data becomes simple and intuitive. Select a data field within the slicer to filter the data in your report.
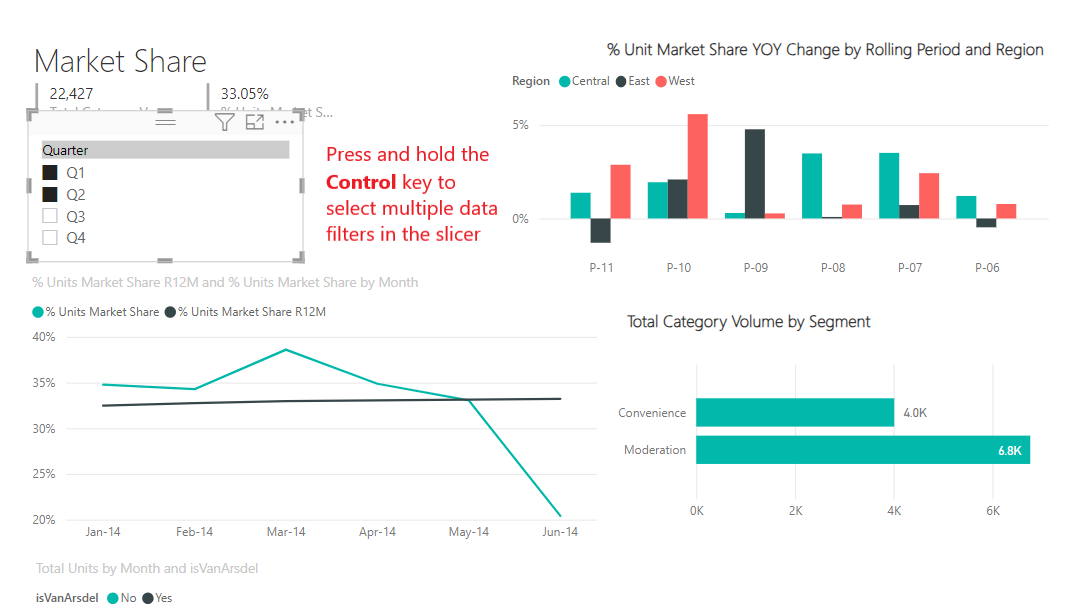
To select multiple data filters, hold the Ctrl button on your keyboard and click on the additional items.
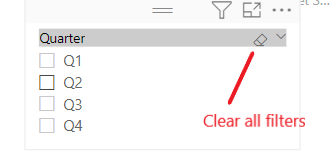
If you want to clear the filters applied to the slicer, click on the Eraser icon located at the top of the slicer visual.
3. Format Pane
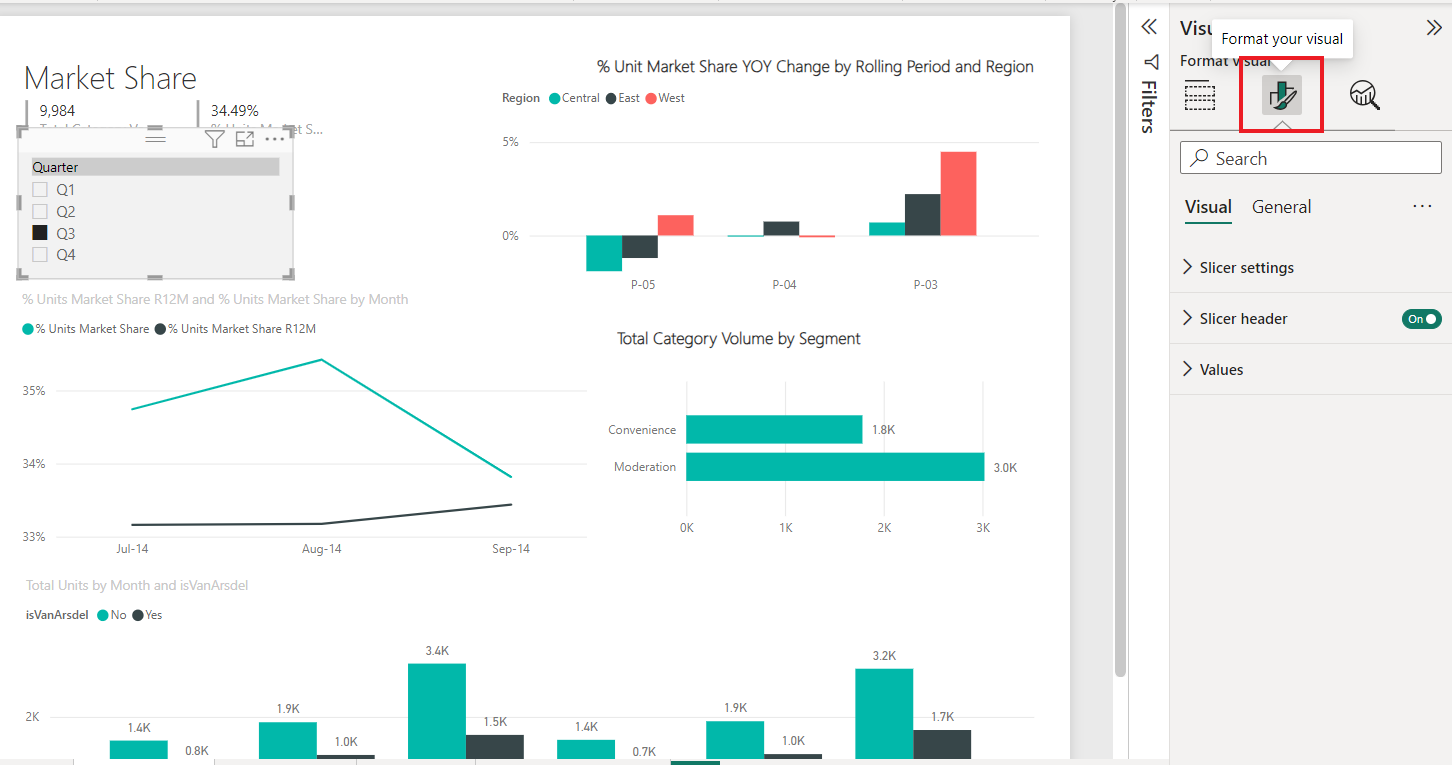
Power BI gives you the ability to customize the appearance of slicers to build an interactive report page. By using the Format pane, you can make various changes to the slicer’s layout, text settings, headers, and more.
To adjust the formatting, click on the slicer to make it active, then navigate to the Format icon in the Visualizations pane.
Some key formatting options include:
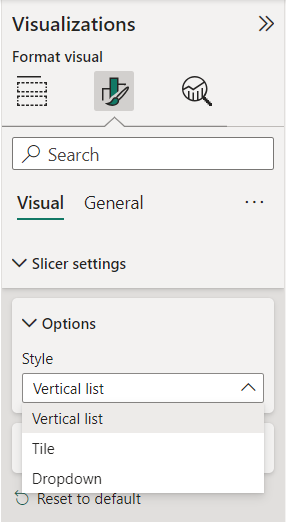
- Style: You can customize your Slicers values as vertical lists, tiles, and also drop-down menus from the Style section under Slicer Settings in the Visual tab.
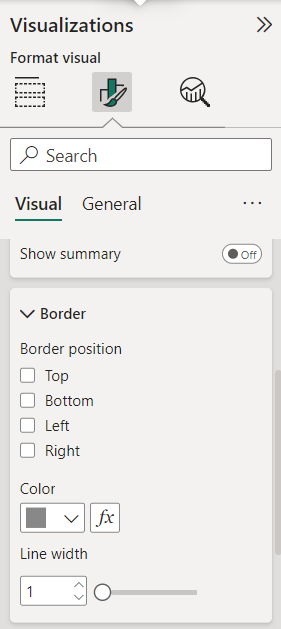
- Border: Customize your slicer borders using the Border section under the Format Visual tab.
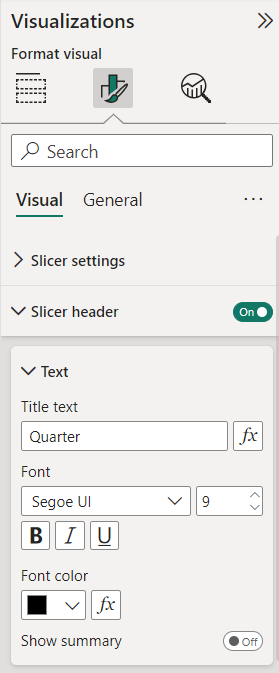
- Header: You can change the slicer’s header text, font, and size, and even add a summary to your slicer headers.
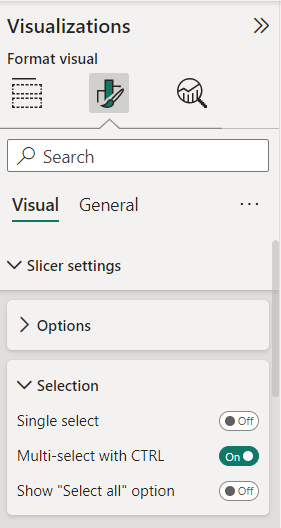
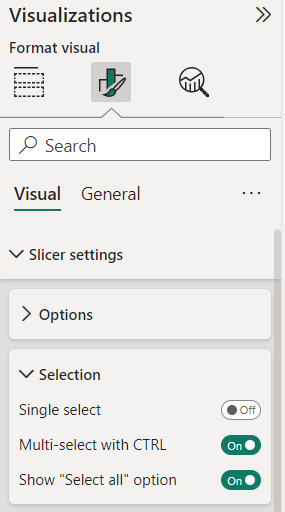
- Selection controls: Configure selection options for your slicer data, such as Single Select, Multi-select with CTRL, and Show “Select all” option, to allow or restrict the addition of metrics to your Power BI slicer.
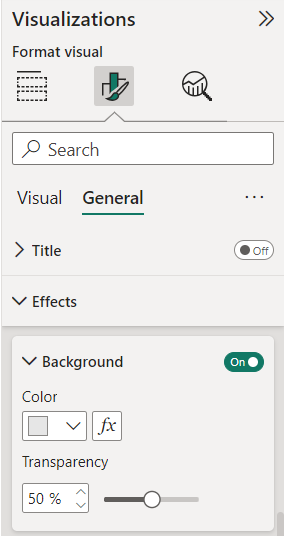
- Background: Add a background to your slicer using the Background option in the General tab.
OK, now that we’ve gone over how to set up slicer values, let’s discuss how you can set up default slicer values in the next section.
Setting Default Slicer Values
In this section, we’ll delve into the concept of setting default slicer values in Power BI. It’s often necessary to establish a default setting that guides the user experience and ensures consistency in data analysis.
This process, while straightforward, can significantly enhance the efficiency and effectiveness of your Power BI reports. By setting default slicer values, you can control the initial view of your data, making it easier for your audience to understand the insights you’re presenting.
Let’s explore how to accomplish this task.
1. Using Measures
You can set the default slicer value by using measures. First, create a measure that captures your default selection criteria. Follow the steps below to set default values for your slicer.
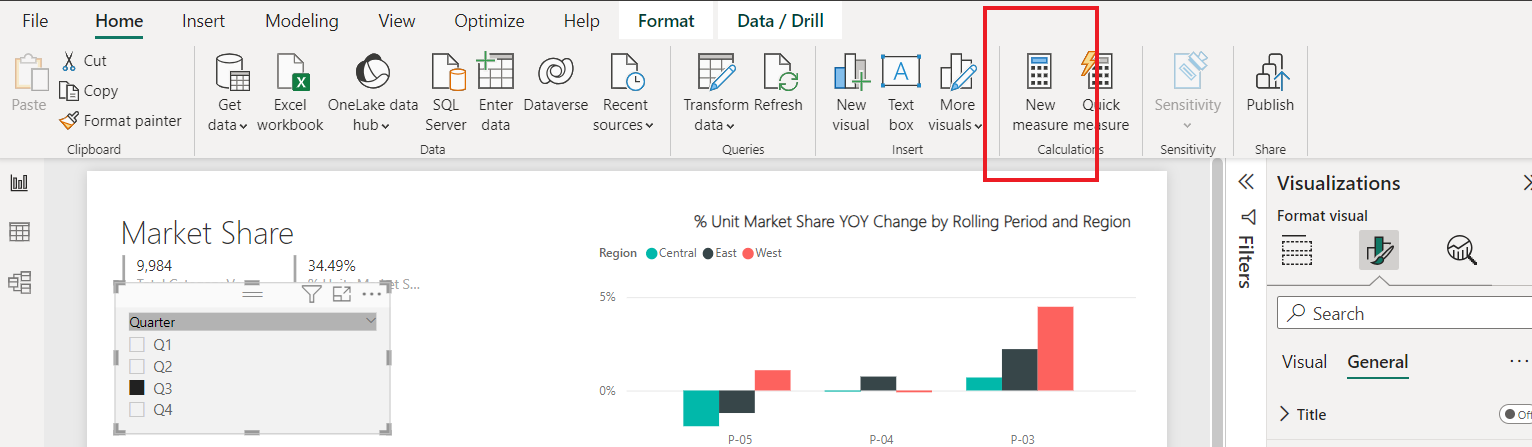
1. In your Power BI report page, navigate to the Home tab and select New Measure.

2. Enter the formula for the default value, based on your specific criteria. In this case, we are filtering the report based on the month column.
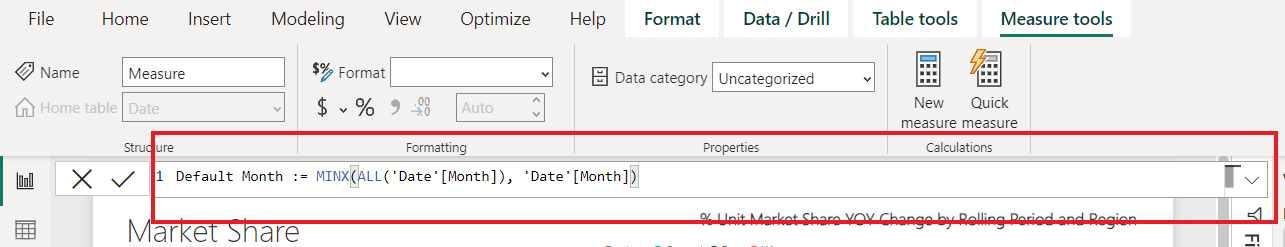
The following formula sets the default value to the earliest month in the dataset.
Default Month := MINX(ALL('Date'[Month]), 'Date'[Month])3. Add a slicer to your report by clicking on the Slicer visual from the Visualizations pane and setting the field property to the required column, in this case, Month.
4. In the slicer settings, under the Selection pane, set the Single selection mode (Off).
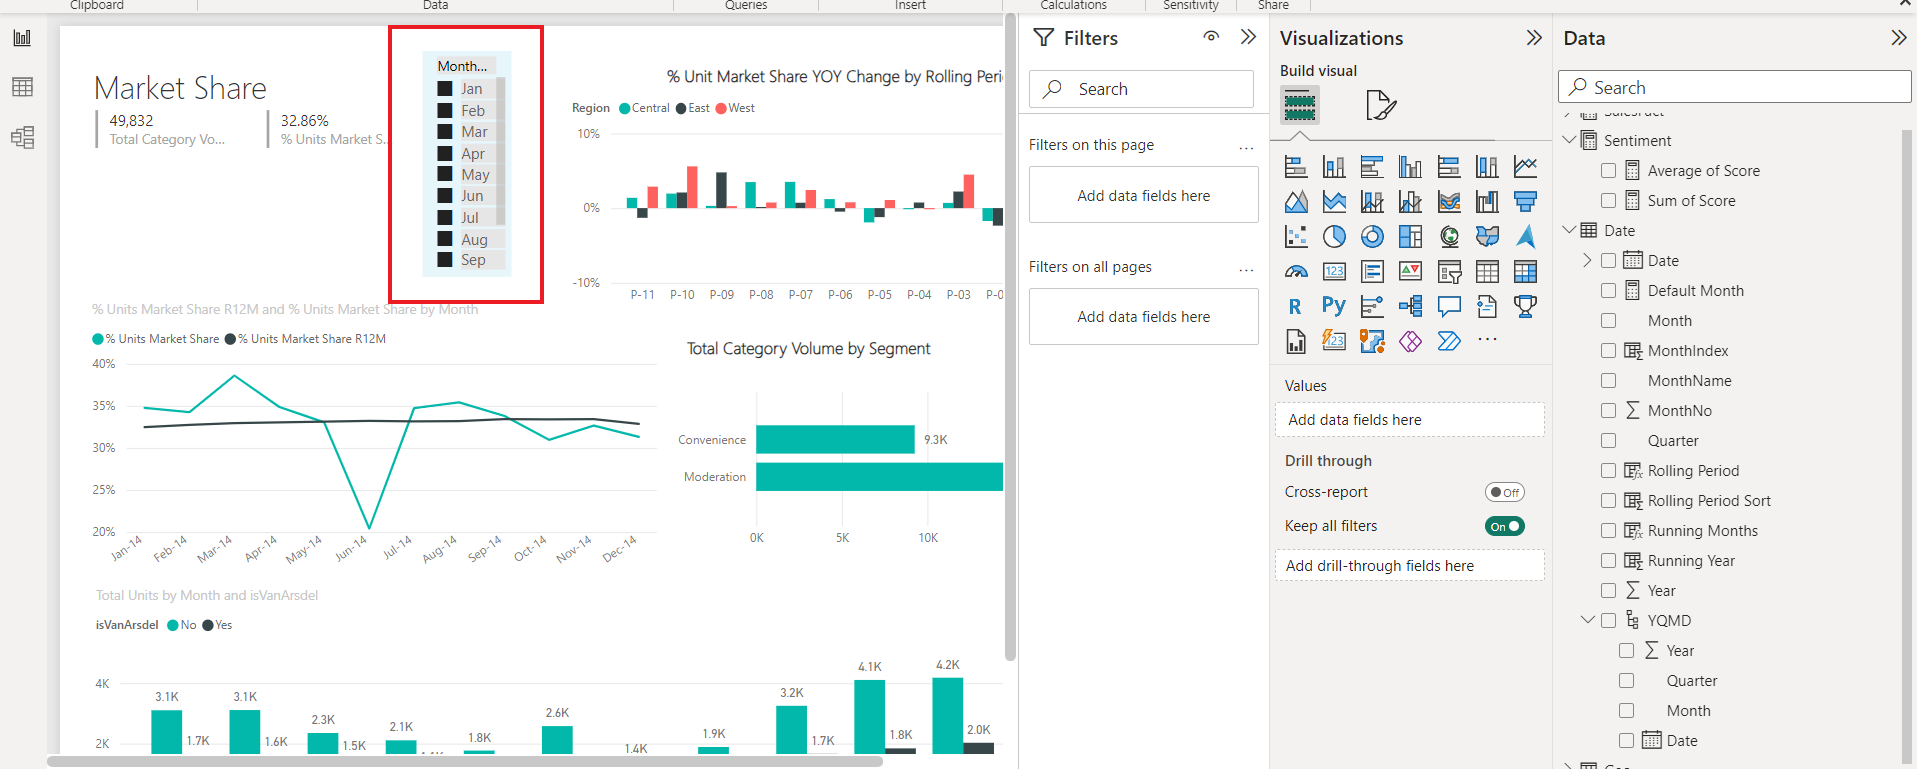
5. Drag the new measure you’ve created, in this example, Default Month, onto the Add data fields here box, under the filters panel of your Power BI Report.
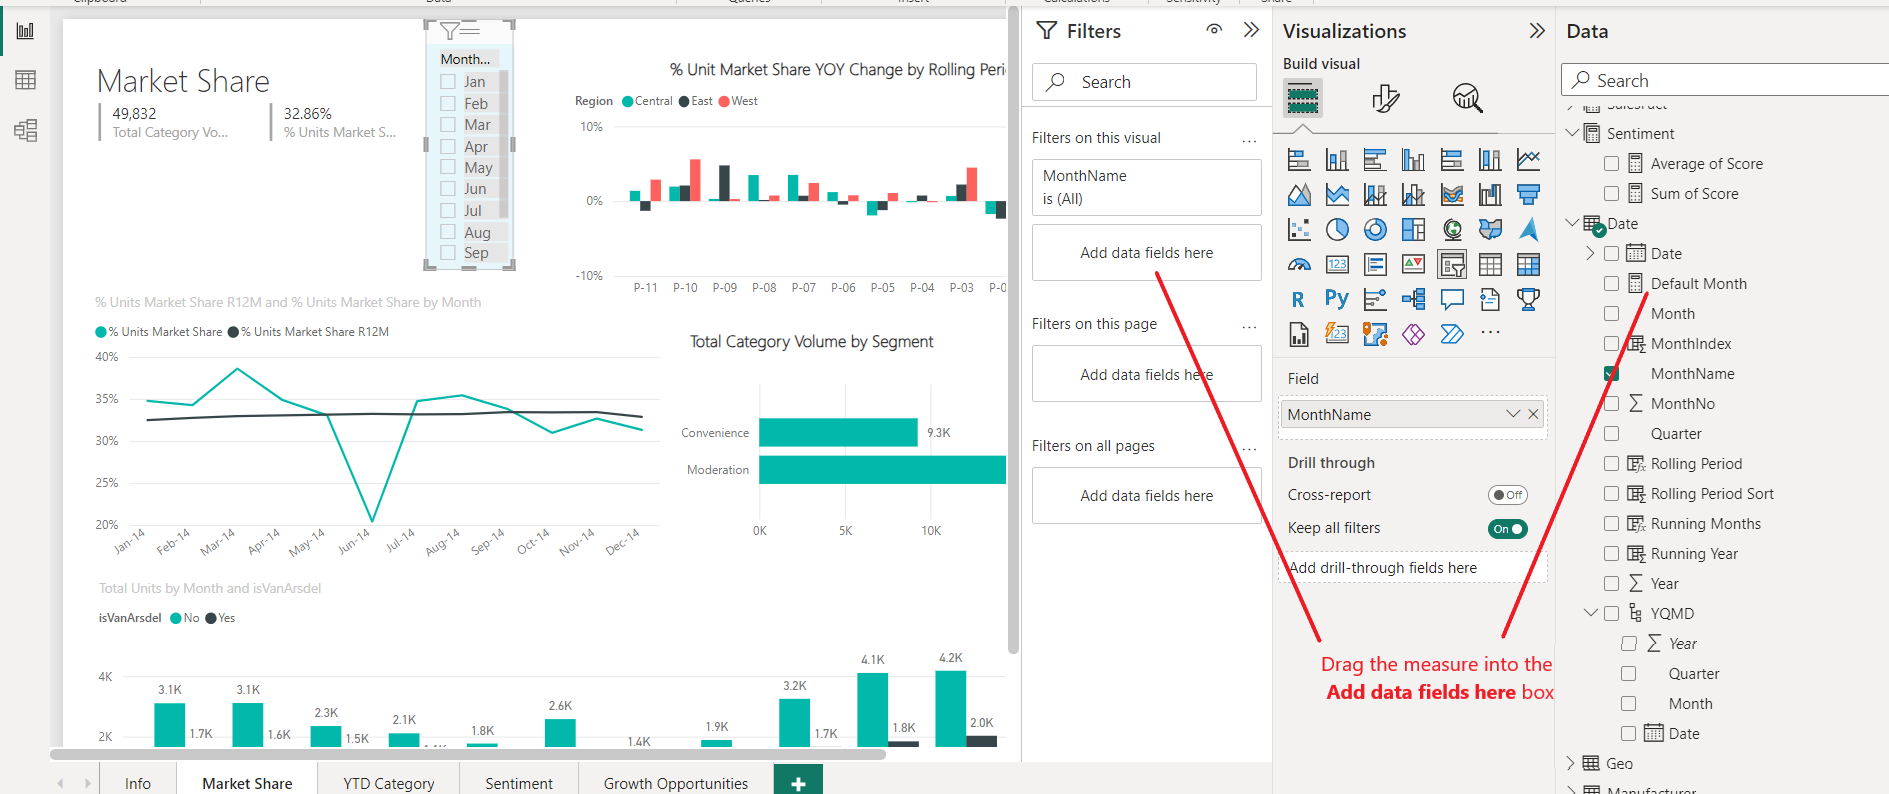
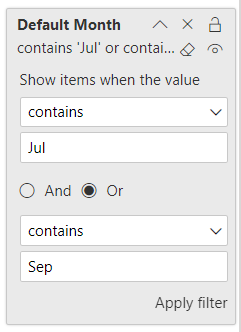
6. Configure the default slicer values for your report using the options provided under the Filters panel.
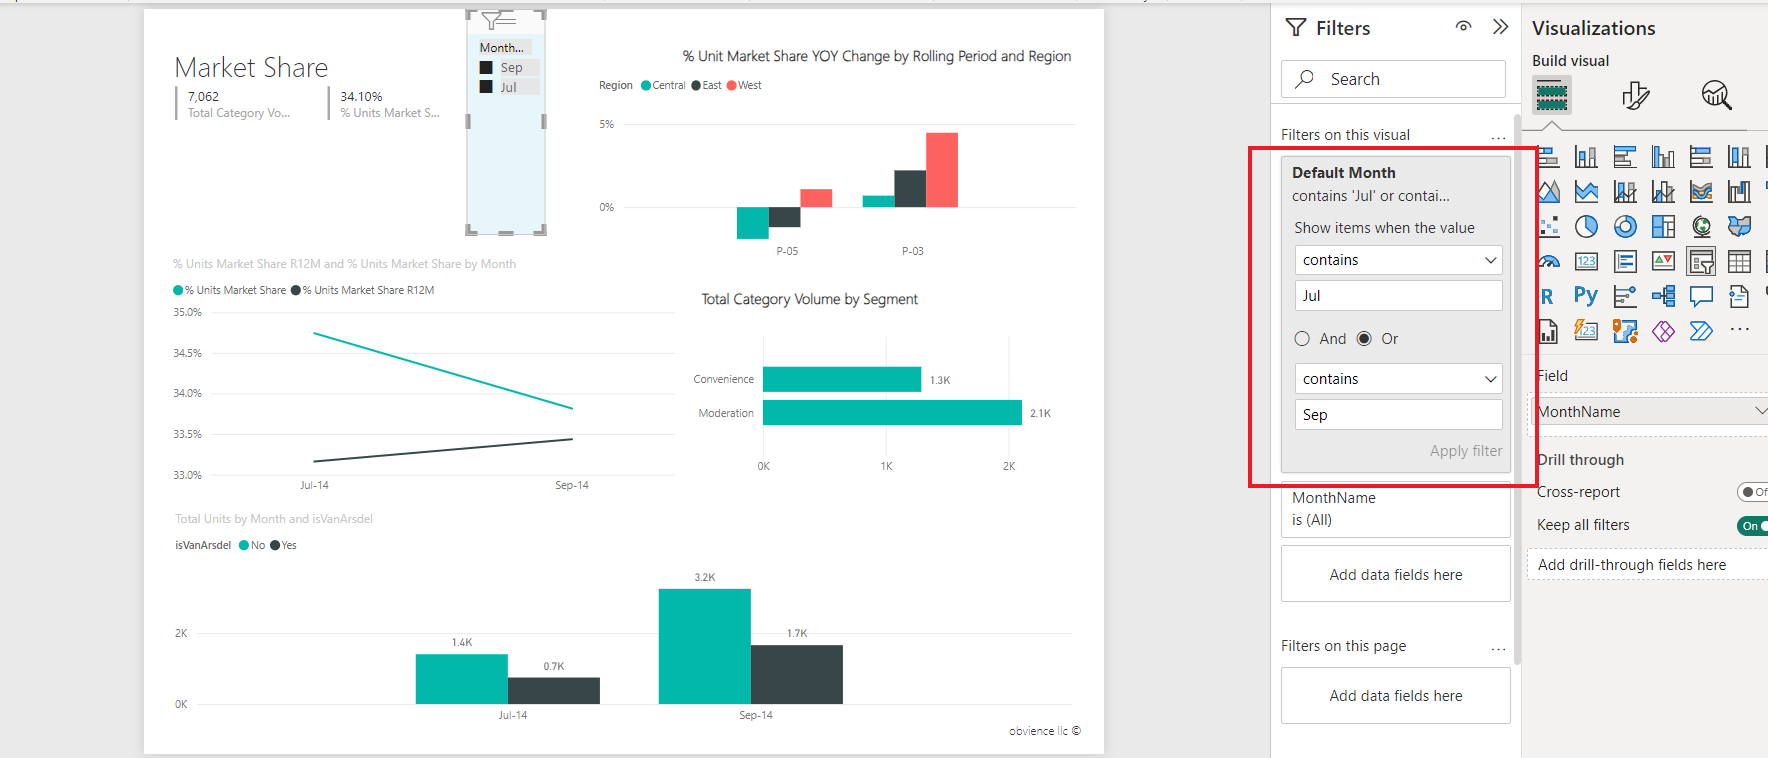
When a user opens the report, the slicer will automatically display the default value of the month column that you’ve set using the measure formula and transform the report based on the default value selection.
2. Implementing SQL
Another approach to setting default slicer values is using SQL. With this method, you can write a SQL query to define the default value, which can be based on a specific condition or the latest available data. Follow these steps:
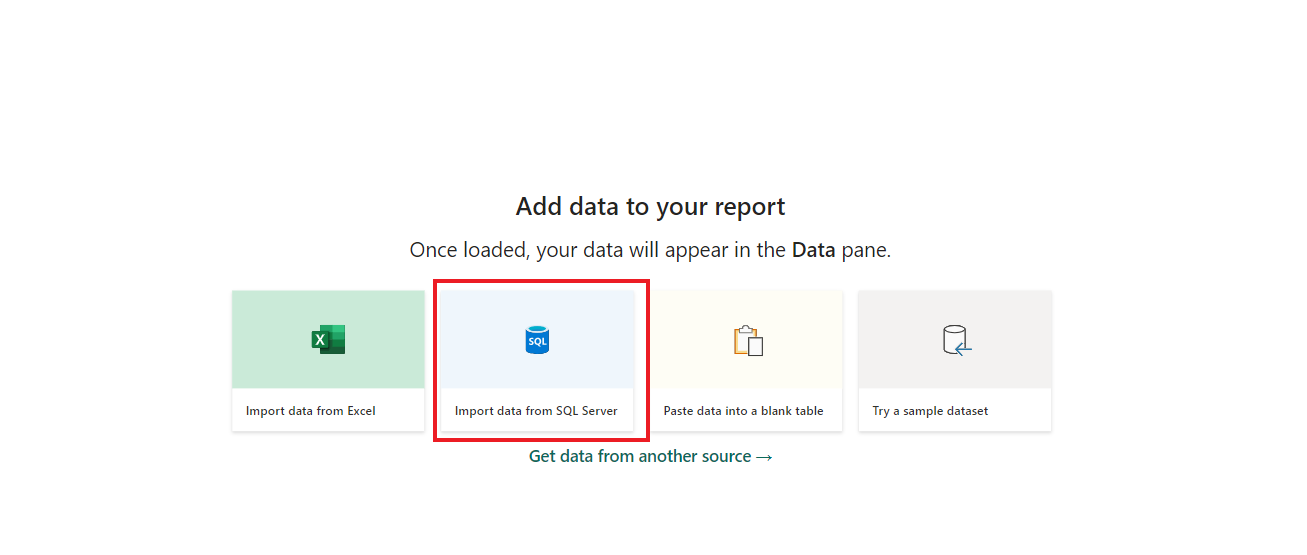
1. Connect to your SQL database in Power BI by clicking Get Data and selecting Import data from SQL Server.
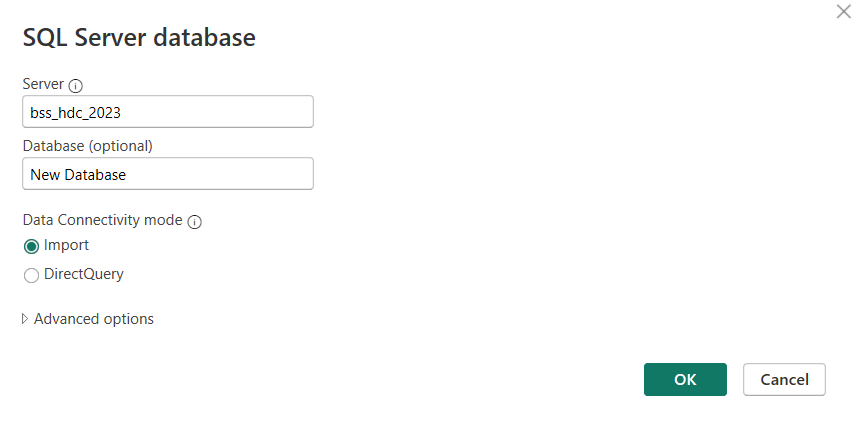
2. In the SQL Server database window, enter your server and database information, then click OK.
3. Click and open the Advanced Options menu. You will see options to provide command timeout in minutes and add an SQL statement.
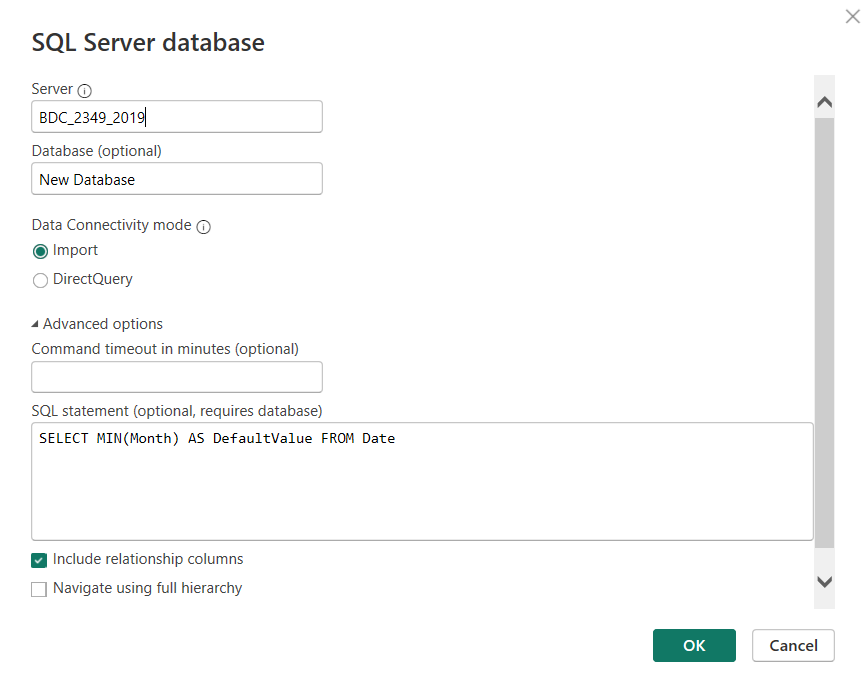
4. Write a SQL query to fetch the default values based on your criteria.
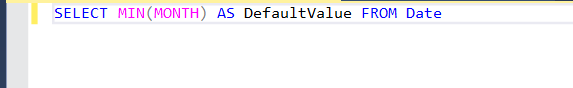
SELECT MIN(Month) AS DefaultValue FROM Date
5. This logic fetches the earliest month in the dataset as the default value.
6. Load the query result into Power BI as a table. Add a slicer to the report and select or drag and drop the required data field into your slicer.
7. In the slicer settings, under the Selection pane, set the Single selection mode (Off).
8. Drag the new query table onto the Add data fields here box, under the filters panel of your Power BI Report, and set the default slicer value.
With these steps, you’ll have successfully implemented a default slicer value using SQL in your Power BI report!
Next up, let’s go over some advanced techniques using default slicer values.
Advanced Techniques for Default Slicer Values
In your quest to optimize Power BI reports, it’s essential to set up default slicer values that guide users toward the most relevant data.
In this section, we’ll discuss a few advanced methods — using SWITCH, SELECTEDVALUE, numeric range slicer, and OFFSET to establish more dynamic and flexible default values.

1. SWITCH Function
The SWITCH function allows you to match a single expression against multiple values. To use SWITCH in your slicer, create a measure that returns the default value based on the user’s selection.
It’s particularly useful when you want to set default values for categorical slicers based on specific conditions.
For example, consider a sales report with a region slicer. You can use SWITCH to set the default value to be the region with the highest sales.
Selected Region =
VAR max_sales = MAXX('Sales', 'Sales'[Region Sales])
RETURN
    SWITCH(TRUE(),
        SELECTEDVALUE('Sales'[Region], "All") = max_sales, "Highest Sales",
        "All"
    )
2. SELECTEDVALUE Function
This function retrieves a single value from a slicer. It returns the selected value if there’s only one, or a specified alternate result if multiple values are selected. You can use SELECTEDVALUE in conjunction with other functions to create measures that adapt dynamically to user selections.
A common use case for SELECTEDVALUE is to set a default time period, such as displaying data for the current month or year. This approach can make your reports more intuitive and relevant to users.
Suppose you have a sales report with a revenue range slicer. To set an average revenue range as the default value, use the following code:
Average Sales Bins =
VAR Average_Revenue = AVERAGEX('Sales', 'Sales'[Revenue])
RETURN
    IF(
        SELECTEDVALUE ('Sales'[Revenue]) = Average_Revenue,
        "Average Revenue",
        SELECTEDVALUE ('Sales'[Revenue], "All")
    )
3. OFFSET Function
The OFFSET function lets you create a measure that sets a default value based on a relative position. It’s helpful when you want to generate rolling windows or moving averages. To implement OFFSET, you’ll need to employ time intelligence functions and create measures that compute relative periods.
For example, you can set the default date slicer to the past three months using OFFSET as follows:
Default Date Range =
VAR Past_3_Months = TODAY() - OFFSET(DateTable[Dates], -3, MONTH)
RETURN
    CALCULATE(
        SELECTEDVALUE(DateTable[Dates], Past_3_Months)
    )
By leveraging these advanced techniques, you can create efficient and user-friendly default slicer values in your Power BI reports.
Comparing Values with Slicers
Power BI slicers enable you to easily compare values, ratios, and profits in your data. By leveraging slicers, you can filter your data to analyze specific segments, providing you with a clear and concise view of the information you need.
To start comparing values using a slicer, follow these steps:
- Add a slicer to your report canvas by going to the Visualizations pane and selecting the Slicer icon.
- Drag the desired field from the Fields pane to the newly created slicer. This will allow you to filter your data by that field.
Consider this example: Compare the % units market share for different manufacturers by segment. Drag the Manufacturer and Segment fields into the slicer. You can then select specific segments for each manufacturer from the slicer to view their % Units Market Share.
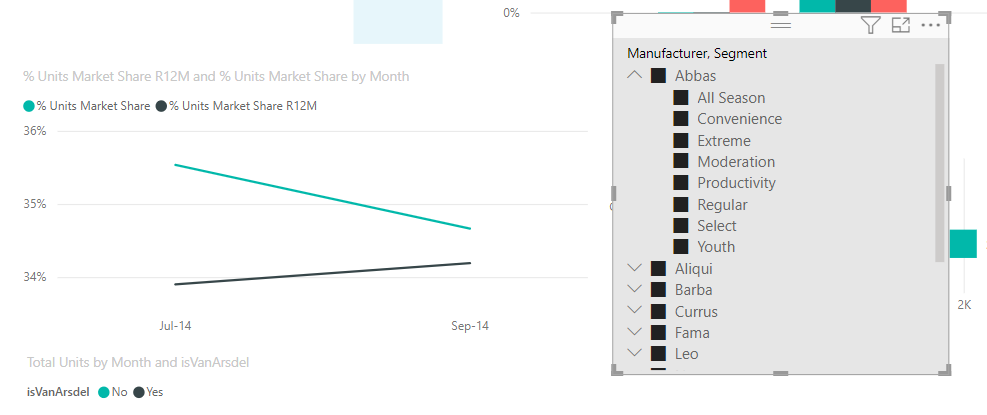
To get an even clearer comparison, add visuals such as bar or pie charts to your report canvas. These visuals allow you to see patterns and trends at a glance, making it easier to understand the data as shown above.
When using Power BI slicers to compare values, keep the following best practices in mind:
- Use the Multi-select option: This feature allows you to select multiple values within a slicer, making it easier to compare different data points.
- Apply consistent formatting: To make your slicers visually appealing and easy to read, apply a consistent format to all slicers in your reports.
- Keep the data up to date: Ensure that your data source is always updated to get accurate comparisons and insights from your slicers.
By following these guidelines, you will be able to confidently and effectively compare values, ratios, and profits with Power BI slicers in a clear and knowledgeable manner.
Final Thoughts
With Power BI, you can easily implement a default slicer value in your reports. This solution not only helps tailor your data visualization but also provides a better user experience by focusing on the most relevant information.
As you start using the default slicer value, you’ll notice that the tool’s capabilities are enhanced, making data interaction more efficient.
Tools like Power BI are invaluable for making sense of complex datasets and transforming them into actionable insights.
However, its true power lies in the thoughtful application of its capabilities, and the use of default slicer values is a prime example of this, demonstrating how small adjustments can have a profound impact on the effectiveness of your data analysis.
For more tips on setting default values for slicers in Power BI visit our forum. If you want to elevate your Power BI reports and create engaging visual experiences with your data model, check out our Ultimate beginners’ guide to DAX:
Frequently Asked Questions
How do you set the default value in Power BI slicer?
Setting default slicer values in your Power BI is easy. First, create a measure that captures your default selection criteria. Click on the Slicer icon from the Visualizations pane and set the field property to the required column. Drag your default value measure into the Add data fields here under the Filters panel of your report.
To set the default slicer value to today, first add a calculated column in your data with the formula IsToday = IF(TODAY() = YourDateColumn, 1, 0). Then, in your report, add a slicer based on this new column and set its default value to 1.
How do you set the default slicer value to the current month in Power BI?
To set the default value of your slicer to the current month in Power BI, Create a calculated column in your date table using the below formula
CurrentMonth=MONTH(TODAY())Use the calculated column (CurrentMonth) as the source for your slicer. In the slicer settings, select the calculated column as the “Default value” to show the current month by default.
How do I change the default slicer value to yesterday in Power BI?
To change the default slicer value to yesterday in Power BI, first, create a calculated column in your date table with the below formula
ColumnYesterday=TODAY() - 1Use this calculated column (ColumnYesterday) as the source for your slicer. Then select the calculated column as the “Default value” to show yesterday’s date by default, in the slicer settings.
What is the default value of a slicer?
The default value of a slicer in Power BI is the initial value displayed when the report is loaded or refreshed. It determines what data subset is shown by default without any user interaction. By setting a default value, you can control the initial view of the report, guide users to important aspects of the reports, and create interactive visuals for your audience.
How do I custom sort slicer values?
To custom sort slicer values in Power BI, select the slicer visual on the report canvas. Navigate to the “Sort” section in the “Visualizations” pane. Choose “Custom” from the dropdown and manually reorder the slicer values as desired using the up and down arrows.
Can I make a slicer default to ‘select all’?
Yes, you can make a slicer default to ‘select all’. In the slicer settings in the visualization panel, under Selection Controls, toggle on the ‘Select All’ option. When the report is opened, all the values will be selected by default.


