Calculating percentiles is a crucial aspect of data analysis, as it allows comparing individual data points to the overall distribution of a dataset. One of the key functions that Pandas provides is the ability to compute percentiles flexibly and efficiently using the quantile function.
In Pandas, the quantile() function allows users to calculate various percentiles within their DataFrame with ease. By specifying the desired percentile value, or even an array of percentile values, analysts can immediately identify key values within their dataset and draw important insights.
In this comprehensive guide, we’ll delve into the depths of understanding how to calculate percentiles in Pandas DataFrames. We’ll start with a detailed explanation of how percentiles can be calculated using Pandas. We’ll also provide practical examples and use cases to help you apply these concepts in your own data analysis tasks.


How to Calculate Percentiles and Quantiles in Pandas
The Pandas library provides a useful function quantile() for working with percentiles and quantiles in DataFrames. This helps in understanding the central tendency and dispersion of the dataset.
In this section, we’ll discuss the quantile() method, its parameters, and an alternative solution using NumPy.
1. Quantile Method
The quantile() function in Pandas is used to calculate quantiles for a given Pandas Series or DataFrame. Let’s look at its syntax.
DataFrame.quantile(q, axis, numeric_only, interpolation)Where:
- q: The percentile to calculate between [0-1]
- axis(Optional): The requested axis to calculate the percentile for. 0(default) for columns and 1 for rows.
- numeric_only(Optional): Calculates the percentile values on numeric-only columns or rows when set to True. [True|False]
- interpolation(Optional): The type of interpolation to employ when the percentile is between two values. [linear, mid, higher, lower, nearest]
You can use this function to calculate either a single percentile value or an array of multiple percentile values. For example, let’s calculate the 75th percentile of the DataFrame below:
import pandas as pd

data = {'Col1': [1,2,3,4,5,6,7,8,9,10]}, {'Col2':[11,12,13,14,15,16,17,18,19,20]}
df= pd.DataFrame(data)

print(df)
seventy_fifth_percentile = data.quantile(0.75)

print(seventy_fifth_percentile)
Output:

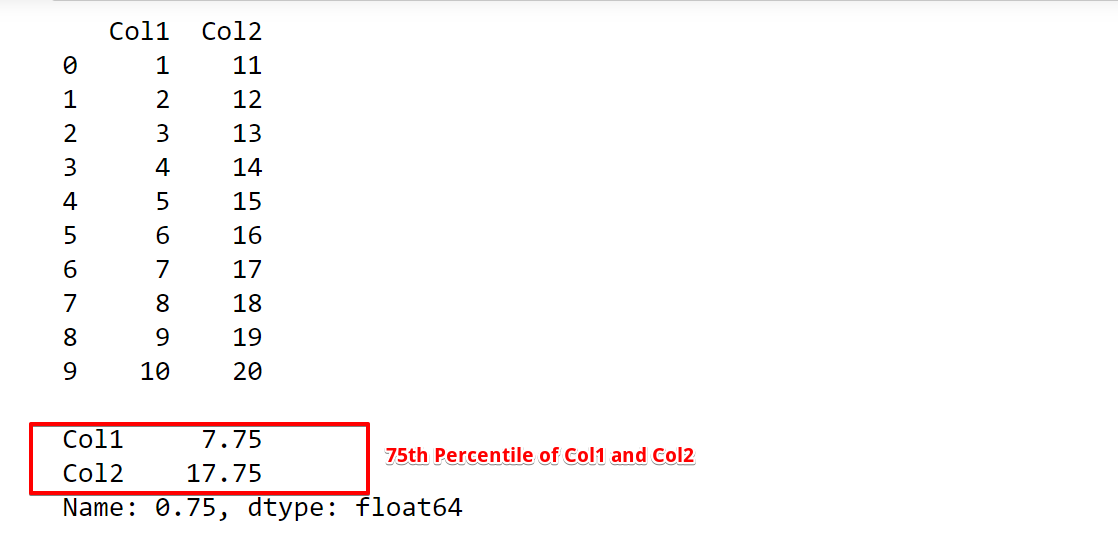
This code will return the 75th percentile of both columns in the df DataFrame. You can change the 0.75 to any value between 0 and 1 to calculate other percentiles as well.
You can also specify multiple percentiles at once by passing a list of quantiles within the range of 0 to 1. For example:
import pandas as pd

# Creating a sample DataFrame
data = {'A': [10, 20, 30, 40, 50], 'B': [15, 25, 35, 45, 55]}
df = pd.DataFrame(data)

# Calculate multiple percentiles
percentiles = [0.25, 0.5, 0.75]
result = df.quantile(percentiles)

print(result)
This code will produce the following output, which shows the 25th, 50th, and 75th percentiles for each column of the DataFrame:
         A     B
0.25  20.0  25.0
0.50  30.0  35.0
0.75  40.0  45.0
It is important to remember that the quantile() function returns a DataFrame when calculating multiple percentiles. Let’s look at some of the other arguments that the quantile() function takes:
2. Interpolation Method
When a quantile falls between two data points, Pandas allows you to choose from different interpolation methods: ‘linear’, ‘lower’, ‘higher’, ‘midpoint’, and ‘nearest’. By default, Pandas uses linear interpolation.
Here’s a brief explanation of each method:
- linear: This method performs linear interpolation between the two closest data points.
- lower: Returns the lower of the two closest data points.
- higher: Returns the higher of the two closest data points.
- midpoint: Returns the midpoint of the two closest data points.
- nearest: Returns the closest data point.
For example, if you want to recalculate the 75th percentile using the ‘higher‘ interpolation method, you can modify the previous code snippet like this:
seventy_fifth_percentile = df.quantile(0.75, interpolation='higher')Output:
Col1     8
Col2    18
Name: 0.75, dtype: int64
Numeric Columns Only
When set to True, the numeric_only argument sets the function to calculate the percentiles for only numeric axes. It automatically excludes axes with non-numerical values like strings, dates, etc.
Here’s an example:
import pandas as pd

data = {'col1': [1, 2, 3, 4], 'col2': [5, 6, 7, 8], 'col3': ['a', 'b', 'c', 'd']}
df = pd.DataFrame(data)

df.quantile(0.6, numeric_only=True)
This would return the following output, excluding the non-numeric ‘col3‘:
col1    2.8
col2    6.8
Name: 0.6, dtype: float64
Axis
The axis parameter specifies whether the given quantile will be calculated column-wise or row-wise. Its default value is 0 which calculates it column-wise.
Let’s calculate the previous example row-wise:
df.quantile(0.6, numeric_only=True, axis=1)Output:
0    3.4
1    4.4
2    5.4
3    6.4
Name: 0.6, dtype: float64
This returns the 60th percentile values for each row in the DataFrame.

3. Using NumPy
You can also use the NumPy library to calculate percentiles and quantiles. NumPy provides a percentile function, which can be used like this:
import numpy as np

data_values = np.array([1,2,3,4,5,6,7,8,9,10])
seventy_fifth_percentile = np.percentile(data_values, 75)
Output:
7.75This code snippet calculates the 75th percentile of the given dataset using NumPy’s percentile() function.
In conclusion, Pandas and NumPy both provide efficient ways to calculate percentiles and quantiles. Choosing between the two depends on your specific needs and preferences, as well as which library is more commonly used in your project.
How to Generate Summary Statistics and Descriptive Information Using Pandas
In this section, we’ll discuss how to calculate summary statistics and descriptive information using Pandas in Python. We’ll explore the describe and groupby methods.
1. Describe Method
The describe() method is a powerful function in Pandas, used to generate summary statistics on a dataset. This includes measures such as count, mean, standard deviation, min, max, and specific percentiles of data. You can use it with both numeric and object data types, and the output will vary depending on the input provided.
Here’s an example of describe method applied on a DataFrame:
import pandas as pd

data = {'col1': [1, 2, 3, 4], 'col2': [5, 6, 7, 8]}
df = pd.DataFrame(data)

df.describe()
This would produce the following output:
       col1      col2
count   4.0       4.0
mean    2.5       6.5
std     1.290994  1.290994
min     1.0       5.0
25%     1.75      5.75
50%     2.5       6.5
75%     3.25      7.25
max     4.0       8.0
2. Groupby Method
You can also calculate summary statistics for specific groups using the groupby function. This can be helpful when you want to analyze data based on categories or specific conditions.
Here’s an example:
import pandas as pd

data = {'Category': ['A', 'A', 'B', 'B'], 'Value': [1, 2, 3, 4]}
df = pd.DataFrame(data)

grouped_df = df.groupby('Category').describe()
This would yield the following output:
         Value
Category
A        count    2.0
         mean     1.5
         std      0.707107
         min      1.0
         25%      1.25
         50%      1.5
         75%      1.75
         max      2.0
B        count    2.0
         mean     3.5
         std      0.707107
         min      3.0
         25%      3.25
         50%      3.5
         75%      3.75
         max      4.0
The groupby() function groups each unique element in the ‘Category‘ column together, then we apply the describe() function to it.
How to Calculate Percentile Rank Using Pandas
The Percentile Rank is a value that tells us the percentage of values in a dataset that are equal to or below a certain value. We can calculate it using the rank() function in Pandas.
The syntax is as follows:
Dataframe[<rank_column_name>]=Dataframe['<column_name>].rank(pct=true)Where:
- rank_column_name: name of the new column that will display the percentile rank.
- column_name: Name of the DataFrame column to be ranked.
- pct: If set to True, it will display the rank in percentage(%) format.
The function also takes in parameters like the numeric_only argument. Let’s go through a few examples that demonstrate how to calculate percentiles using the Pandas library.
Example 1
In this example, we’ll calculate the percentile rank of a given column in a Pandas DataFrame. Let’s consider a sample dataset containing student scores.
To calculate the percentile rank of the ‘Score’ column, you can use the following code snippet:
import pandas as pd

data = {"Student": ["A", "B", "C", "D", "E"],
        "Score": [75, 85, 90, 60, 95]}

df = pd.DataFrame(data)

df["percent_rank"] = df["Score"].rank(pct=True)
Output:
  Student  Score  percent_rank
0       A     75           0.4
1       B     85           0.6
2       C     90           0.8
3       D     60           0.2
4       E     95           1.0
The resulting DataFrame includes an additional column, “percent_rank” that displays the percentile ranks of the scores.

Example 2
In this example, we’ll group data by categories and then calculate percentile ranks within those groups.
We have a dataset with scores and their respective categories. Here’s how to calculate percentile ranks within each group using the groupby() function in Pandas:
import pandas as pd

data = {"Category": ["Hot", "Cold", "Hot", "Cold", "Hot", "Cold"],
        "Score": [80, 90, 70, 95, 85, 89]}

df = pd.DataFrame(data)

df["percent_rank"] = df.groupby("Category")["Score"].transform("rank", pct=True)
Output:
  Category  Score  percent_rank
0      Hot     80      0.666667
1     Cold     90      0.666667
2      Hot     70      0.333333
3     Cold     95      1.000000
4      Hot     85      1.000000
5     Cold     89      0.333333
The DataFrame will now reflect the percentile rank due to this transformation.
Note: If you want to remove this new column, you can easily use any one of the drop commands.
How to Visualize Percentiles With the Seaborn Library
If you’d like a more visual approach to working with percentiles and distributions, consider using the Seaborn library in conjunction with Pandas. Seaborn is a Python data visualization library built on top of Matplotlib, offering various statistical graphing options.
A popular function in Seaborn for displaying percentiles is the boxplot(). Here’s an example of using Seaborn to create a box plot showcasing the distribution of scores in each category:
import pandas as pd
import seaborn as sns
import matplotlib.pyplot as plt

data = {"Category": ["Hot", "Cold", "Hot", "Cold", "Hot", "Cold"],
        "Score": [80, 90, 70, 95, 85, 89]}

df = pd.DataFrame(data)

sns.boxplot(x="Category", y="Score", data=df)
plt.show()
Output:
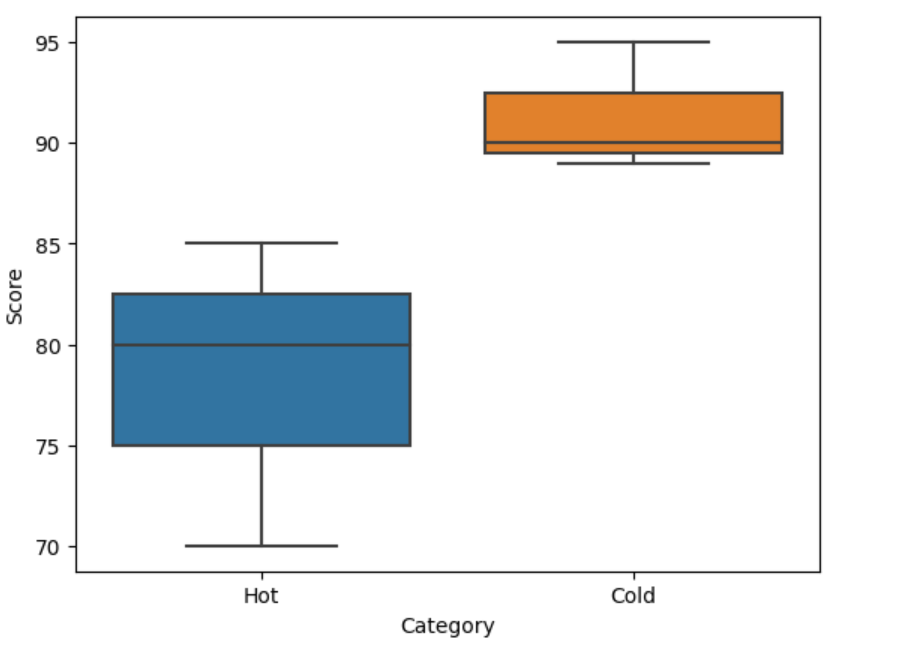
This code produces a box plot where the box represents the interquartile range (IQR), which contains the 25th to 75th percentile, and whiskers denoting the minimum and maximum values within 1.5 times the IQR. Outliers are also indicated if they exist.
You can learn more about this in this video on how to create enhanced box plots in Power BI using Python.
Final Thoughts
In conclusion, having a thorough mastery of the Pandas percentile calculation using the quantile function is essential for anyone involved in data analysis.
By utilizing the quantile() function provided by Pandas, you can easily identify the distribution and patterns within your data, gaining a deeper understanding of its characteristics. With its ability to perform complex calculations in just a few lines of code, this powerful tool can enhance data-driven decision-making and streamline the entire data analysis process.
Whether you’re working with financial data, survey results, or any other domain, the ability to compute percentiles will empower you to make informed decisions and uncover valuable information!
If you enjoyed reading this, you can also check out this article on How to Export a Pandas DataFrame to Excel in Python.
Frequently Asked Questions
What is Pandas percentile?
In Pandas, a percentile is a measure used in statistics indicating the value below which a given percentage of observations in a group of observations falls. For example, the 20th percentile is the value (or score) below which 20% of the observations may be found. The Pandas function quantile() is used to find this value. The argument to quantile() is a number between 0 and 1, where 0.25 represents the 25th percentile, 0.5 represents the median (or 50th percentile), and so on.
Does the quantile() function work on non-numeric data types?
No, the quantile() function in Pandas does not work on non-numeric data types. Percentiles and quantiles are statistical measures that are defined in terms of ordered numerical data, so they don’t make sense for non-numeric data types like strings or dates. However, you can use it on boolean data, as booleans are treated as 0s and 1s (False and True respectively).
Can the quantile() function be applied to Panda Series?
Yes, the quantile() function can be applied to a Pandas Series. A Series in Pandas is a one-dimensional labeled array capable of holding any data type. If your Series contains numeric data, you can use the quantile() function to compute the value at a specific percentile. For example, if s is a Pandas Series, you can find the 25th percentile with s.quantile(0.25). This will return the value below which 25% of the data in the Series falls.
How to find the 25 percentile in Pandas?
To find the 25th percentile (also known as the first quartile) in a Pandas DataFrame or Series, you can use the quantile() function with 0.25 as the argument. For instance, if you have a DataFrame df and you want to find the 25th percentile of the column ‘column_name‘, you would use df[‘column_name’].quantile(0.25). This will return the value at the 25th percentile for the specified column.