Completing budgeting analysis in Power BI is unfortunately just not that easy. What I’m going to go through today is possibly the most advanced technique that you can get to with budget analytics as we need to incorporate some seasonality into our budgeting numbers. You may watch the full video of this tutorial at the bottom of this blog.
I detail this quite extensively in the video tutorial, so there’s lots to learn there, but really, the concept that we’re trying to solve is that budgets are never uniformly allocated in a straight line fashion throughout a year.
Say you had some yearly budgets and you needed to build a budget allocation (which I have covered in previous tutorials). Well, you can’t really allocate that budget, in a lot of cases, just evenly for every single day because some months will have higher sales over summer or holiday periods (for example), or during promotions you may run.
There’s certainly going to be some sort of seasonality impact on most datasets.
During this blog post, I walk through an example of how you can manage this seasonality in results. Now, if you already know how to create a budget allocation, then we’re just layering on an additional piece of logic here. We need to input a seasonality measure or some seasonality logic that enables us to not only allocate by day but also by month. We need to allocate at the monthly level and then within the month, we need to allocate across every single day.
Seasonality In Business
Sometimes budgets are at a different granularity where you have actuals at a daily level and budgets at a monthly or yearly level. The scenario that we are going to walk through will show how we can not only allocate yearly budgets across every single day, but also as seasonal weightings per month.
I’m going to show how a yearly budget can be allocated so you can measure it against a daily actual or even a monthly actual, but also how to distribute it across different weightings for individual months. There’s a little bit of logic involved here.

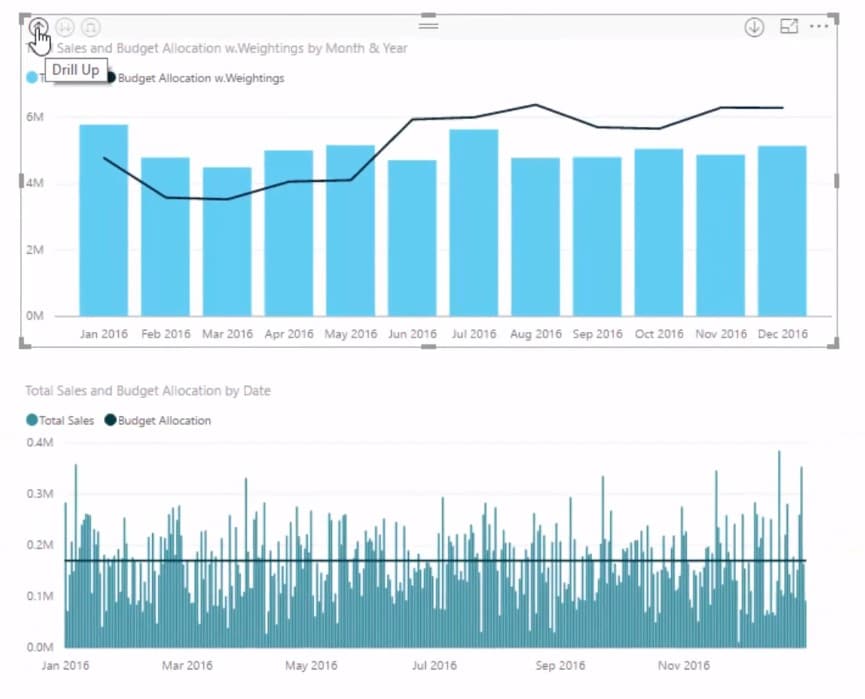
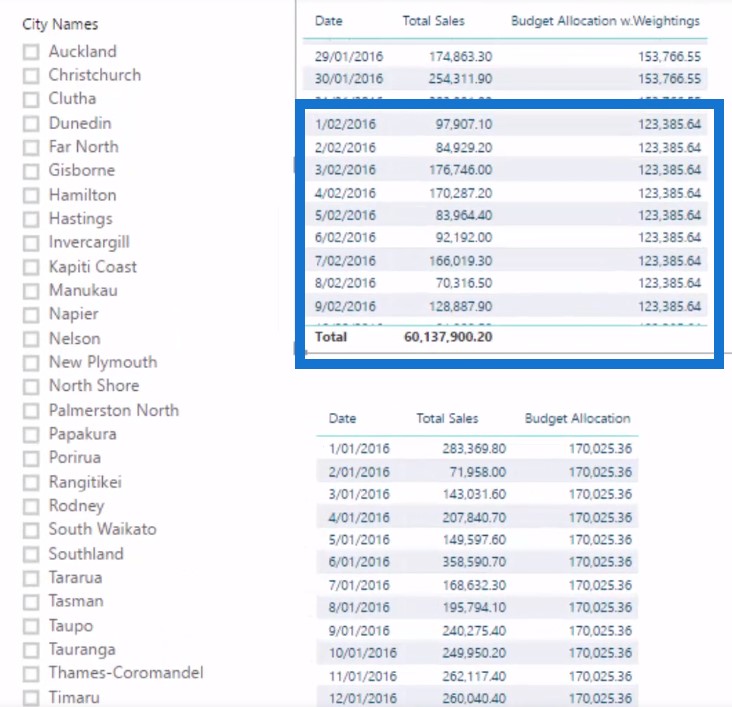
By the end of our tutorial on budget analytics, we should be able to come up with these two charts. The difference is that the bottom chart shows the budget allocation with no seasonality while the top chart has the seasonality added to it.
Budget Allocation
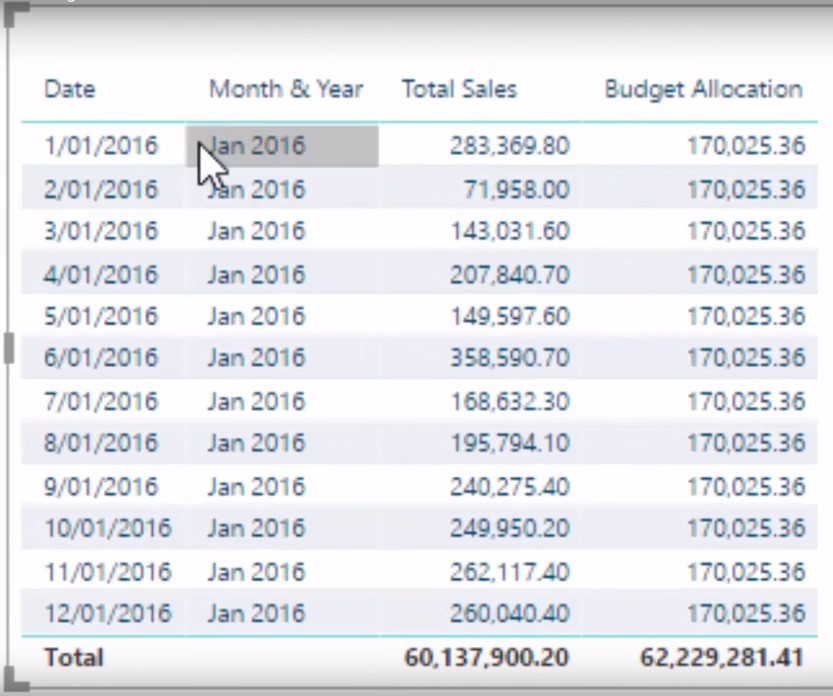
Let’s have a look at our budget allocation for the month of January. We have the Total Sales versus the Budget Allocation.
The Budget Allocation is just a simple formula: we used the Days in Date Context divided by the Days in Year multiplied by the Total Budget amount.
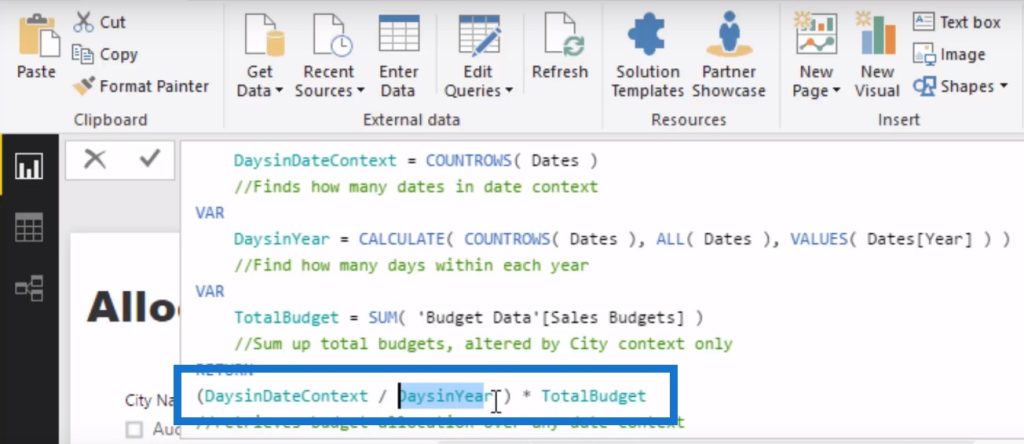
On a daily context, this is going by 1 divided by 365 then multiply the result by the total budget. We’re using Days in Year because the budgets are on a yearly granularity.
Budget Allocation With Weightings
But what if we need to add in here the seasonality weighting? We need to add some additional logic, which may get a little bit more complex. We have the Date, Total Sales, and Budget Allocation with Weightings. This is basically the same as the chart below, right?
But it’s also different because the Budget Allocation with Weightings has 153,766.55 while the other one has 170,025.36.

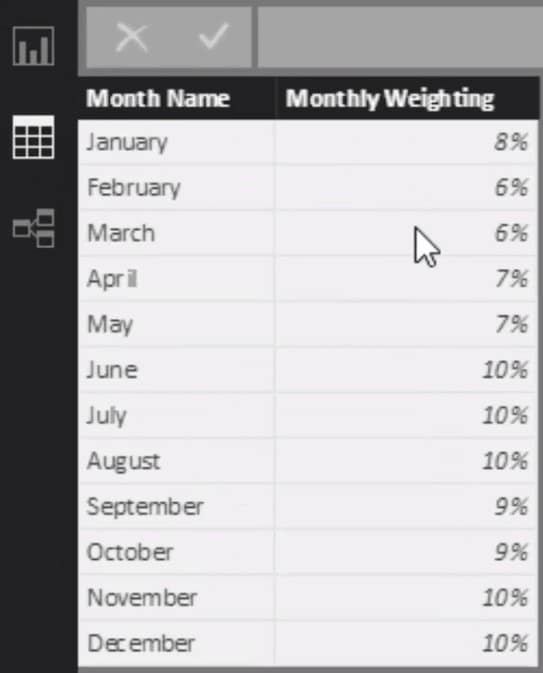
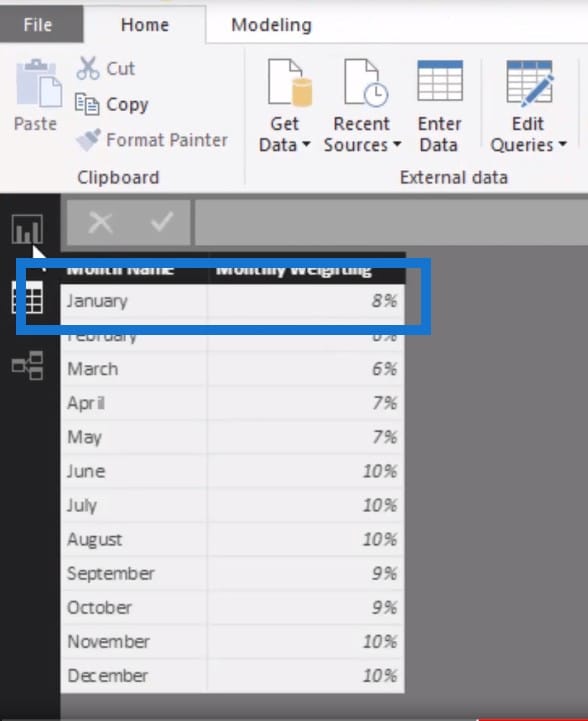
This is because of the 8% weighting for January.
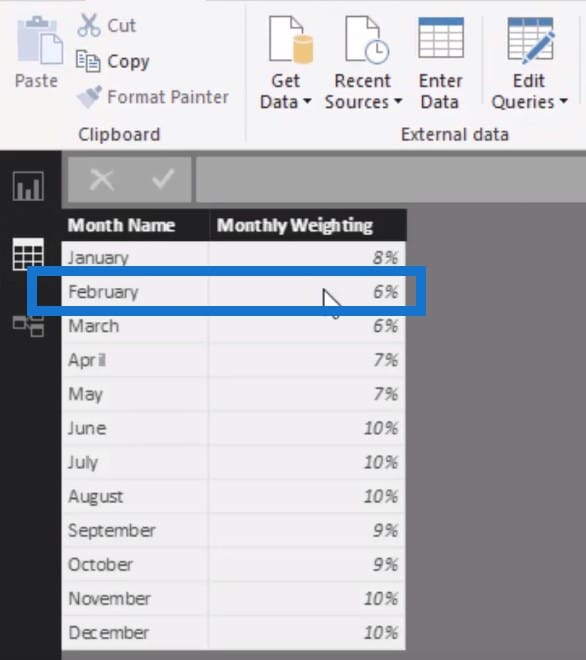
If we go to February it is still a lower amount at 123,385.64 because the weighting is also lower at 6% but the budget allocation remains the same all the way through.
What do we need to do to actually calculate this? We will use a pattern that you can download from the Enterprise DNA resources. We had to bring in an additional variable for the seasonality measure.
Total Budget
We’re still summing up the Total Budget at a yearly amount but we are multiplying it by the Seasonality Measure.
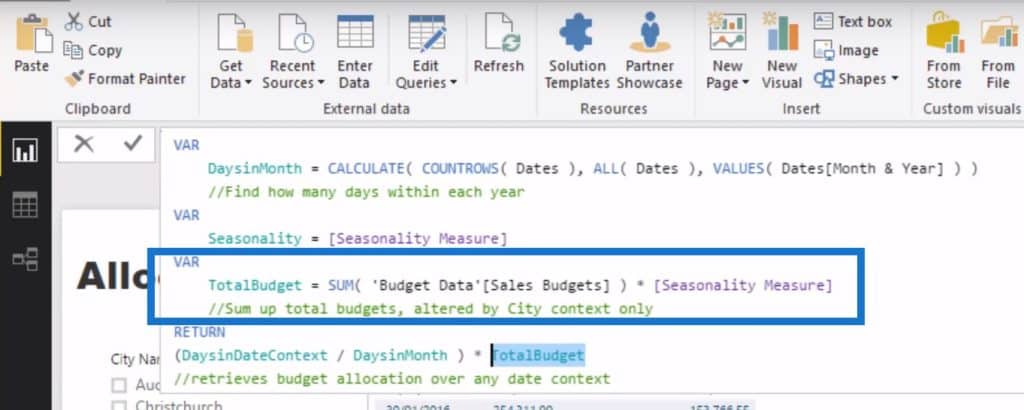
So in the current context, this Total Budget isn’t going to be the yearly amount anymore; it’s actually going to be the monthly amount which is what we want.

We’re going with 1 divided by the Days in Month, then we’ll multiply it by the monthly budget number instead of the entire budget number.
Seasonality Measure in Budget Analytics
We also need to bring in the seasonality measure and align it to every single month. We have to do a couple of things to actually achieve this but this is the formula that we’ll use:

We’re returning the seasonality measure inside of the month that it should be. We’re determining the actual month inside of the date and then return whatever the seasonality weighting was. That’s basically the logic behind it.
The seasonality measure is what feeds into the Total Budget. The 7.7% is what we multiply the yearly number by because our budgets are at a yearly level. This gives us a monthly number which we integrate into our logic where we go 1 divided by 30 multiplied by the monthly number.

This is how we get the budget allocations with their seasonality weighting incorporated.
Visualizing The Data
There’s also a number of different visualizations you can do to highlight these two charts. We can change the colors around and put a darker color in the background so that we can see the allocations per month on a daily basis.
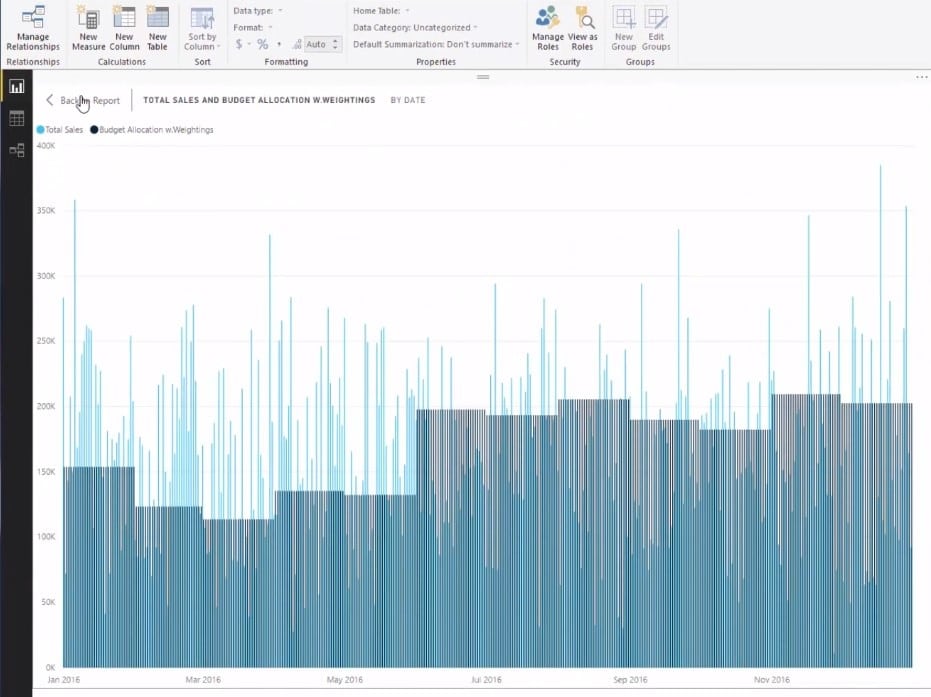
This is a brilliant way to bring something quite complex down to a relatively easier format to digest. And it’s also dynamic so you can integrate this with the rest of your models. It all comes down to this allocation algorithm where we have to make some small adjustments to get a better picture of how our sales are tracking not against the generic month and daily number, but against a specific weighting.
***** Related Links *****
How To Create Budgets Which Have Seasonality Adjustments – Power BI Technique
Create A New Table In Power BI: How To Implement Budgets & Forecasts Automatically Using DAX
How To Calculate Actual Results To Budgets Per Product – Power BI & DAX
Conclusion
So, lots to learn and plenty of advanced techniques around Power BI that you could use in a number of different ways in budget analytics. Take the time to watch the video and try to replicate some of these techniques in your own development.
I cover many variations of budget analytics techniques in my Solving Analytical Scenario course at Enterprise DNA Online.
Also, recently as part of the Enterprise DNA Webinar Series I ran a deep dive into some advanced budgeting techniques that was well received by over 400 people or so. If you want to learn all about implementing budgeting then this workshop is well worth reviewing.
[youtube https://www.youtube.com/watch?v=EGWHFlZbfWU?rel=0&w=784&h=441]


