
When analyzing actual results in your data, you may sometimes want to compare it to a forecast or run rate. In this tutorial, I’ll show you how to calculate a cumulative run rate based on some historical results. You may watch the full video of this tutorial at the bottom of this blog.
This came out as a request in the Enterprise DNA Support Forum where a member needed a forecast that enables a comparison of current results and an average run rate over a certain period.
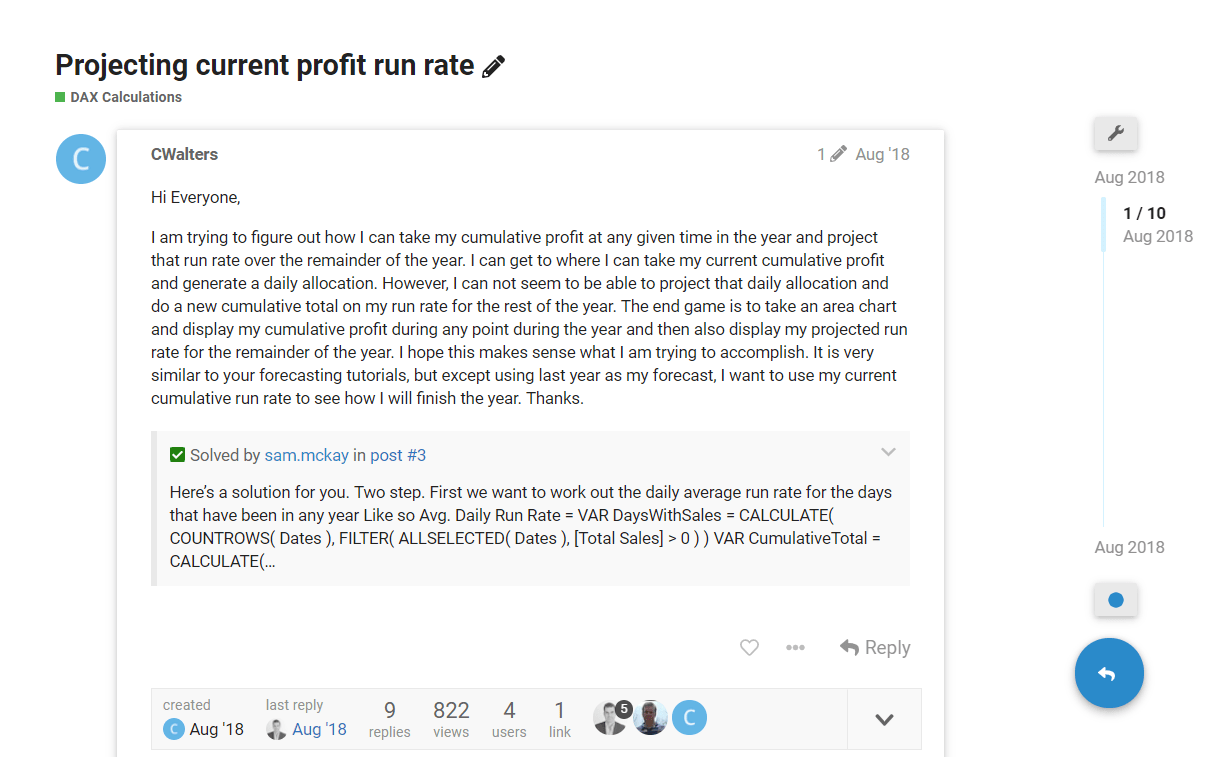
In this tutorial, I go through how to calculate the average run rate first, then project this continuously forward to be able to run the daily comparison versus the actual results as they happen.

Here, I visually make the underlying trend more prevalent than I would ordinarily have done if just reviewing daily results with no forecast to compare it to.
The best way to ultimately compare trends is with cumulative totals.
The cumulative total DAX formula pattern that I cover in this tutorial is a little different to the one you may have used in the past. This is because there’s a different requirement here around how to ultimately calculate the Cumulative Total for the average daily run rate.
So let’s get to it.
Working Out The Cumulative Total
The tricky thing in this case is that we have our Cumulative Sales, but we need to create a brand new Cumulative Total based on amounts that are determined by how we’re actually going. There are a few steps we need to go through and combine DAX formulas to achieve this.
The first thing we need to calculate is the Cumulative Total, and this is how I’ve set up the formula.
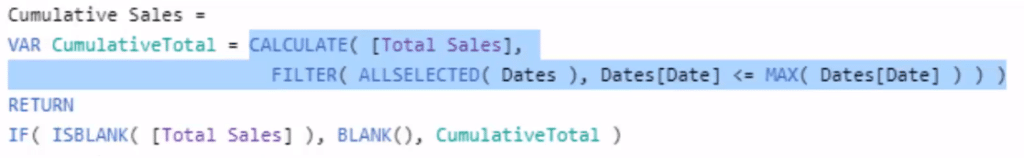
I’ve placed the Cumulative Total in a variable (VAR). It’s the same pattern, but I placed it inside a variable because I wanted to simplify the actual end formula.

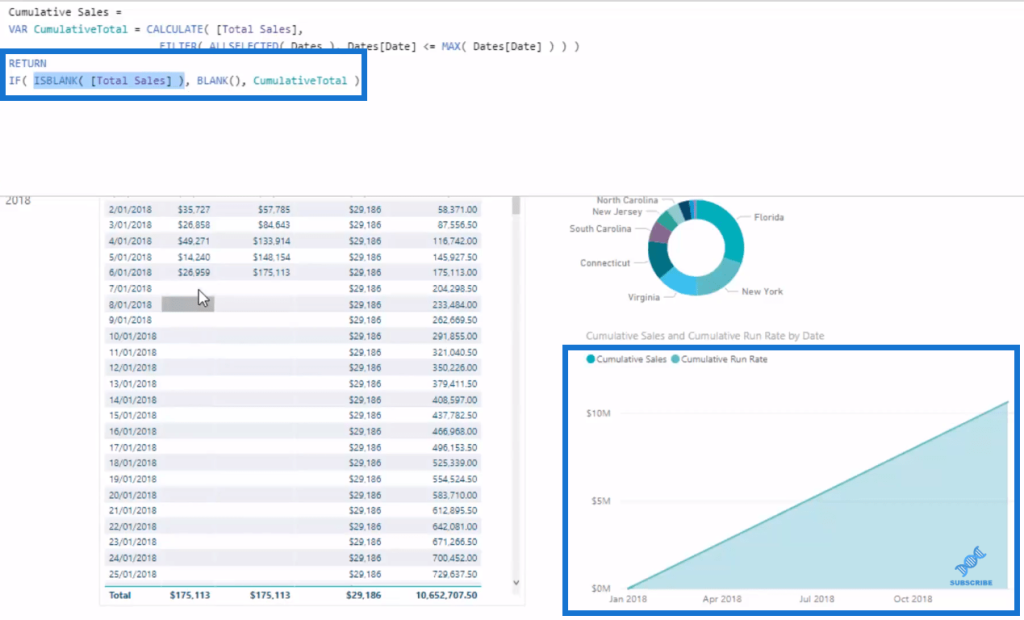
If we don’t put this logic, the Cumulative Total continues to project forward, and will likely draw a line all the way down the bottom (in the visualization) based on what the final number is. To get rid of that, what I did was use ISBLANK Total Sales. If there’s no sale that day, it’ll be blank. If not, it’ll be the Cumulative Total.
So that’s how I’ve set it up. Now, how do we calculate or project a run rate?
Working Out The Run Rate
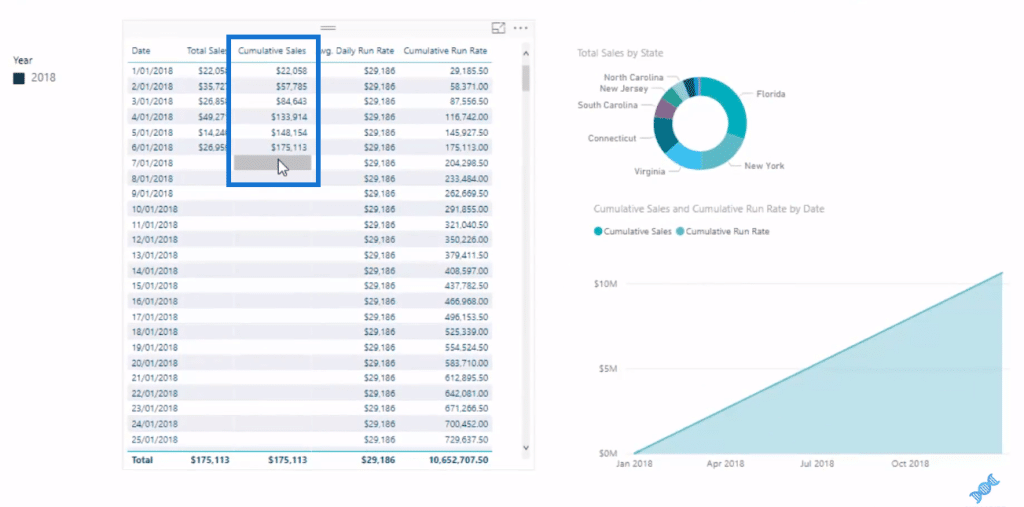
Logically, to calculate a run rate, we would count up the total sales that we’ve made in a year to get the grand total, and then divide it by how many days we’ve actually sold. That’s going to give us our Average Daily Sales Amount, which I’ve called the Average Daily Run Rate.
In our table, we have $29,186 here, which is determined by $175,113 divided by 6, because in this sample data, we’ve sold for six days in 2018.
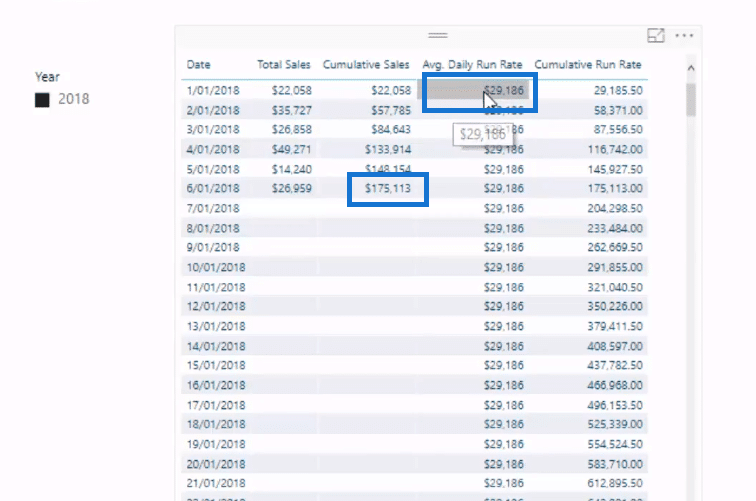
But the way I set this up is that this would automatically update every time we have more days of sales. In other words, this will automatically update our Average Daily Run Rate, and then the prediction would change. Here’s the formula I made for this.
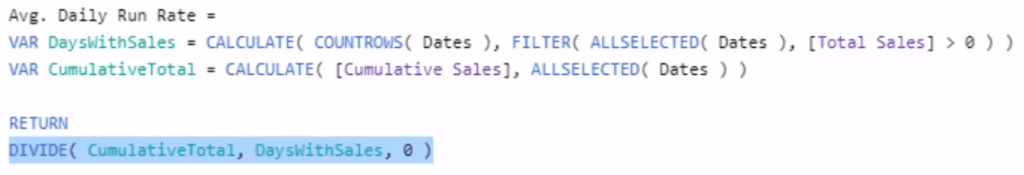
We have to do a little bit of adjustment in the variables to get this to work because the context here is at a daily level. But what we’re trying to do is to grab the number, $175,113 (CumulativeTotal), and then divide it by how many days we’ve had sales.
To get the DaysWithSales, I’ve used CALCULATE with COUNTROWS and FILTER with ALLSELECTED. If there’s a sale on day, which is greater than zero, it will retain that date. For the CumulativeTotal variable, I’ve used CALCULATE to the Cumulative Sales ($175,113), and then ALLSELECTED Dates releases the date context in every row.
So now that we have the Average Daily Run Rate, we can then project forward the Cumulative Run Rate. Let’s look at the formula.
Calculating Cumulative Run Rate
There’s a slight adjustment here to what is inside our CALCULATE. In this case, it’s not as simple as just adding Average Daily Run Rate. We need to put inside a SUMX, so that we iterate through every single day. And what I’ve done is that I’ve set up a virtual table (using SUMMARIZE) with all the Dates.
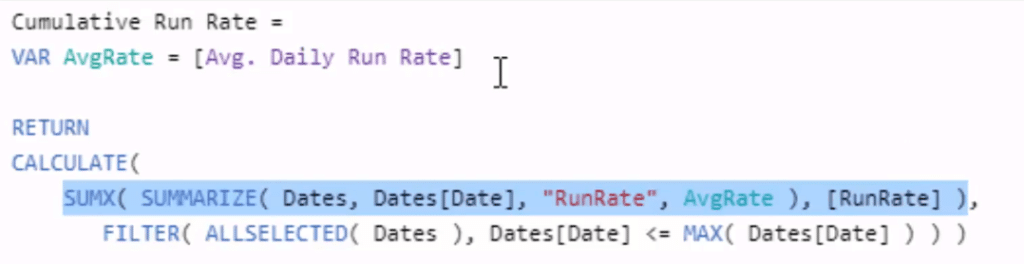
So, what SUMMARIZE is doing here is that it only evaluates to only one row. So for instance, we’re at January 1st, then it evaluates that row. Then, when we get to the second row, it again only evaluates the second row. And then the FILTER ALLSELECTED (the cumulative total pattern) is opening up the two days. So it totals $29,186 and calculates the day before as well.
As we move down the table, it continues to calculate the cumulative total and runs an iteration inside CALCULATE.
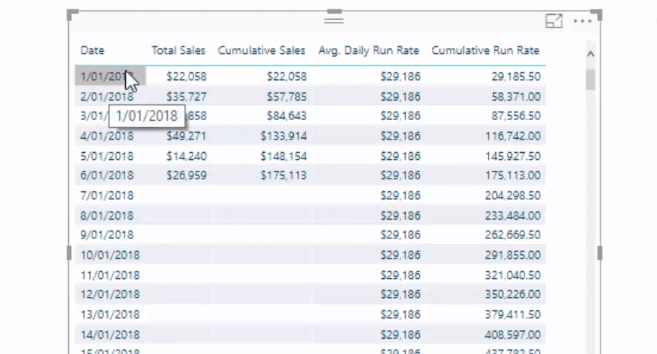
Now we have this cumulative run rate, which is purely determined by the actual cumulative total sales that we have at this point in time. If we leave it like this, then as our sales adjust, our run rate is going to change as well because this is dynamic.
But if you want to set these numbers, then you probably would want to somehow put this into a calculated table or export this data into an Excel spreadsheet. In that way, it’s going to make it non-dynamic.
***** Related Links*****
Create Dynamic Cumulative Totals Using DAX In Power BI
Running Totals In Power BI: How To Calculate Using DAX Formula
Compare Cumulative Information Over Different Months In Power BI
Conclusion
These are such unique tips and concepts, which I think you’ll find really valuable.

If you can understand the many concepts covered throughout this tutorial, you’re in a very good place, as there are so many different ways that you can apply logic like this.
You might want to review the links below, which will be helpful if you want to add more color to this example.
Enjoy working through this tutorial!
Sam
***** Learning Power BI? *****
FREE COURSE – Ultimate Beginners Guide To Power BI
FREE COURSE – Ultimate Beginners Guide To DAX
FREE – 60 Page DAX Reference Guide Download
FREE – Power BI Resources
Enterprise DNA Membership
Enterprise DNA Online
Enterprise DNA Events


