In this tutorial, you’ll learn how to create and format string calculation groups for Profit and Loss (P&L) statements in Power BI. Formatting P&L statements can be a challenging task in Power BI. Thus, this tutorial will delve into the importance of formatting string calculation groups in P&L statements and provide some tips on how to do so effectively.
A profit and loss (P&L) statement is a financial report that shows a company’s revenues and expenses over a specific period of time.
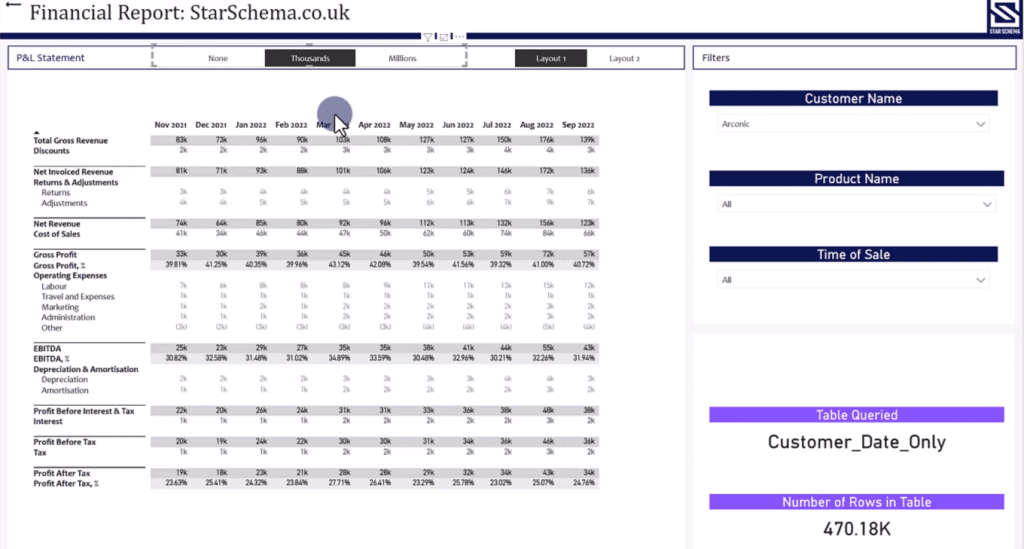
The example used in this tutorial is a dynamic P&L statement that allows you to switch between values shown in millions or in thousands. There are also different formats depending on whether the value is a number or a percentage.

One way to control formatting in Power BI is by using a DAX calculation called FORMAT. However, this isn’t recommended because it converts everything to text.
Instead, a more sophisticated method is to use Format String Calculation Groups. This is not only beneficial in Power BI, but also when it comes to Excel integration.
Format String Calculation Groups allows you to pass through DAX code and change the formatting from a number to a percentage and vice versa.
Format String Calculation Groups In Power BI Tabular Editor
In the Tabular Editor, you can see that the format string expression calculation group is taking a selected value from the layout table and retrieving a format string.
This is what’s enables Power BI to apply the thousands or millions number format.

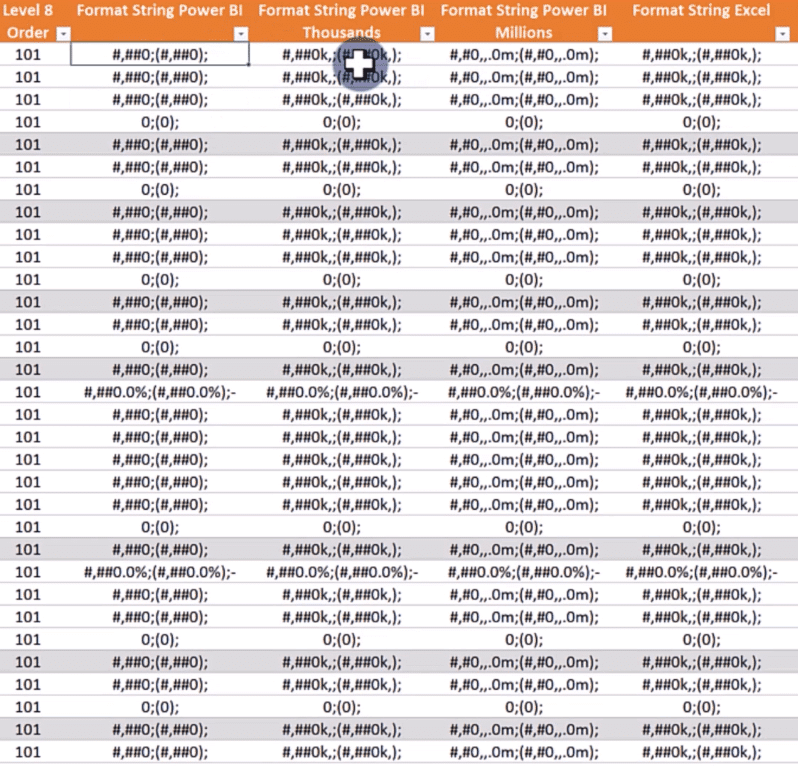
Going back to the financial statements input in Excel, notice that each individual row contains a format string.

Power BI picks up the format string for each individual line and returns the appropriate formatting using the SELECTEDVALUE function. Whereas, this worksheet allows you to control the calculations in Power BI without having to use any DAX code.
Create New Calculation Groups In Power BI
To set this up in the Tabular Editor, open Power BI and go to External Tools > Tabular Editor.

Then, right-click on your Table folder and create a new Calculation Group.
In Power BI, a calculation group is a set of calculated items that you can use in a report. Calculation groups are useful because they allow you to define a set of calculations only once. Then, you can use them throughout your report, rather than having to recreate the same calculations multiple times.

Once you create a new calculation group, you can add in new calculation items.

In the Expression Editor, select Format String Expression in the Property drop-down box.
A format string is a string that specifies how a value should be formatted in Power BI. Format strings are written using the same syntax as Excel format strings, and they can be used to control the appearance of numbers, dates, and other types of data.

There are instances where you need to use more complicated format string expressions. But in most cases, you only need to use the SELECTEDVALUE function as shown in this example.
***** Related Links *****
Matrix In Power BI Using Calculation Groups
DAX Calculation Groups – Power BI Report for Problem Of The Week #7
Conditional Formatting In Calculation Groups – Power BI
Conclusion
When working on P&L statements in Power BI, you want your solution to be as input-driven as possible. You don’t want your solution to be reliant on revising the DAX code in Power BI every time you make changes. And this can be made possible through format string calculation groups.
Format string calculation groups is a powerful method when it comes to formatting values in Power BI P&L statements. Proper formatting can make your P&L statements clearer and more organized. Whether you’re using calculation groups to perform complex calculations or simply to format values in your P&L report, they can be a valuable asset for any business looking to get the most out of their financial data.
All the best,
Chris Barber


