
In this blog, I’m going to show you how you can apply conditional formatting to calculation items or groups in Power BI. Although conditional formatting is limited in calculation groups, you can still leverage some of its benefits effectively. You can watch the full video of this tutorial at the bottom of this blog.
So let’s get started.

Applying Conditional Formatting To Calculated Items
First, I’ll create a visualization with a calculated item and a measure. I have already created the Time Intelligence calculation item, so I’ll drag that into the columns section. Then I’ll bring my Sales measure into the values section.
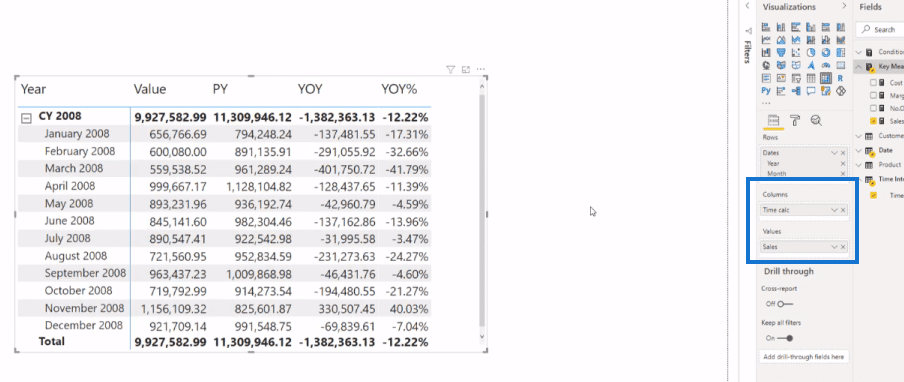
In this visualization example, I want to highlight the negative values using a lighter color and the positive values with yellow or green color. To do this, I need to go to the roller paint section, where I’ll find conditional formatting. Here, you can see that it’s referencing the Sales measure.
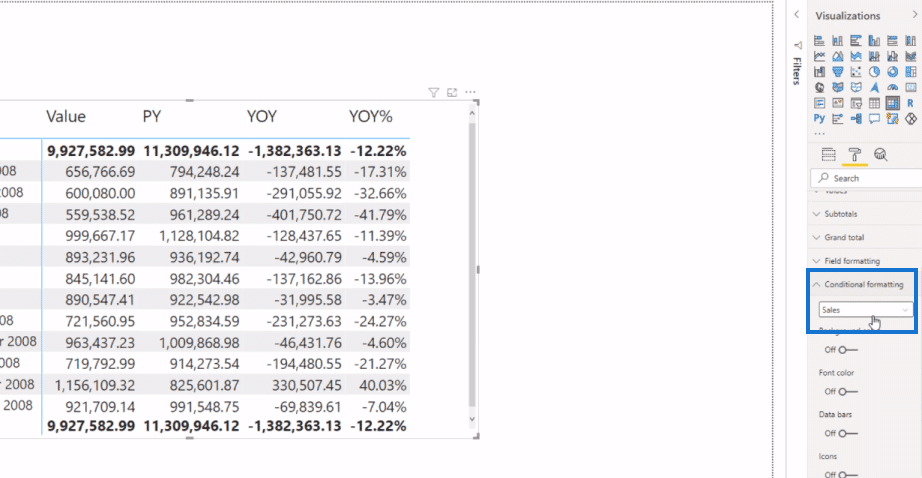
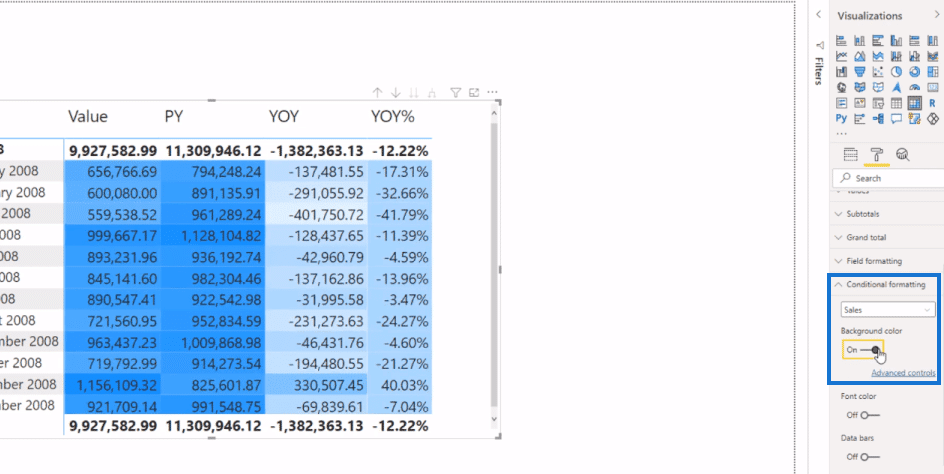
So, if I turn the background off, you’ll see that it is applied to all the calculation items.
Applying Conditional Formatting To A Specific Column
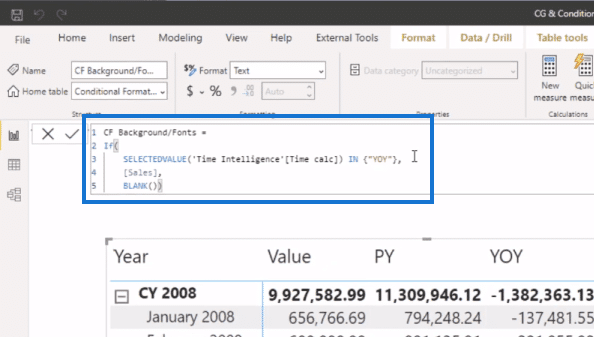
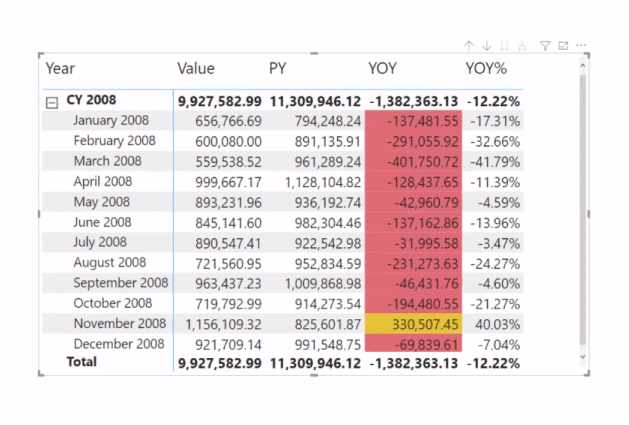
What if I want to apply conditional formatting to the Year Over Year (YOY) column only? I could do that by creating a specific measure to restrict this column only.
I’ll call this measure CF Background/Fonts for this example. Here I’m using an IF statement with SELECTEDVALUE onto my Time Intelligence calculation item that would equal the YOY. If this is true, I want Sales here; if not, I’ll have BLANK.
The BLANK is not readable by conditional formatting. So whenever there is a blank, it won’t be applied here.
Next, I go to ‘change the background color’. Using the Advanced controls, I format the colors by Rules based on the measure that I would’ve just created (CF Background/Font).

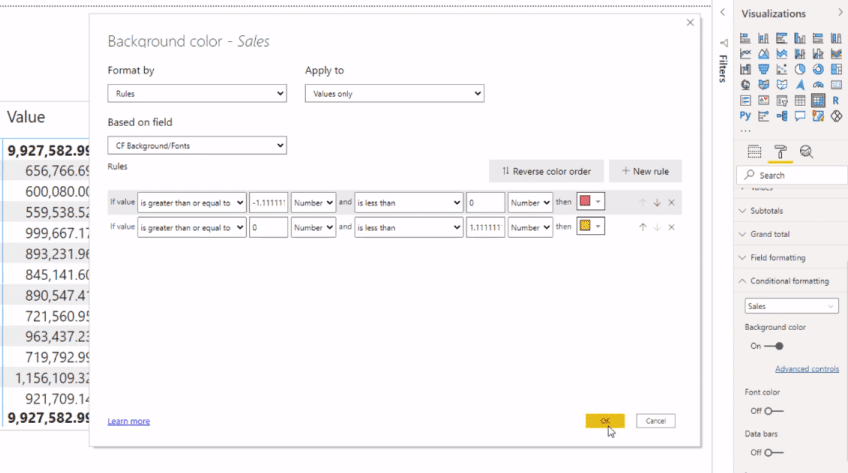
I click OK, and this is the result.
Dynamic Selection On Measures
Now, what if I want to dynamically select my measure on the report and the conditional formatting will be applied automatically on the Year Over Year (YOY) section? To do that, I’m going to create a calculation group for my Cost, Margin and Sales measures.
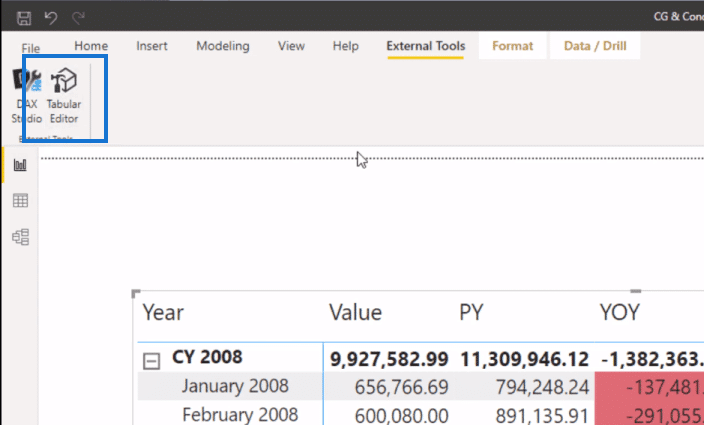
So, I’ll go to the Tabular Editor under the External Tools tab.
Here, I’ll create a new calculation group, which I’ll call Measure Selection. Under that, I’ll create calculation items for each measure, starting start with Salesv2.
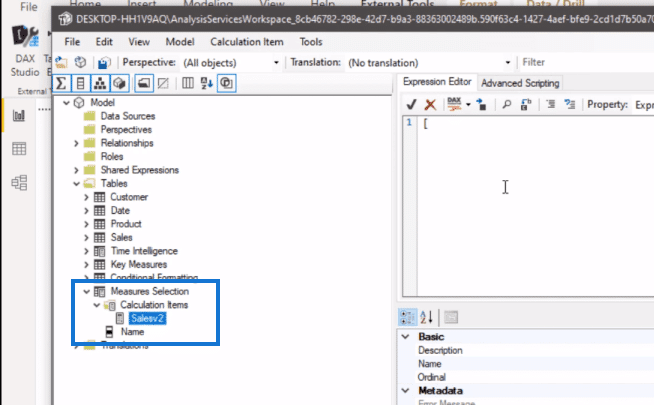
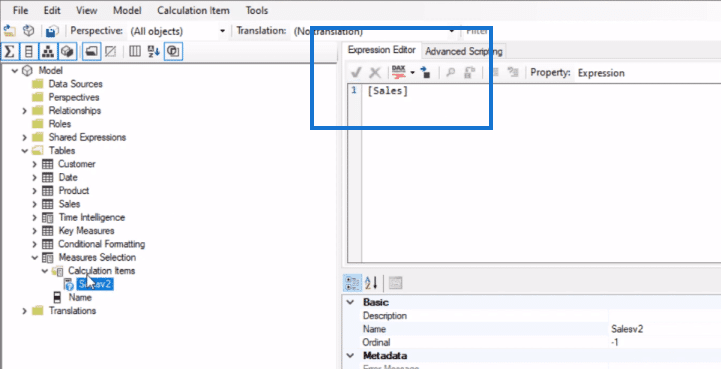
And then, I need to enter the formula for Salesv2 in the Expression Editor.
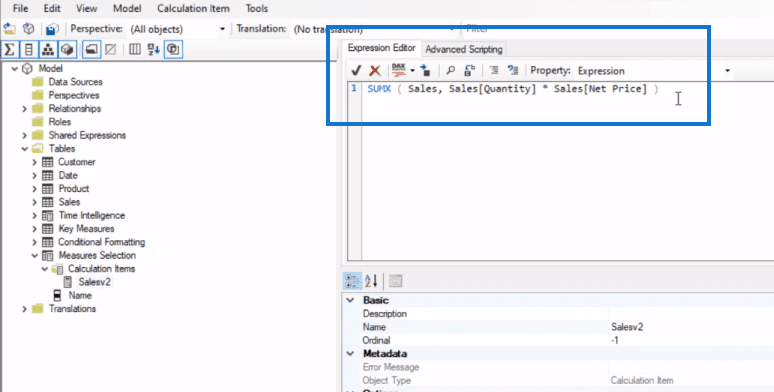
But since I already have this measure created in the report, then I can just simply reference it here, like so.
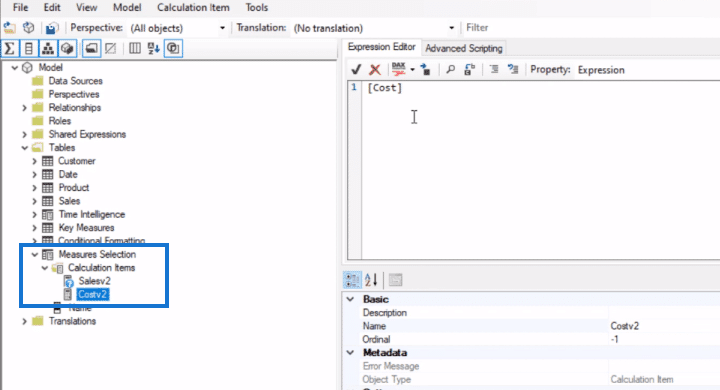
Next, I’ll create another calculation item for Costv2, and reference the Cost measure.
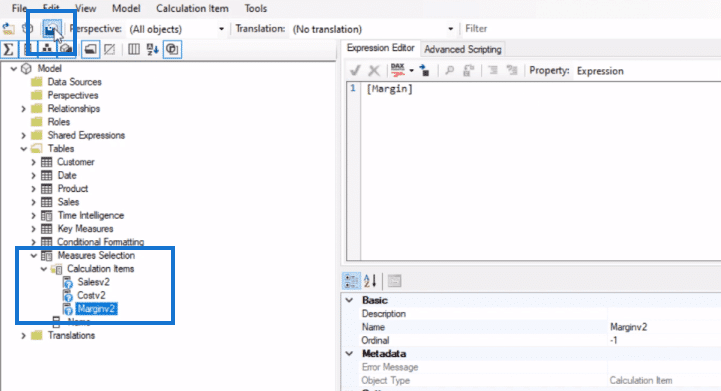
The same goes for Margin. After that’s done, I’ll save the changes and refresh the report.
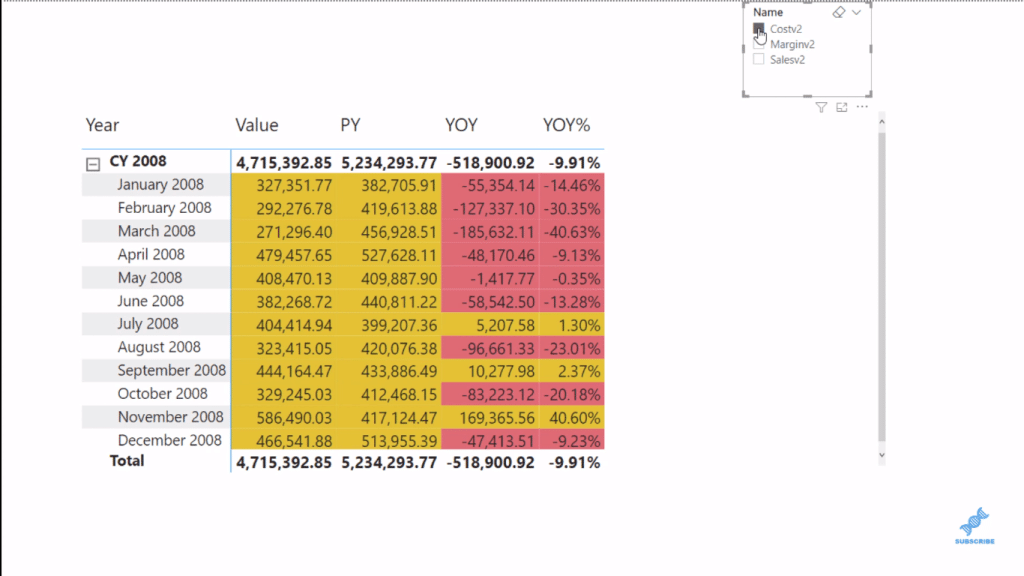
I’ll then place the Selected Measure calculation group in a slicer in my report. However, this is the result when I make a selection within that slicer. I believe this is one of the limitations of this Power BI feature. We cannot directly change our measure in the report, like so.
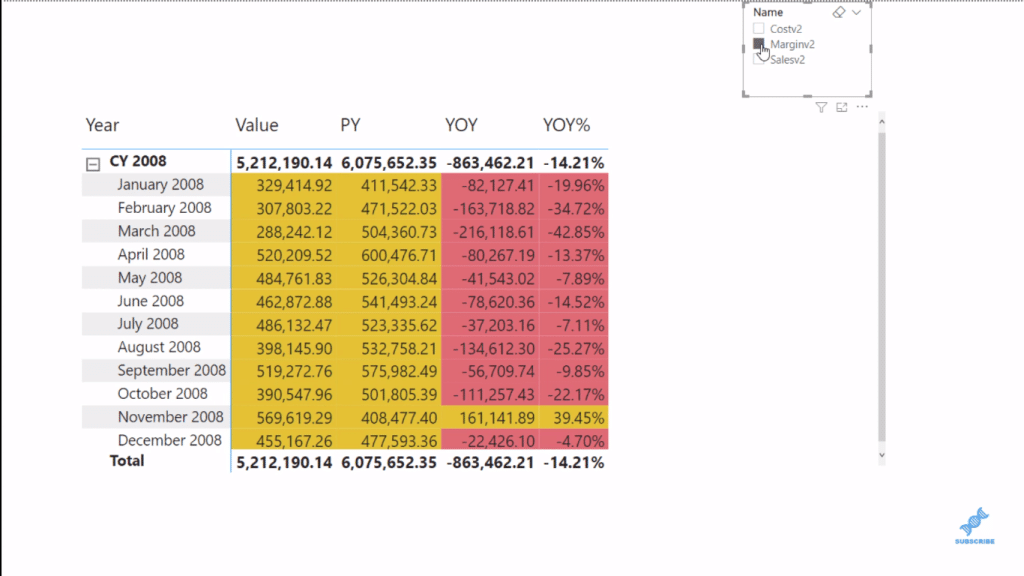
But if you want to make your report more visually compelling to be able to clearly see the positive and negative results here, for example, this feature is very useful.
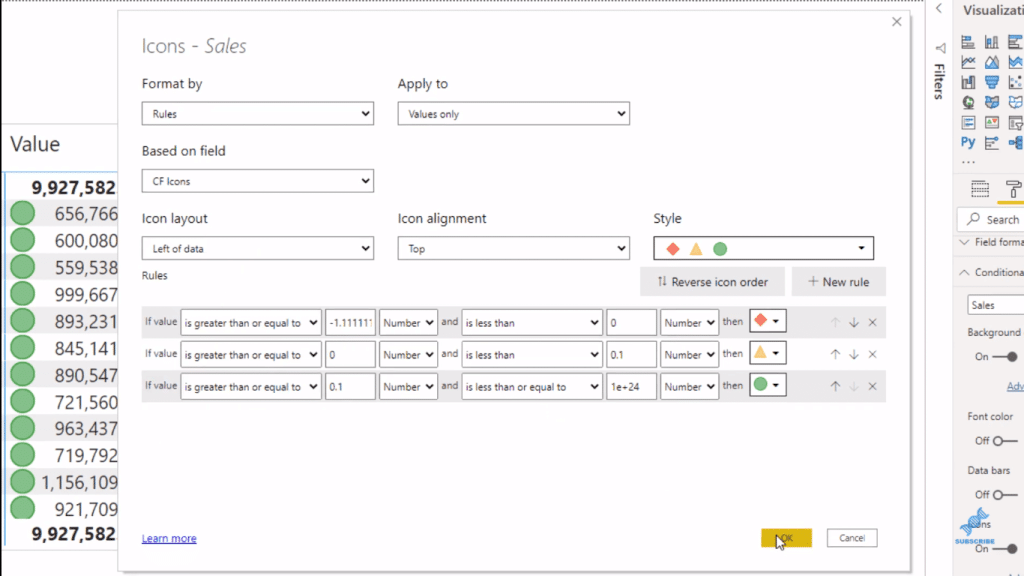
Applying Conditional Formatting To Icons
We saw that we can apply conditional formatting to the background and the font, now let’s try to apply it to icons and see if it works well.
So for instance, I want to apply this on the Year Over Year percentage (YOY%) column, I’ll create another measure to restrict this particular column only.
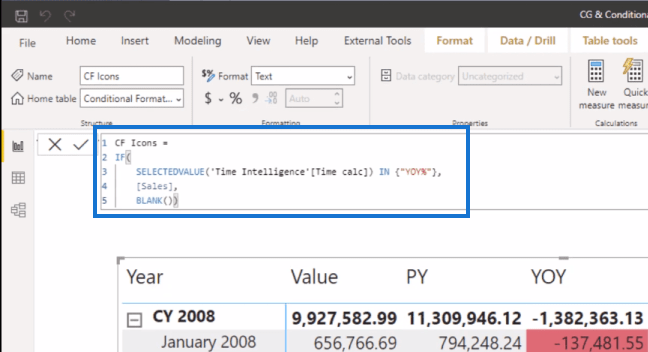
Then, I’ll go and turn on Icons.
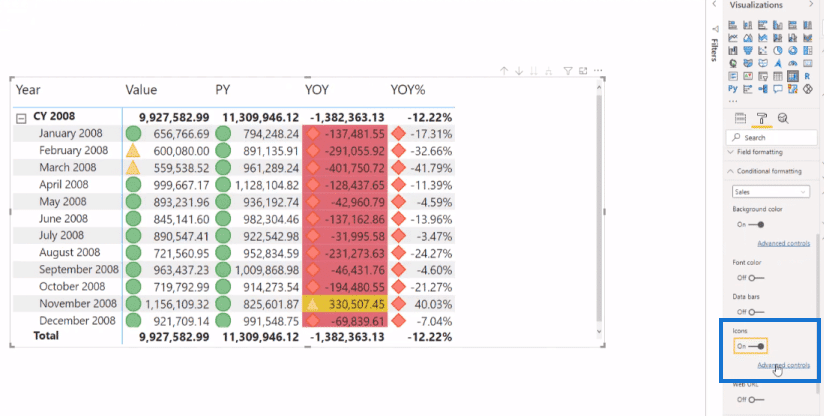
I’ll then go to Advanced controls to format this by Rules based on the new measure I created (CF Icons). I just put some random numbers for the rules then click OK.
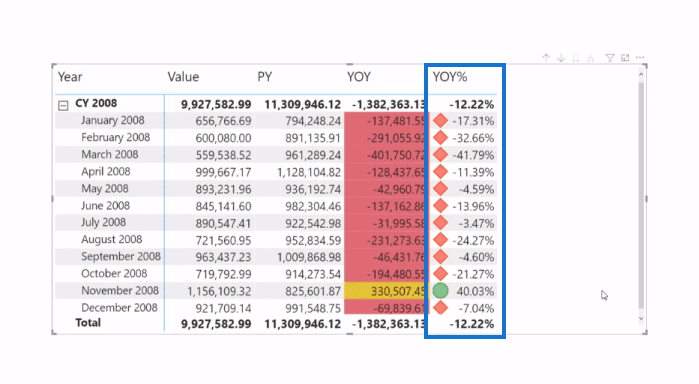
And now you can see the formatted icons in the YOY% column.

***** Related Links *****
Custom Conditional Formatting Techniques In Power BI
Power BI Conditional Formatting For Chart Visuals – What’s Possible?
Showcase Unique Insights Using Conditional Formatting In Power BI
Conclusion
In this blog, I’ve shown you how to apply conditional formatting to calculated items and you’ve seen what it looks like as a background, font, and icons.
I think that this is a very cool and useful feature in Power BI that could definitely add more value to your visualizations and reports. Check out the full video tutorial below for more details on this topic.
All the best,
Mudassir


