In this tutorial, you’ll learn how to create a dynamic header and footer in your paginated reports. This allows you to create templates for reports that you’ll be making in the future.
Dynamic means that regardless of the dataset used in the report, the header and footer will automatically change to fit requirements. This is especially useful for businesses who create a variety of reports everyday.
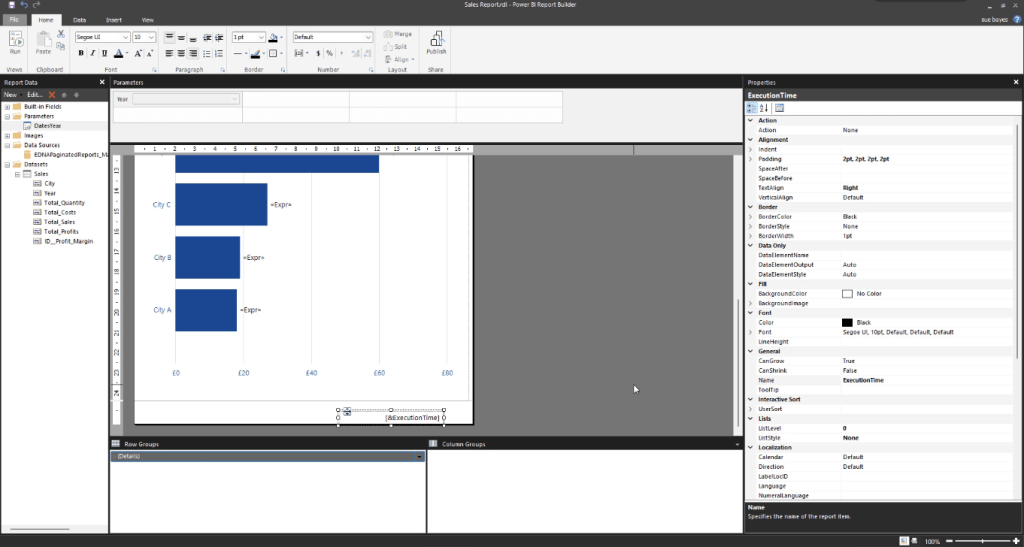
Create A Dynamic Footer
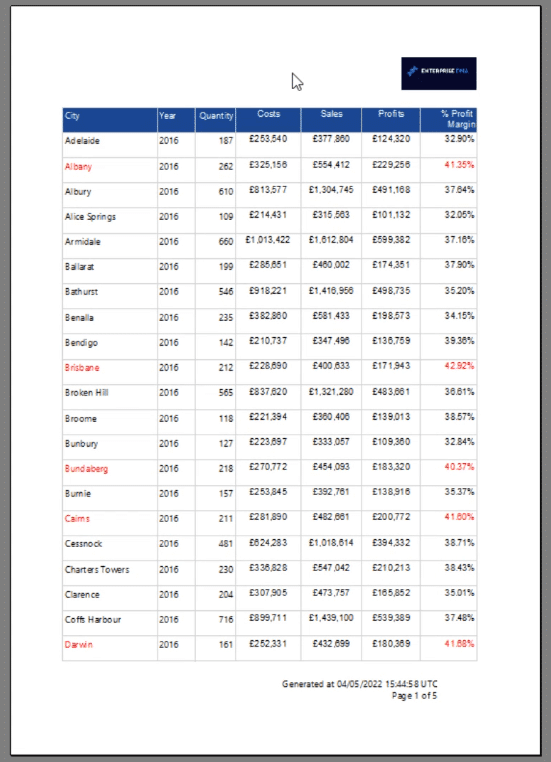
In this example, the current footer is the execution time. It shows a time stamp for when the report was produced.
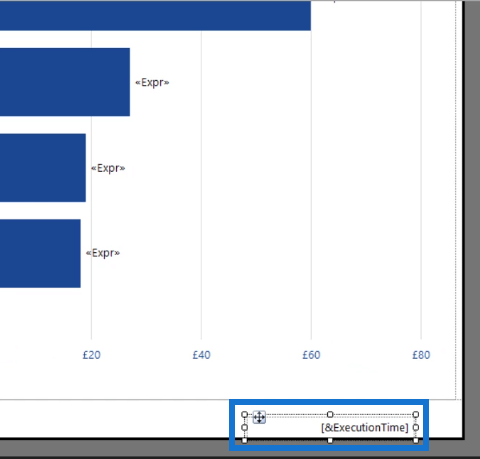
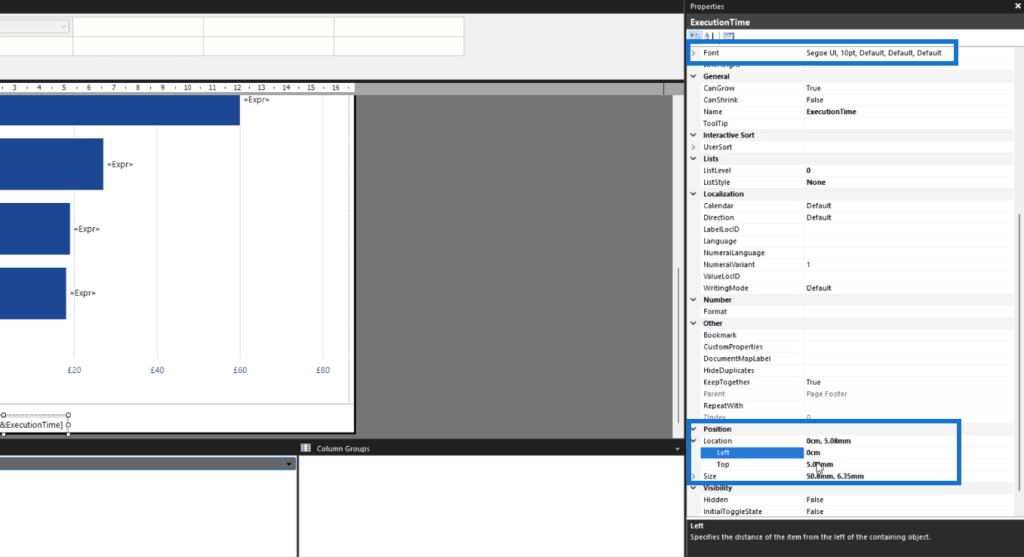
Adjust its position and location using the Properties pane. You can also change its font, font style, and color.
In paginated reports, it’s best practice to Run your report after you make changes. In the case of headers and footers, you’re able to see what they look like in your report and make necessary adjustments.
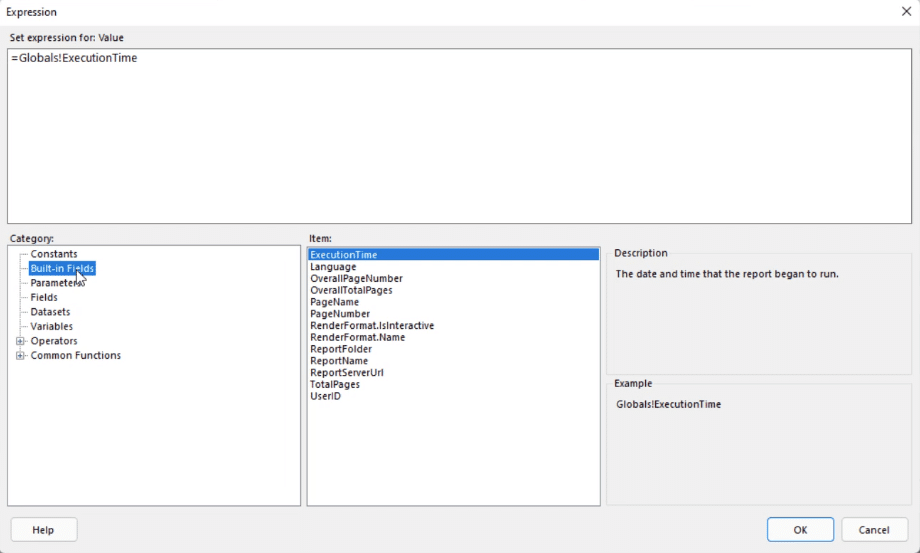
Double-click on the footer to open its Placeholder Properties. Then, click on the fx button under Value.
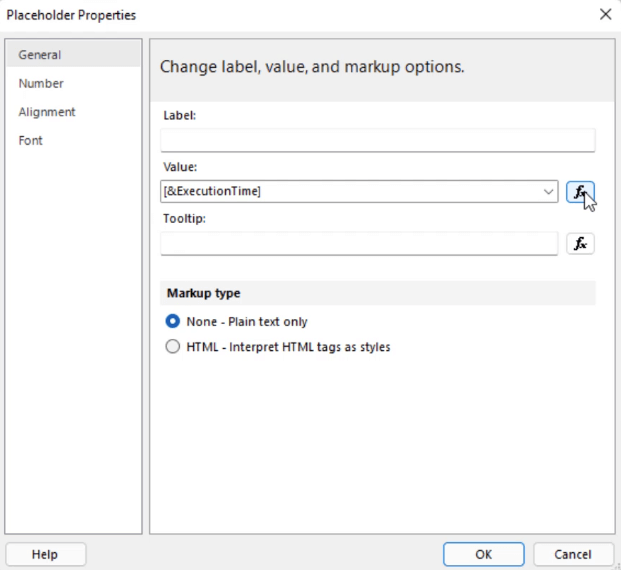
This takes you to the Expression Builder. You can see the expression used is Globals!ExecutionTime, which shows the date and time the report began to run.
Add Page Numbers
If you want to add other elements in the footer, you can choose from the categories in Expression Builder.
In this case, let’s add page numbers. To add another element in the footer, use ampersand. Then, double-click on an item to place it in the Expression text box.
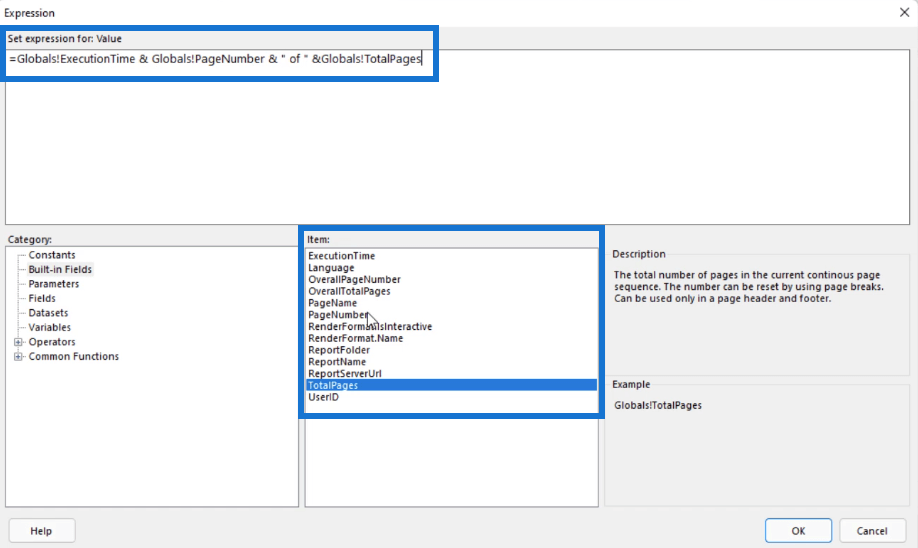
For this example, other than the execution time, it’ll also show the page number with respect to the total number of pages.
The next step is to format the footer. You can add texts and spaces in between to improve the format of the footer. You can also format the date and time of the execution time.
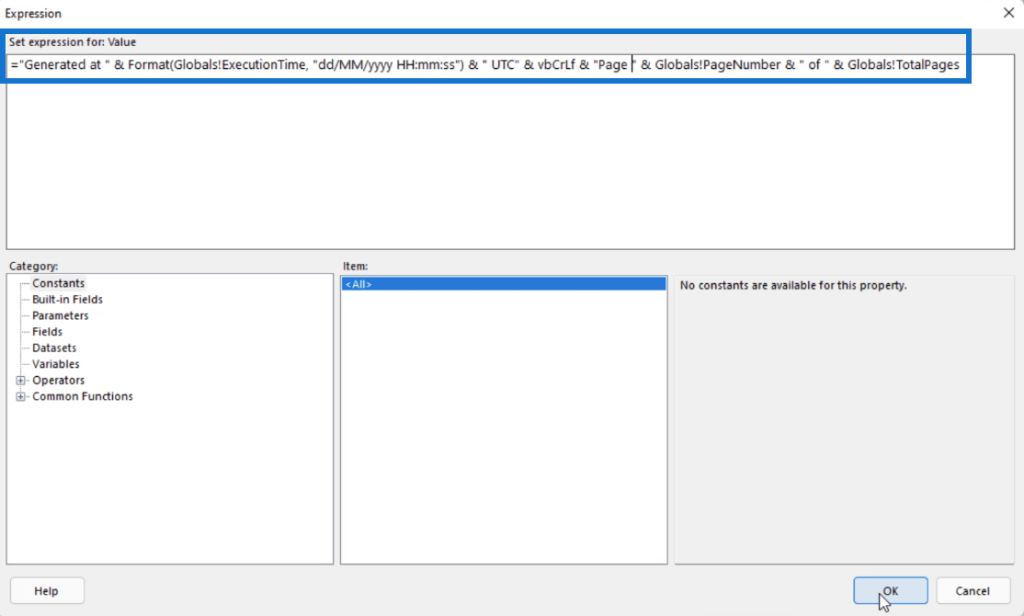
Remember to be mindful of brackets and quotation marks ( “ ). Double check the expression to make sure it properly works.
Creating an expression is an iterative process.
It’s normal to go back and forth from the Expression Builder to the Run view and make sure you’re getting the format you want.
When you run your report, you’ll see that the footer looks better compared to its first formatting style.
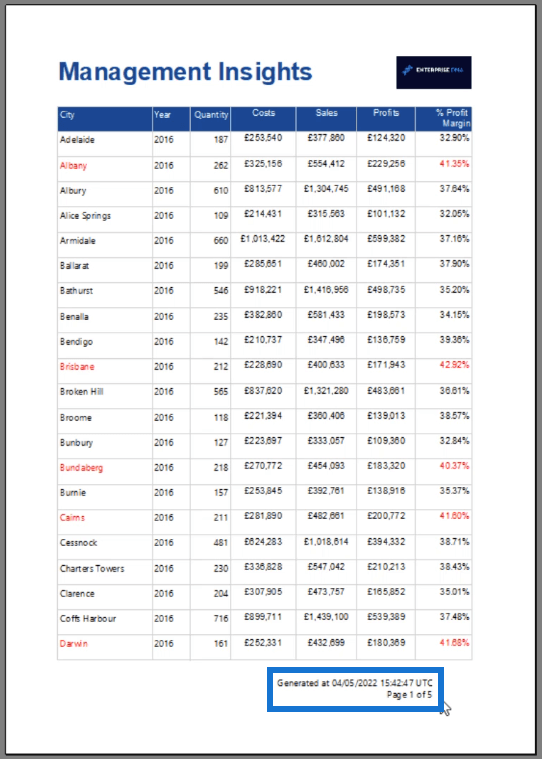
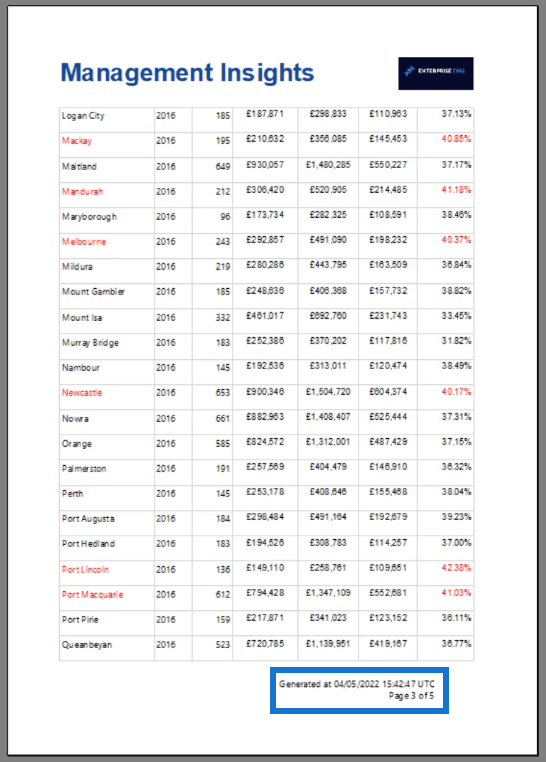
There are other built-in fields that you can add. After learning the basics, it’s recommended to continue exploring on your own. You’ll discover other features that best suit your needs.
Create A Dynamic Header
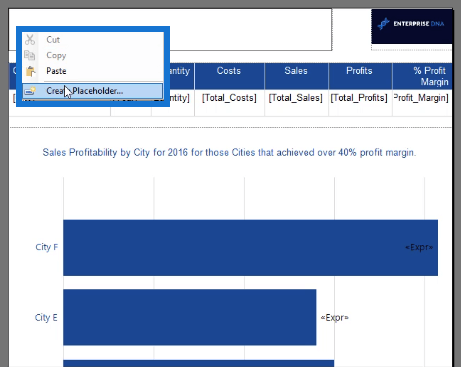
To make a dynamic header or title for your report, create a placeholder.
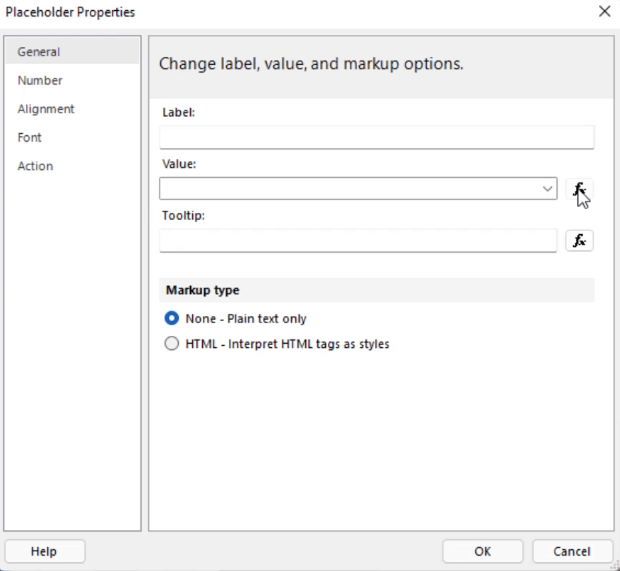
In the Placeholder Properties window, click the fx button under Value to go to the Expression Builder.
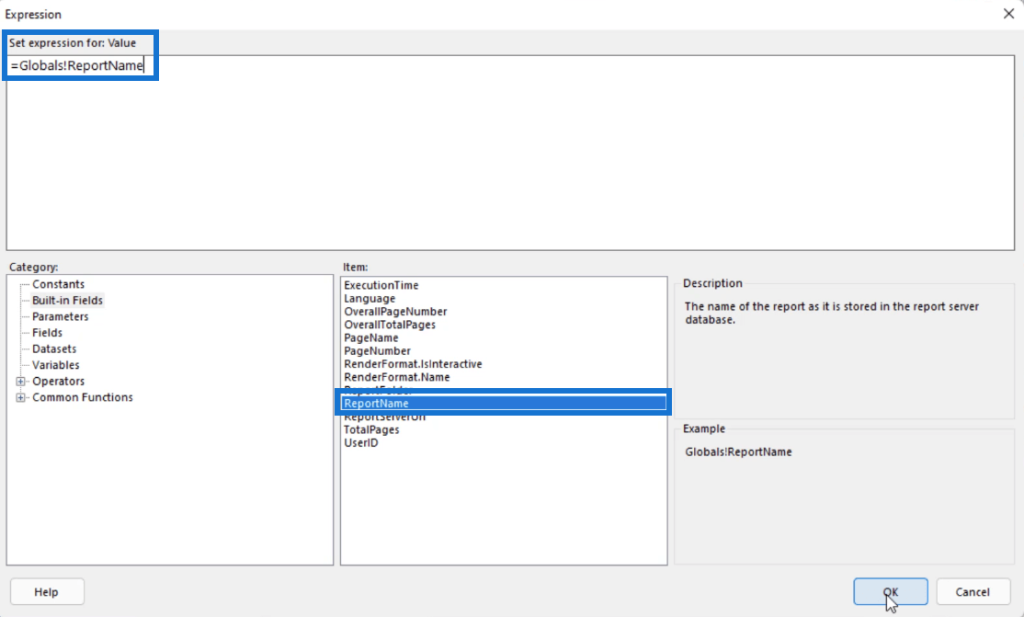
In the Built-in Fields category, double-click the ReportName item. Then, click OK.
In the Design view, you can see that the title of the report now contains &ReportName.
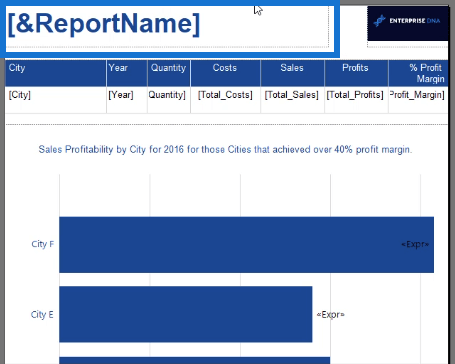
When you click Run, you won’t see the Report Name because it hasn’t yet pulled information from its publishing source. However, you can save and use this as a template.
Save The Dynamic Header & Footer As A Template
You can delete the table and chart so that the template will just be the header, footer, and logo.
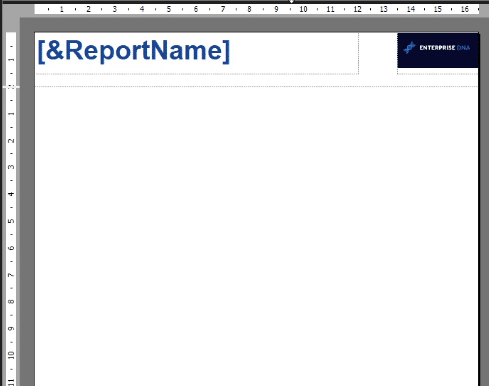
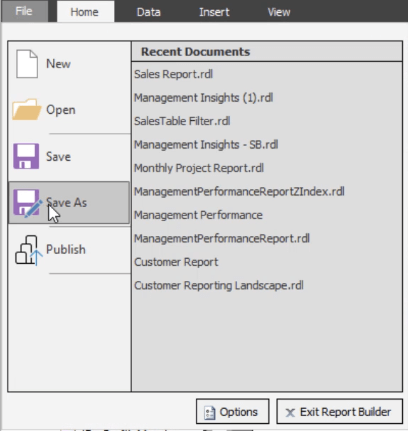
Click the File tab and click Save As. Then, save the report as a Template.
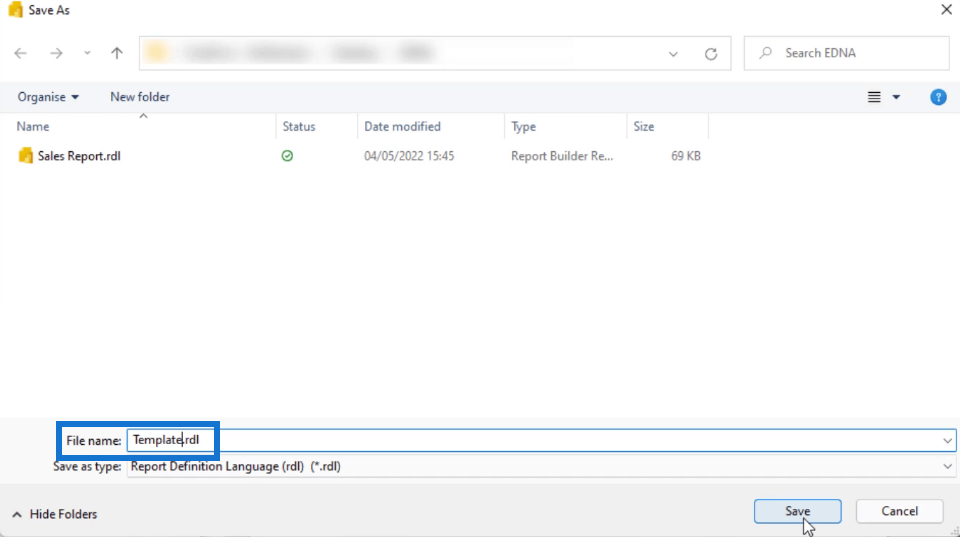
The next time you create a paginated report, you only need to open the Template and add fields such as tables or charts. The header and footer are dynamic, so they will automatically adjust to the dataset you’re using in the report.
***** Related Links *****
How To Import Datasets Into Report Builder
SharePoint Site Navigation Elements: An Overview
Building Power BI Reports: Organizing DAX Measures & Page Development
Conclusion
In this tutorial, you learned how to create a dynamic header and footer on your paginated reports. The process is overall easy to understand and execute. However, you need to be familiar with the different options available for you to modify.
Dynamic headers and footers are very useful features in a business setting. Having a template ensures that all the reports follow a consistent formatting style. This ensures uniformity in all the reports produced by the business.
All the best,
Sue Bayes


