
In this tutorial, you’ll learn about the three different ways you can import datasets into Report Builder.
Report Builder is a Power BI tool that allows you to create printable documents out of your Power BI reports. Once you’ve installed Report Builder in your machine, open it. When it launches, it will look like this:
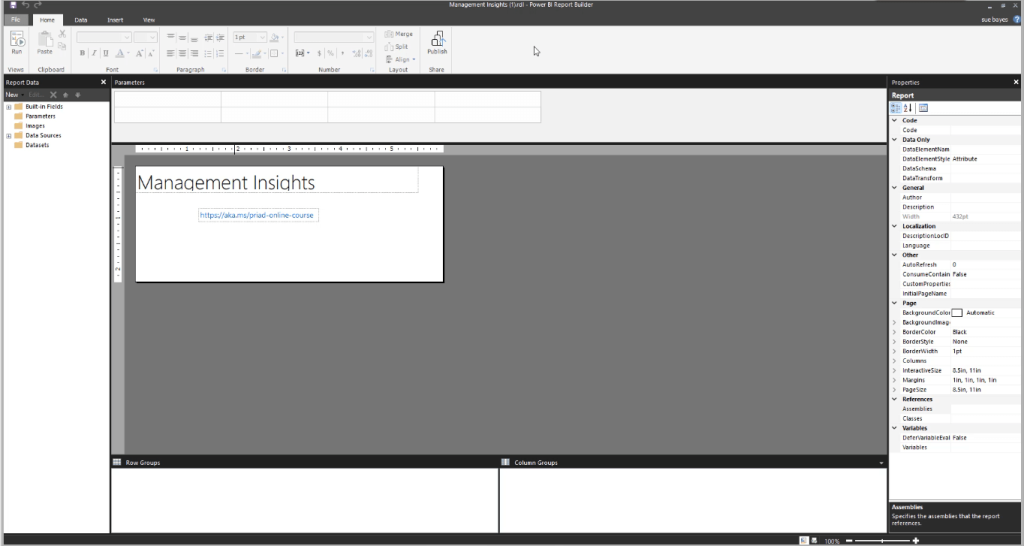
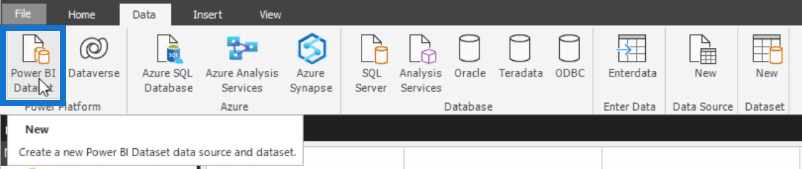
Notice that it has a familiar interface similar to Word and Excel. The Data tab contains the different options you can use to import data. But for this tutorial, the focus is primarily on the Power BI Dataset option.

Getting Started With Report Builder
The Power BI Dataset creates a new data source and dataset from Power BI. It’s your data model within the Power BI Service.
In the left-most pane, you can see the Report Data.
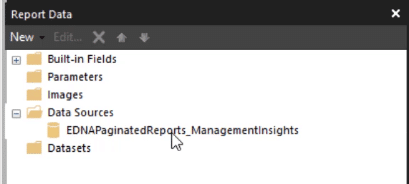
Data Sources refer to the Power BI dataset. Datasets are queries built from the data source.
Importing Datasets To Report Builder
Creating a dataset within paginated reports is similar to creating a query.
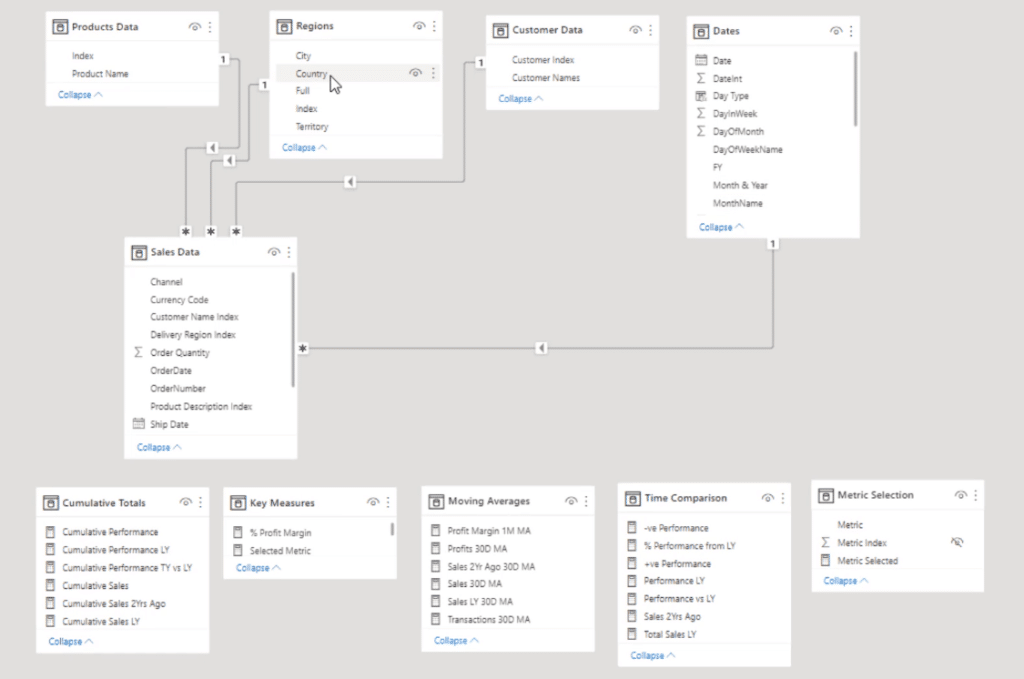
This is the data model used for this demonstration:
The next thing you need to do is import your data. There are three ways to import data to Report Builder.
1. Using The Query Designer
If you click on Datasets and select Add Dataset, the Dataset Properties box will appear.

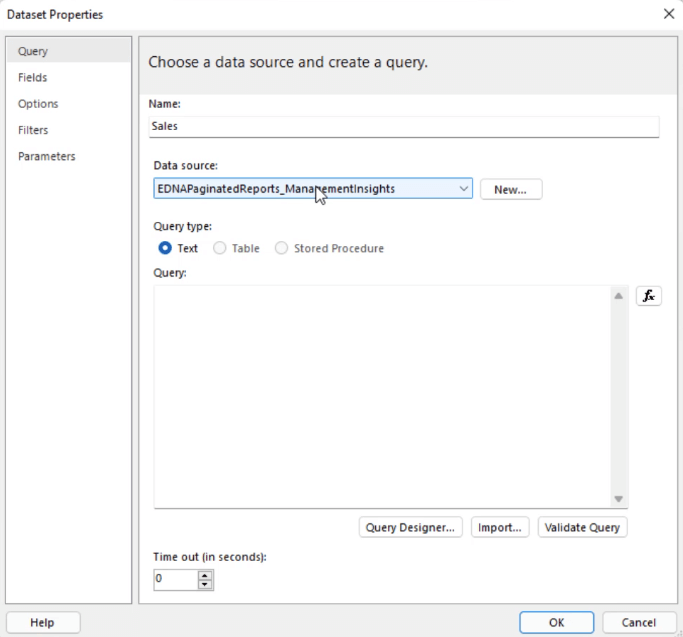
This is where you’ll start creating your paginated report. Input the dataset name you want and select the data source. Then, select Query Designer.
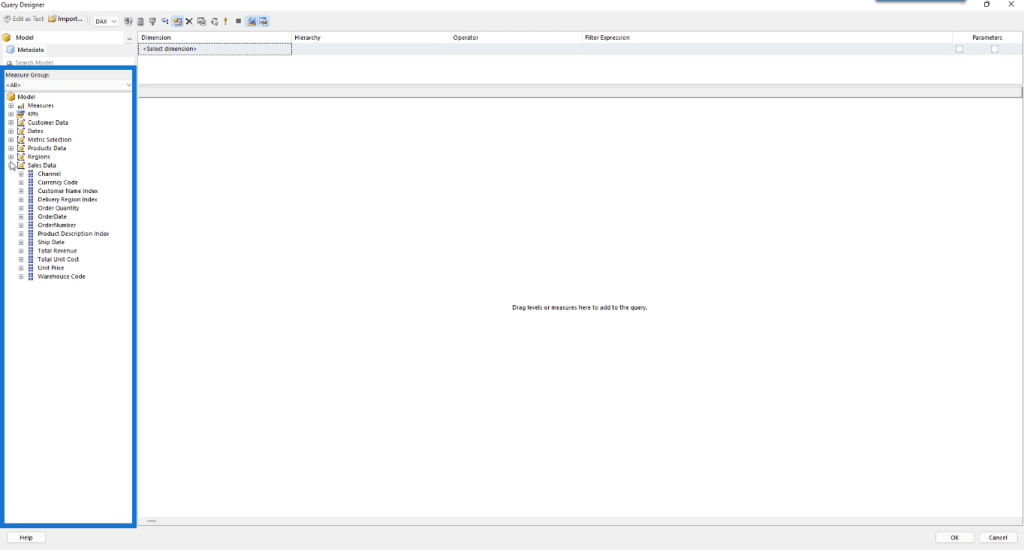
Notice that the tables and all the data in the Power BI data model can be found in the measure group pane of the Query Designer.
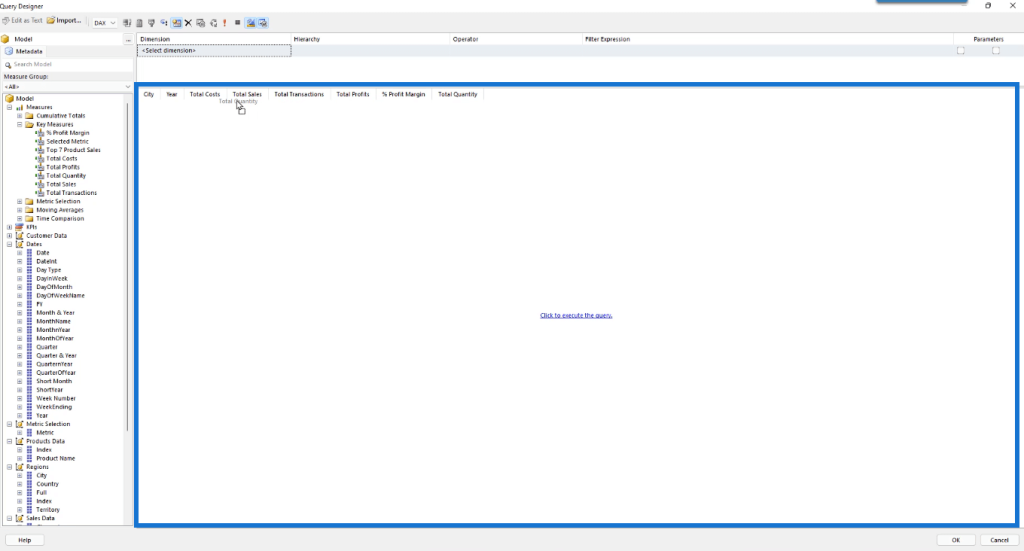
To input data in your paginated report, drag and drop the data you want from the measure group pane to the blank space. You can further drag the column headers to rearrange them.
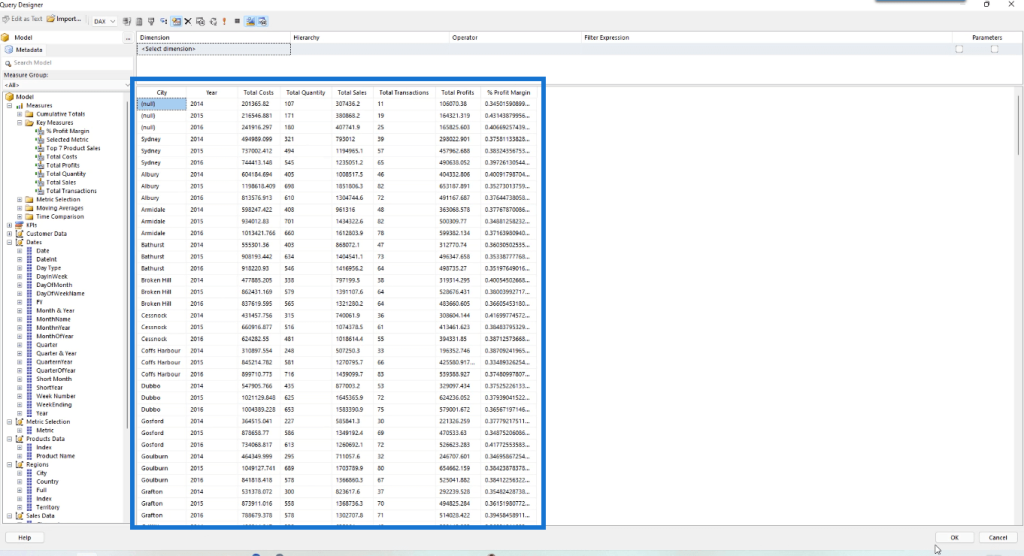
Once done, select Click to execute the query. This is what your table will look like:
Note that the data in Report Builder comes through as standalone tables, which means they aren’t linked to one another. But in Power BI, you can see the relationships. For Report builder, you only need your measures to enable you to pull these tables together. You can also add filters to your newly created table. This topic is discussed in another tutorial.
Once you’re satisfied with your work, click OK. When you go back to the Dataset Properties box, you’ll get a DAX query:
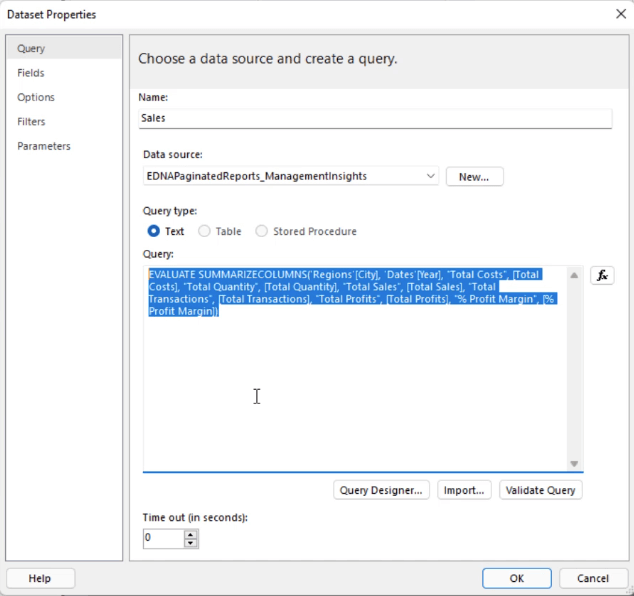
For this example, it’s summarizing the columns for City and Year. Then it’s creating new columns for the Total Quantity using the Sales measure.
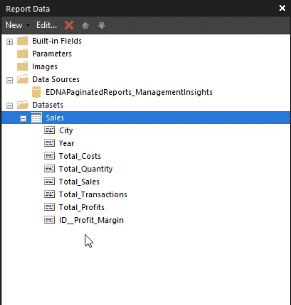
If you press OK, you’ll now have your dataset imported into Report Builder.
2. Using DAX Studio
Another way to import data into Report Builder is by using DAX Studio.
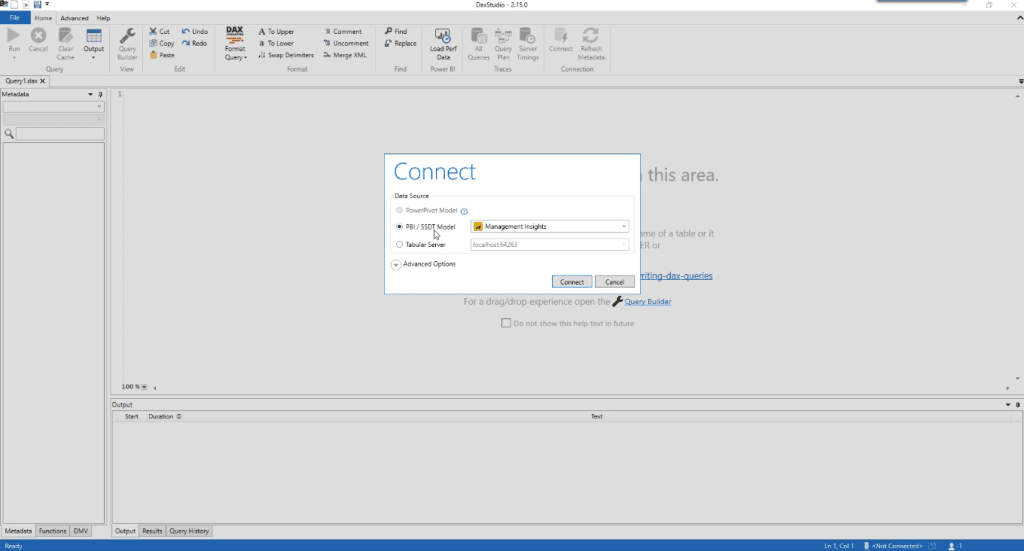
Open your DAX Studio software. Click PBI/SSDT Model and select the data model you want to use. In this example, it’s using the Management Insights model. Then, click Connect.
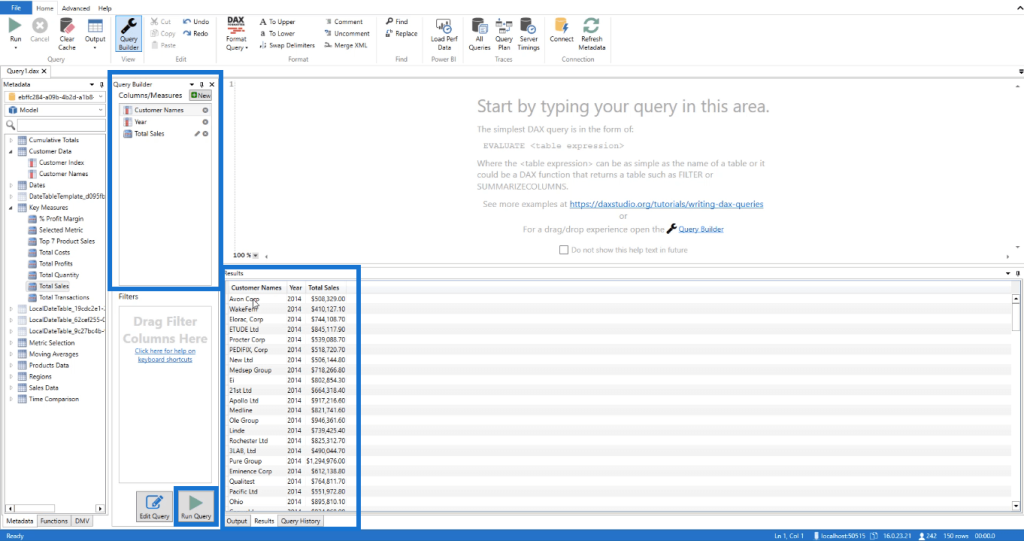
Select the Query Builder option under the Home tab.
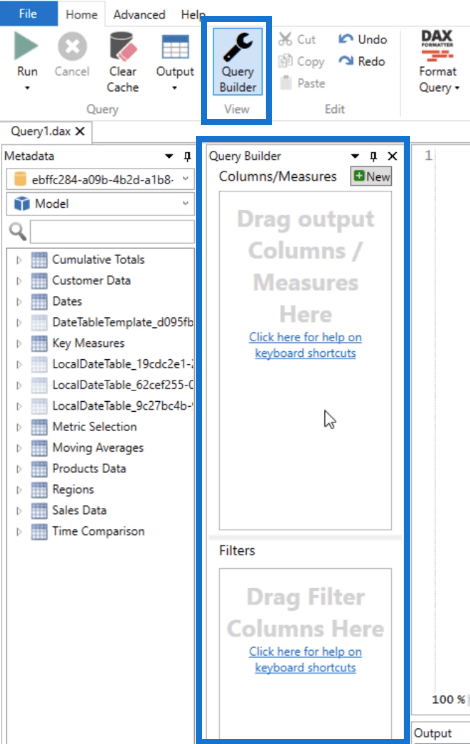
Drag and drop the data and measures you want in your report then click Run Query. The Results pane shows what the table looks like based on the data you selected.
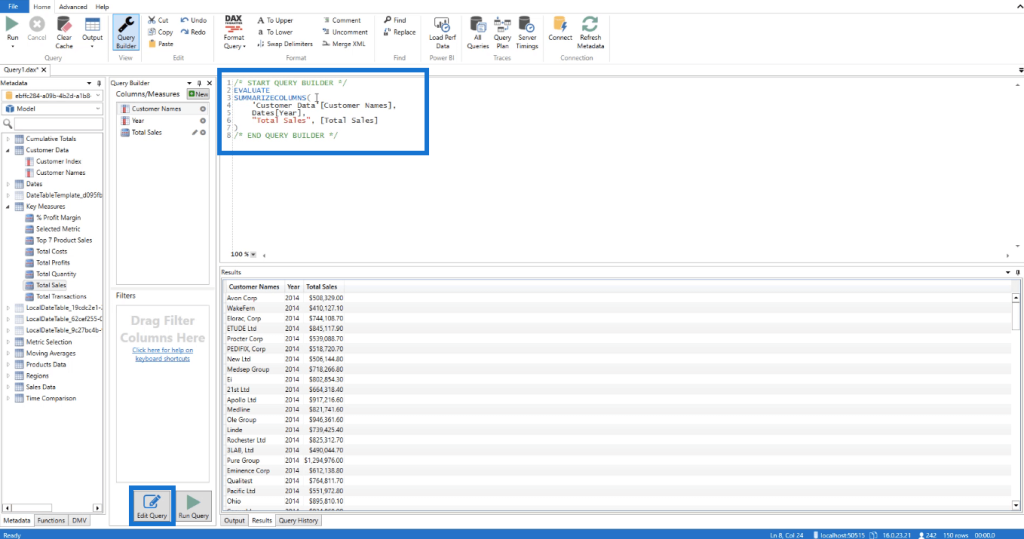
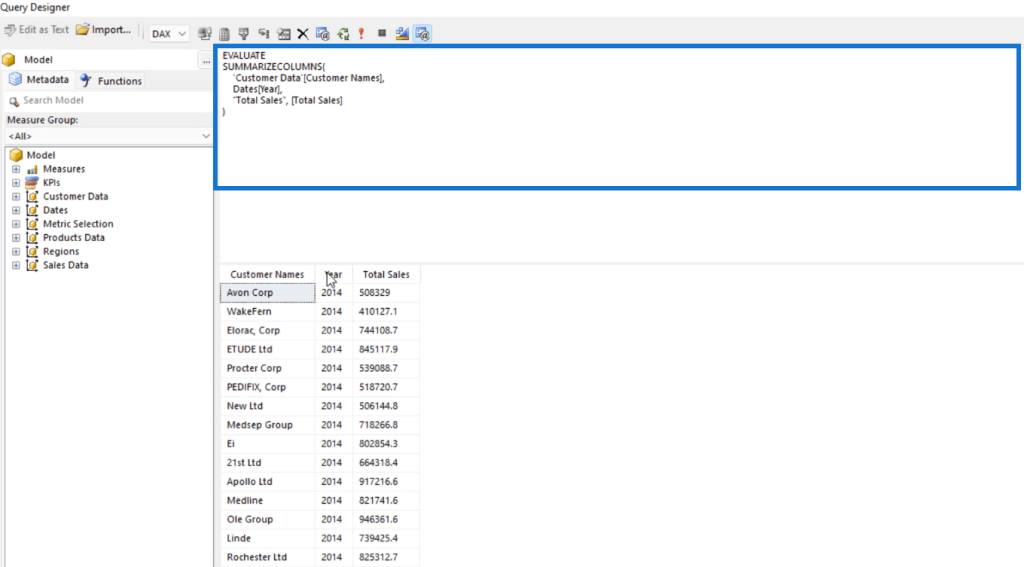
If you click Edit Query, DAX Studio will automatically display the DAX Query corresponding to the table.
Copy the DAX query and go back to Report Builder. Click Datasets and then Add Dataset to open the Dataset Properties box.
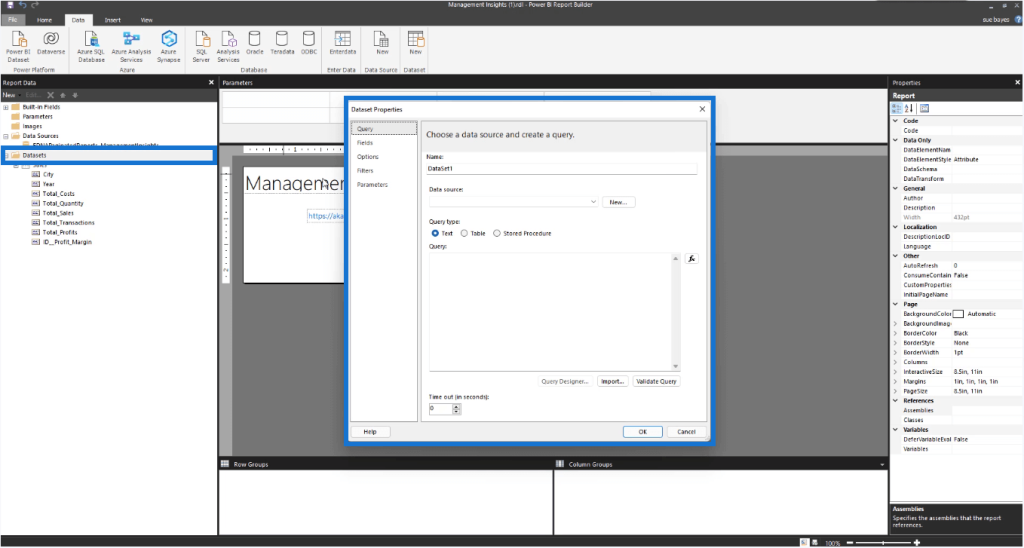
Edit the name and data source, then paste the copied DAX query in the query text box.

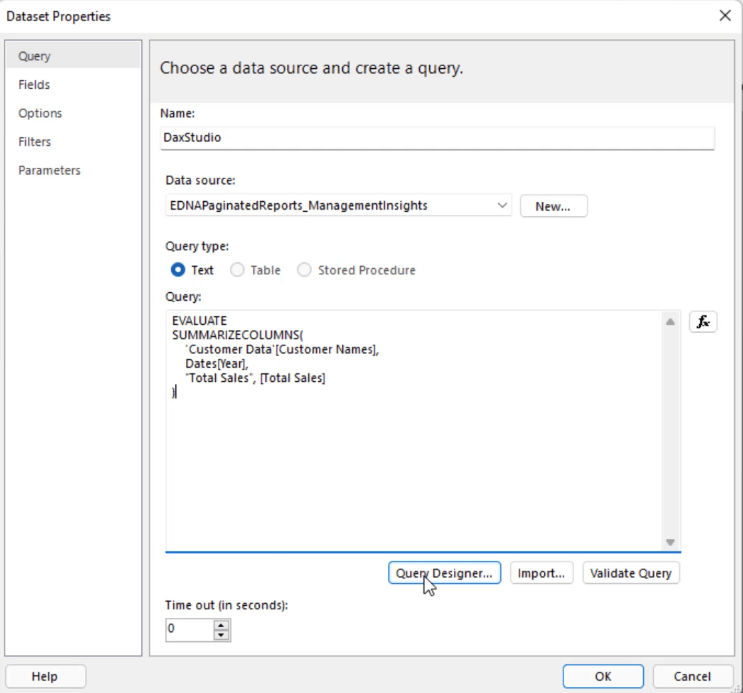
Click Query Designer.
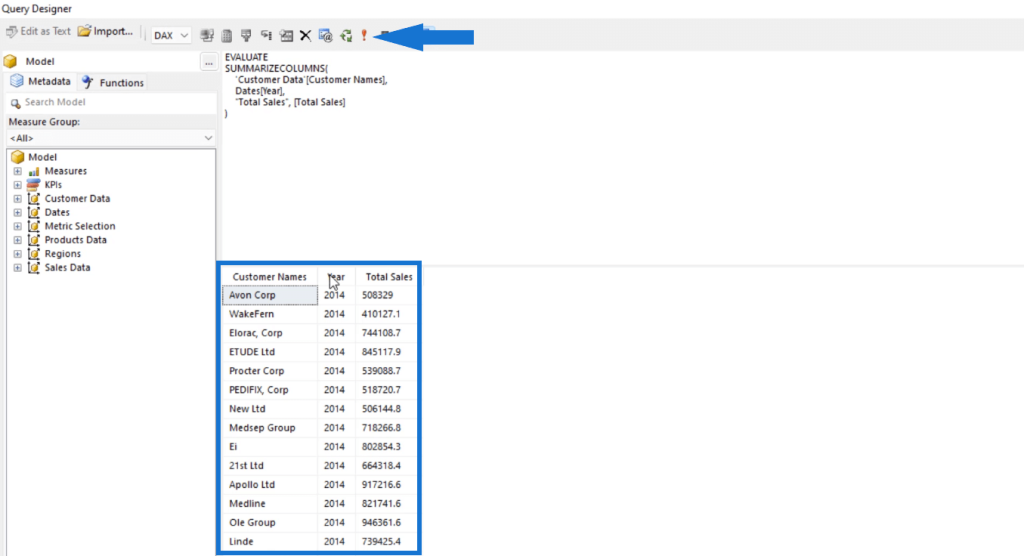
When you use DAX Studio to import datasets into Report Builder, you lose the Filter and Parameter pane at the top of the Query Designer.
Click the red exclamation point ( ! ) to execute the query.
If you press OK, you’ll see that you have another dataset or query under your Datasets folder.
3. Using Performance Analyzer
The third option you can use to import data into Report Builder is by using Performance Analyzer.
Open Power BI and create a new page. In this example, the new page contains a table with data on the Year, Customer Names, and Total Profits.
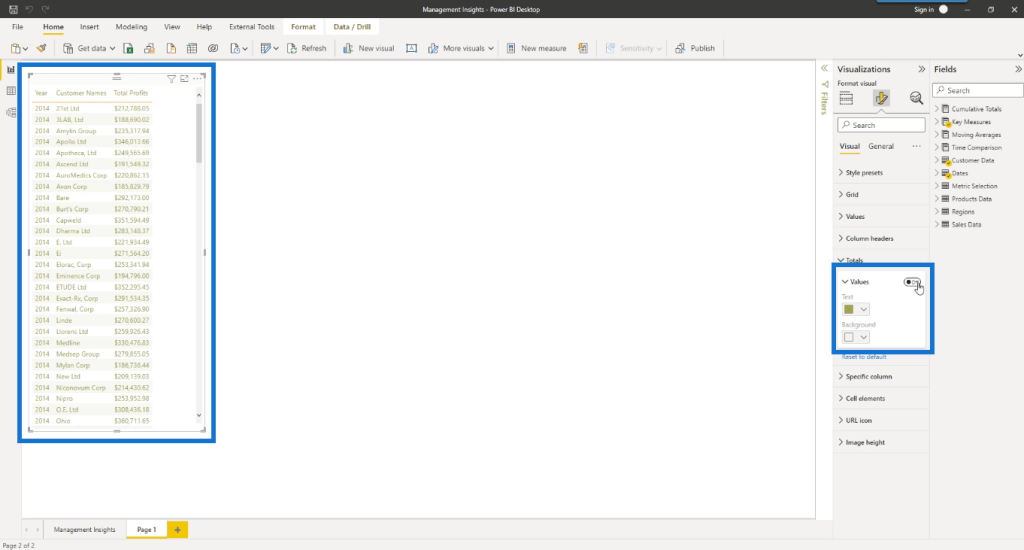
Notice that the Total for each column is turned off. Under the View tab, click Performance Analyzer.
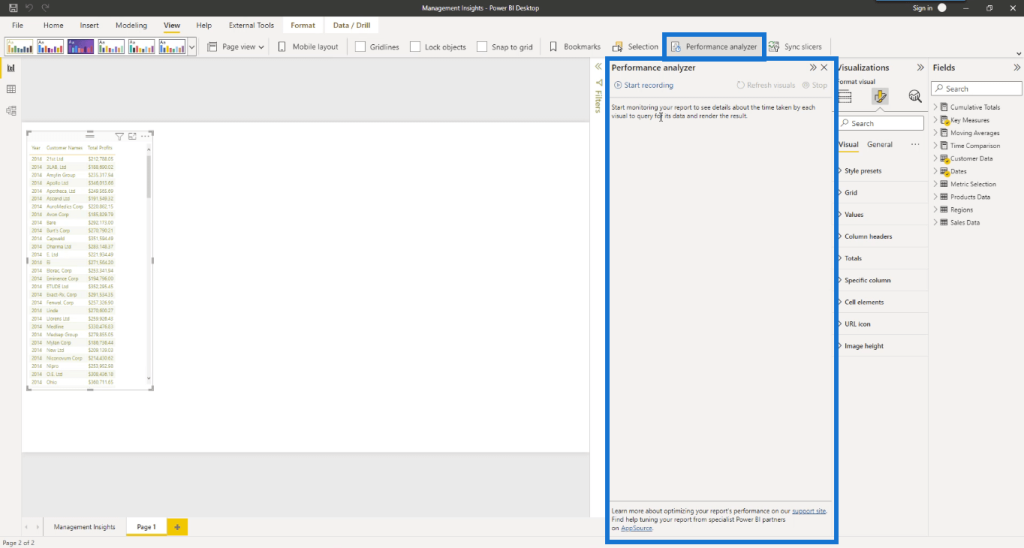
Performance Analyzer is a great tool to use if you want to understand what’s happening within your visuals.
Click Start recording and then click Refresh visuals. Once it refreshes, click the plus sign beside Table.
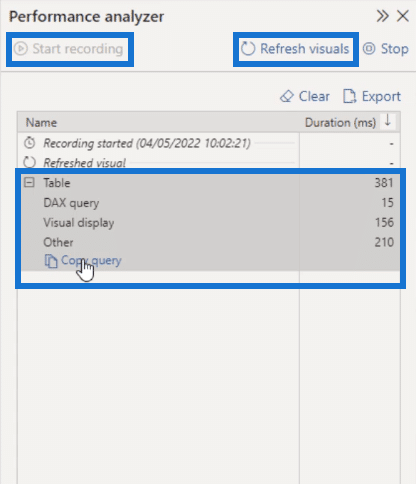
You’ll see that there’s an option to copy the DAX query of the table. Click Copy query.
Open DAX Studio. Again, choose the Power BI model you need and then click Connect. Paste the query in DAX Studio.
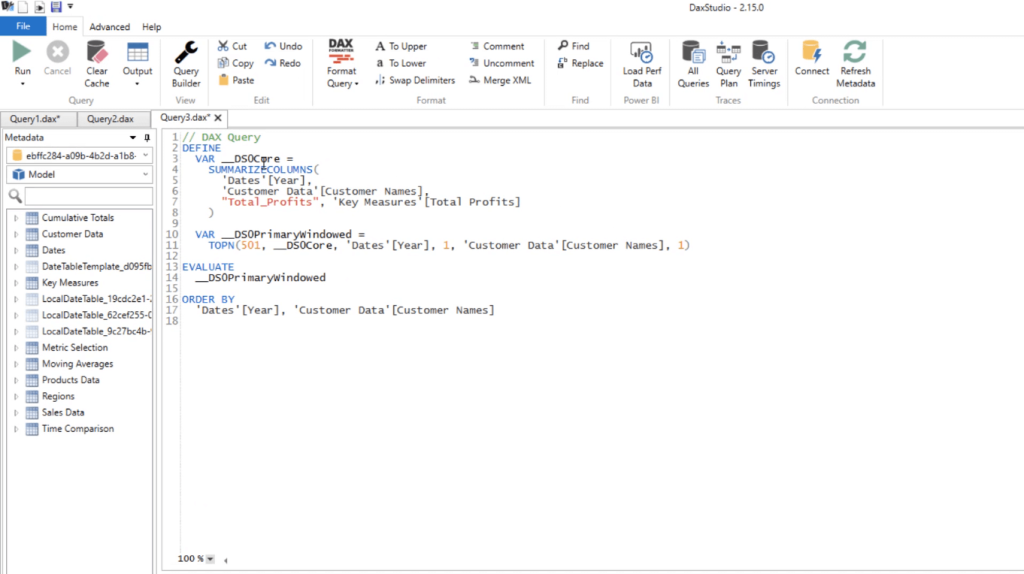
The purpose of turning off the Totals is to make the DAX code easier to understand. Also, if the Totals were included, a ROLLUP function would’ve been included which isn’t necessary when creating paginated reports.
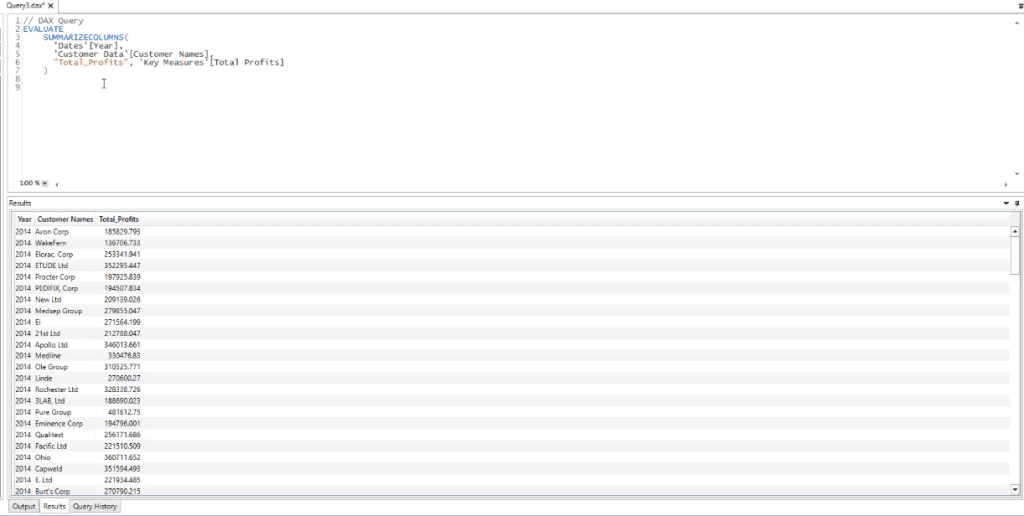
If you Run the code, you’ll see the table in the Results pane.
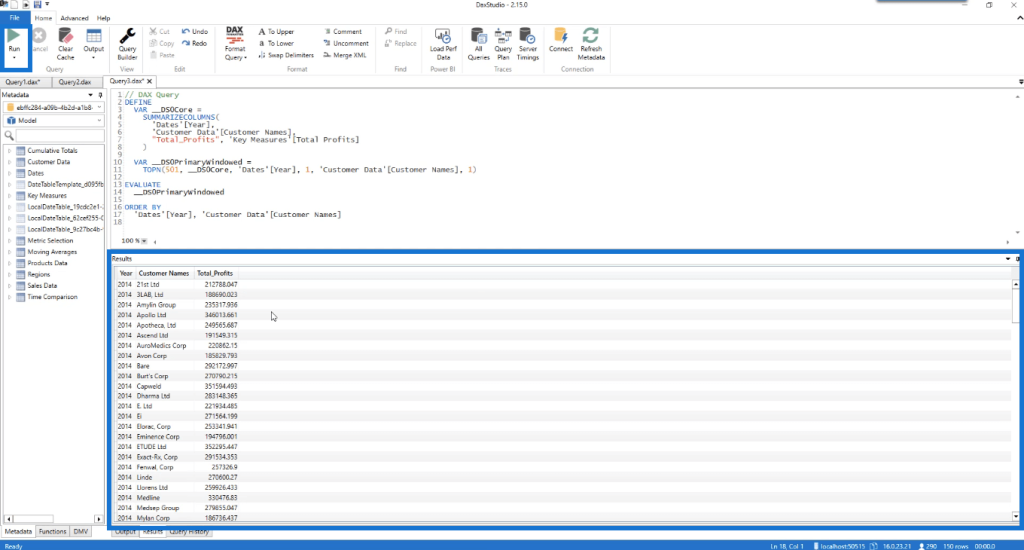
This is the same table created in the Performance Analyzer.
However, the other lines of code in this query isn’t really needed. It’s best to remove the noise from your code to make it simpler.
Copy this DAX query and go to Report Builder. Click Datasets and then select Add data. In the Dataset Properties box, paste the copied DAX query in the blank Query box.
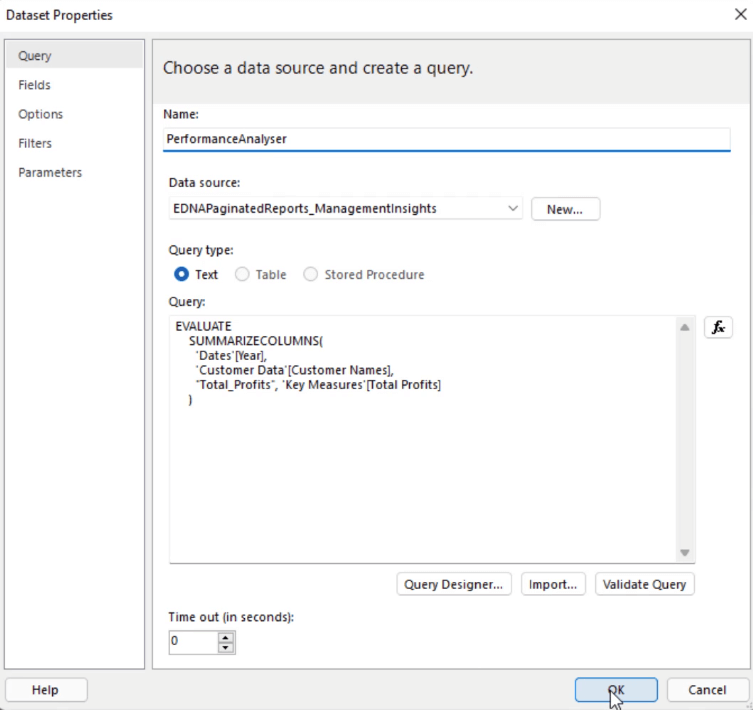
Don’t forget to specify the name and select the data source. Also, make sure that the name doesn’t contain spaces or else it will give an error. Once done, click OK.
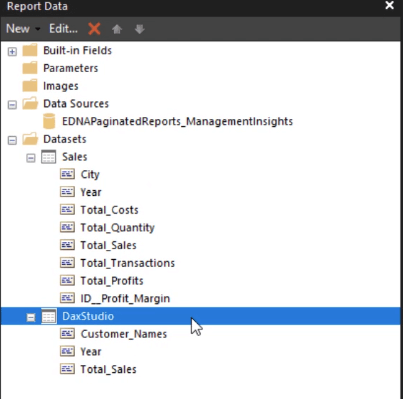
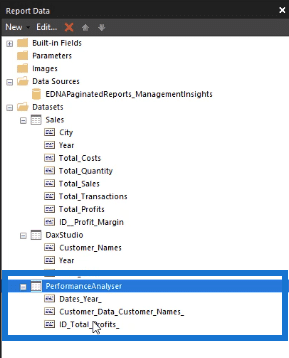
You’ll then see the new imported dataset in the Report Data pane.
***** Related Links *****
How To Load Sample Datasets In Python
Paginated Report In Power BI: An Introduction
PowerApps Data: How To Upload And View Data In Entities
Conclusion
There are a variety of ways to import data into Report Builder. For this tutorial, the focus is on the Power BI dataset option. Under this option, there are three ways to import datasets. These are through the Query Designer, DAX Studio, and Performance Analyzer. You have the freedom to choose which option to use that would best suit your needs.

Sue


