
In this tutorial, you’ll learn about paginated reports in Power BI. A paginated report is another name for Report Builder.
As an introduction, this tutorial covers the definition and importance of paginated reports and how to install them.

What Is A Paginated Report
For this demonstration, the management insights report is used. This is available to build and download in the Enterprise DNA Dashboarding & Data Visualization Intensive course.
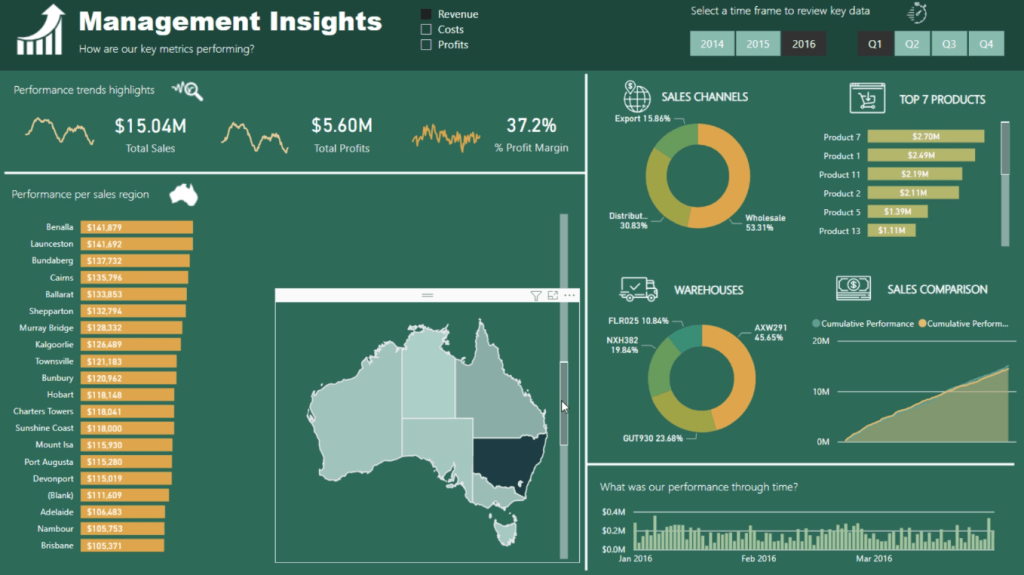
The brilliant thing about Power BI is how it groups, aggregates, and visualizes data. But the problem arises when you need to print your report. Power BI will only print what it can see in the visual pane. It won’t include data that needs to be scrolled or clicked. This is where paginated reports come in.
A paginated report allows you to create a printable report from a Power BI dataset.
This is what the Management Insights report looks like when transformed into a paginated report:
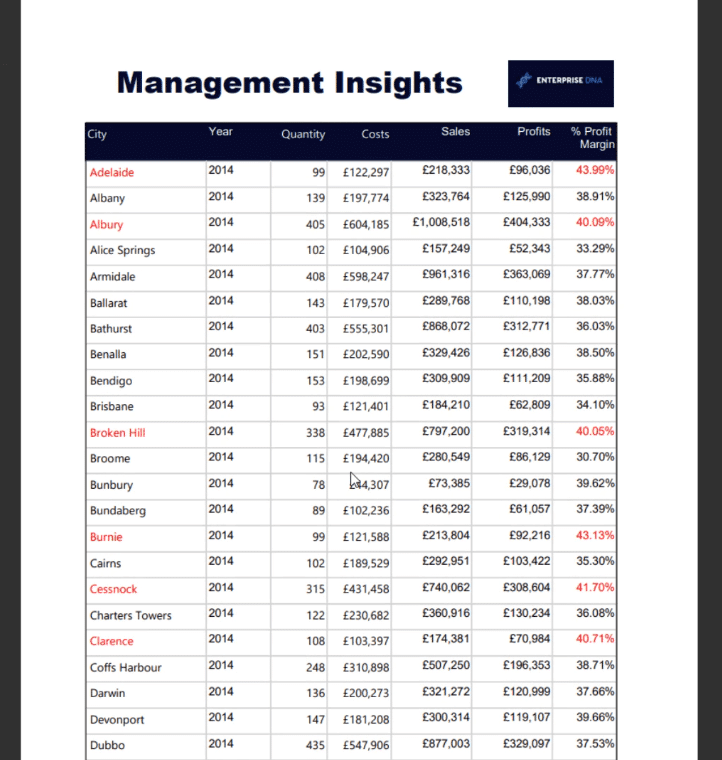
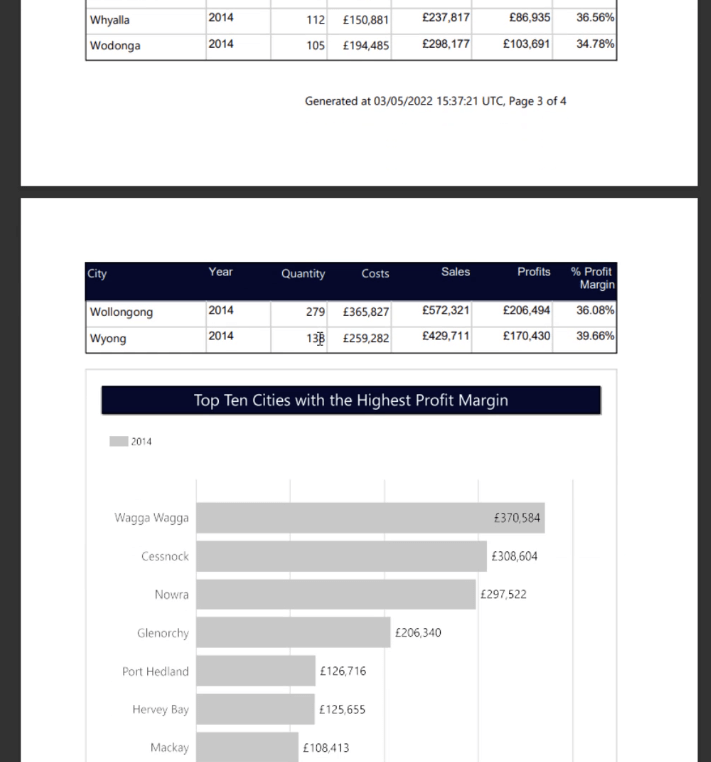
In this case, it’s in PDF format. It contains the same data such as Cities, Quantity Costs, Sales, and so on. You can also include information on the document itself. This includes the creation date and page numbers. There’s also an option to include conditional formatting on the data in the printable report.
It’s a pixel perfect method of building a printable report that contains all the tables and visualizations in the original Power BI file.
Paginated reports are also very versatile. You can export them to a variety of formats, such as PDF, Excel, Word, TIFF, and HTML. You can also view the report using a web browser.

Paginated reports can be stored as snapshots that can be accessed at any time without having to rerun them. This means that you can give the reports to people that don’t necessarily have or use Power BI.
Moreover, the ability to place timestamps in the document is a valuable feature when meeting legal requirements in a business.
How To Download The Report Builder
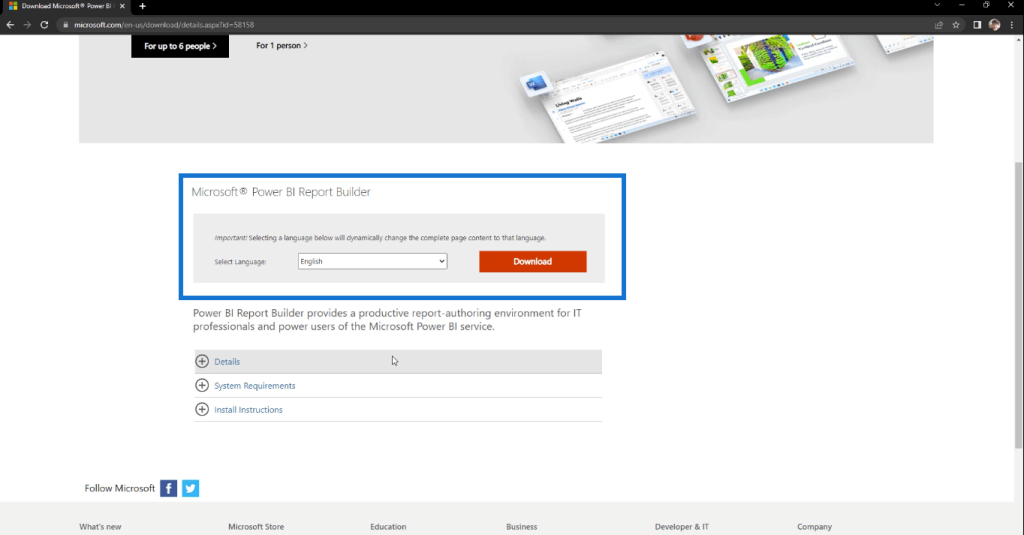
There are two ways to download the Power BI Report Builder.
The first option is to go to the download centre in the Microsoft 365 website.
The second option is to download from the Microsoft Store.
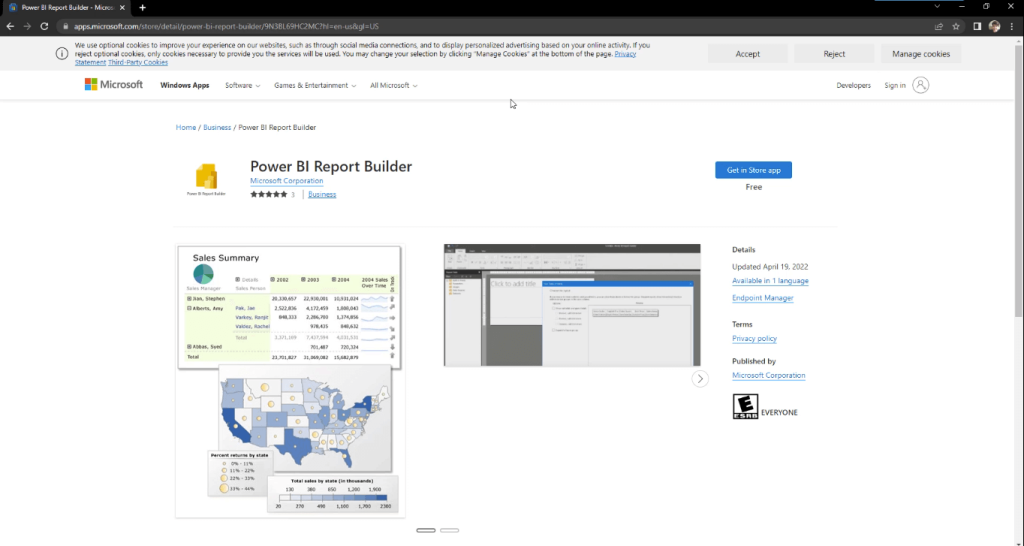
However, this isn’t updated in the same way as in the Microsoft 365 website. So choose which one would best suit your business needs.
How To Create A Paginated Report
Once you have the Report Builder in your machine, you can then use it to create paginated reports.
Go to the app.powerbi.com website and log in to your account.
In this example, a workspace has been created for EDNA Paginated Report.
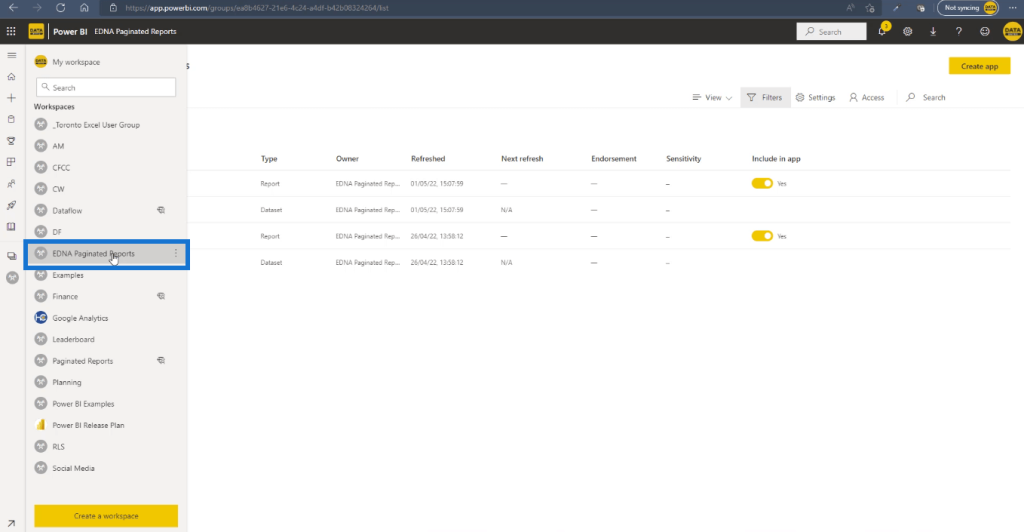
On the dataset of the report, click the 3 vertical buttons for More Options. Then, click Create a paginated report.
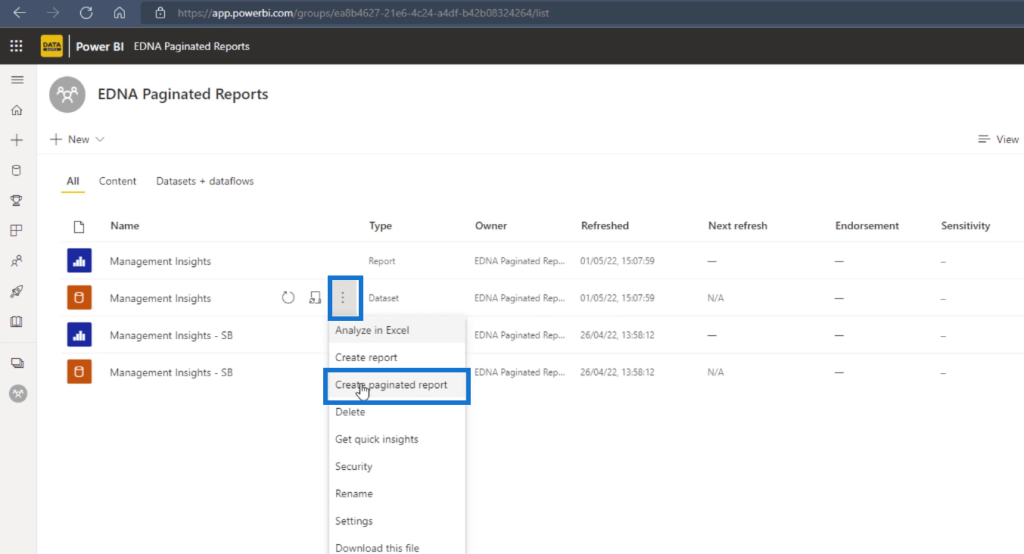
A file will appear in your Downloads. After you click the file, the Power BI Report Builder software will launch.
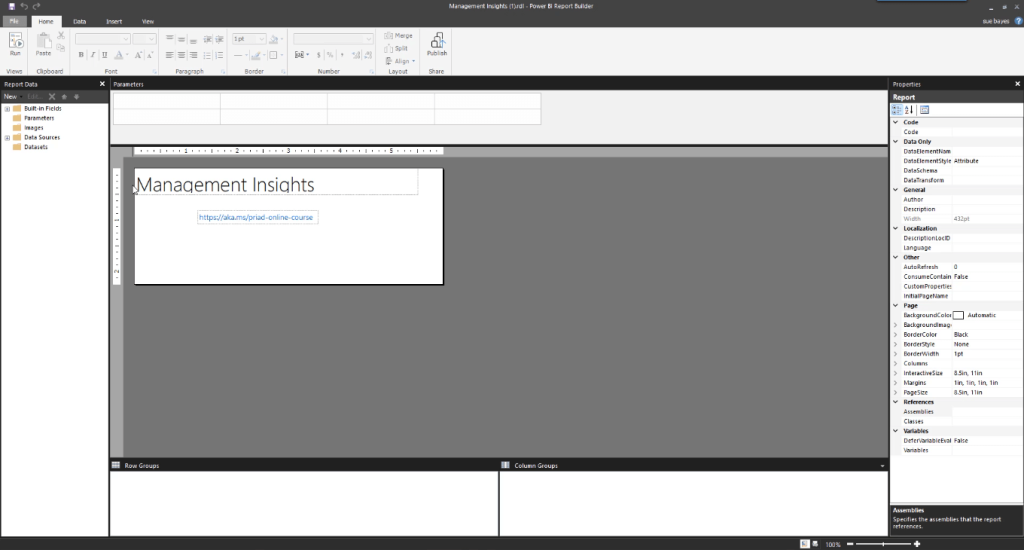
You’ll notice that the file is in .rdl format. RDL stands for report definition language. A paginated report is derived from SQL Server Reporting Services (SSRS) Report Builder.
A useful tip to know is if you want to access more information about paginated reports, search instead for SRSS Report Builder.
A paginated report is a relatively new concept and is often only used within the Power BI community. So by searching for SRSS Report Builder, you’ll retrieve a lot more information.
***** Related Links *****
Power BI Automation With Elgato Stream Deck
Custom Visual Reports In Power BI
Make An HTTP Request In Power Automate

Conclusion
A paginated report is a useful tool when creating printable reports in Power BI. It’s more often known as Report Builder. But within Power BI, the term “paginated reports” is more often used.
It’s a very useful tool for your business. With a few clicks, you can easily convert your Power BI reports into a wide array of formats, such as PDF, Excel, and Word without losing any information.
Sue


