
In this tutorial, you’ll learn how to properly create and set up the data model for inventory management dashboards in Power BI.
Before you start working on the DAX formulas and visualizations, make sure to check if your data model is correct. If it isn’t, your DAX formulas aren’t going to work and your visualizations are going to fall over.

Setting Up The Tables In The Data Model
There’s a few intricacies in this model. It has 2 Fact tables: the Sales Data table and the Inventory table.
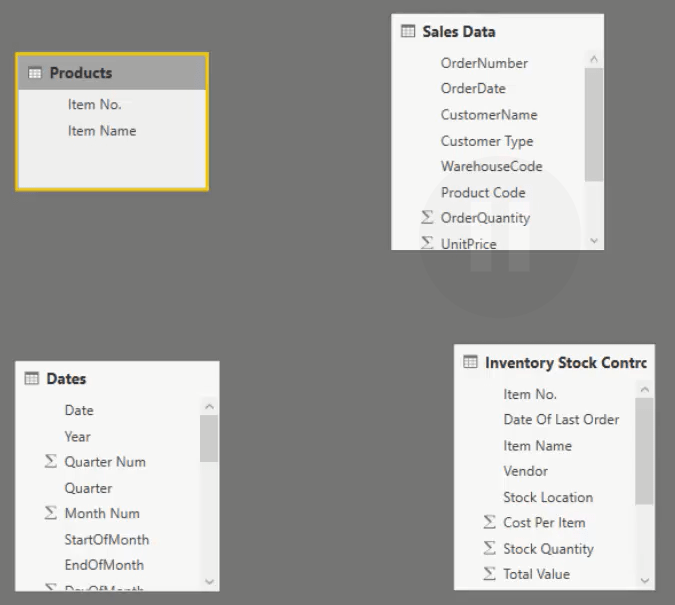
These tables have 2 different time frames. The Sales Data table has historical information and the Inventory Stock Control table is a timestamp. Your inventory system will give you how much inventory you have at the end of every week.
You need to compare those two because there are a lot of things that you need to manage in terms of your stock and what’s actually selling.
If you have poor sales for specific products, you have to make sure that you don’t over supply. But if you have good sales, then you have to make sure that you have enough stock to fulfil the demand. You also need to give yourself time to order the products before the sales overtake your stocks.
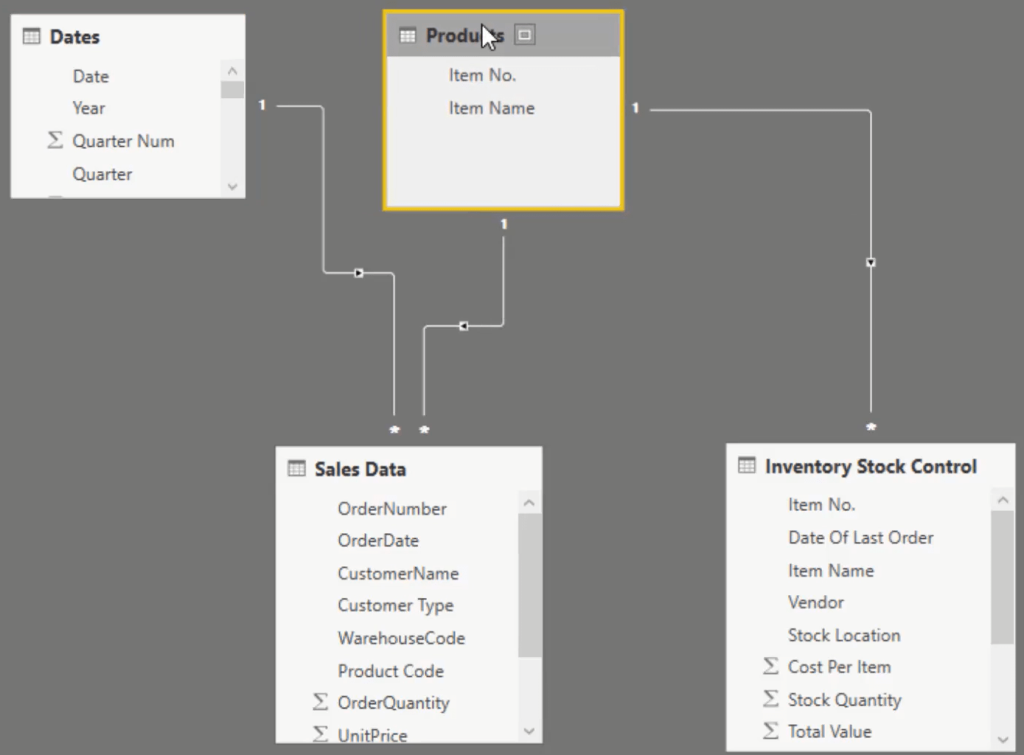
Now, set up the data model in Power BI the way you’ve been taught in previous tutorials. Put the Lookup tables at the top and the Fact tables at the bottom.
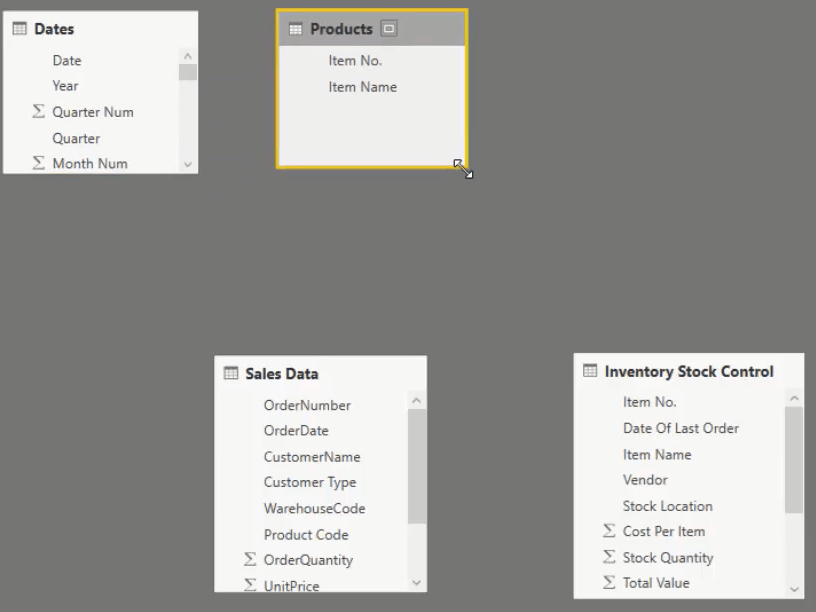
Then, form relationships with the dimensions inside the Lookup table and the Fact table.
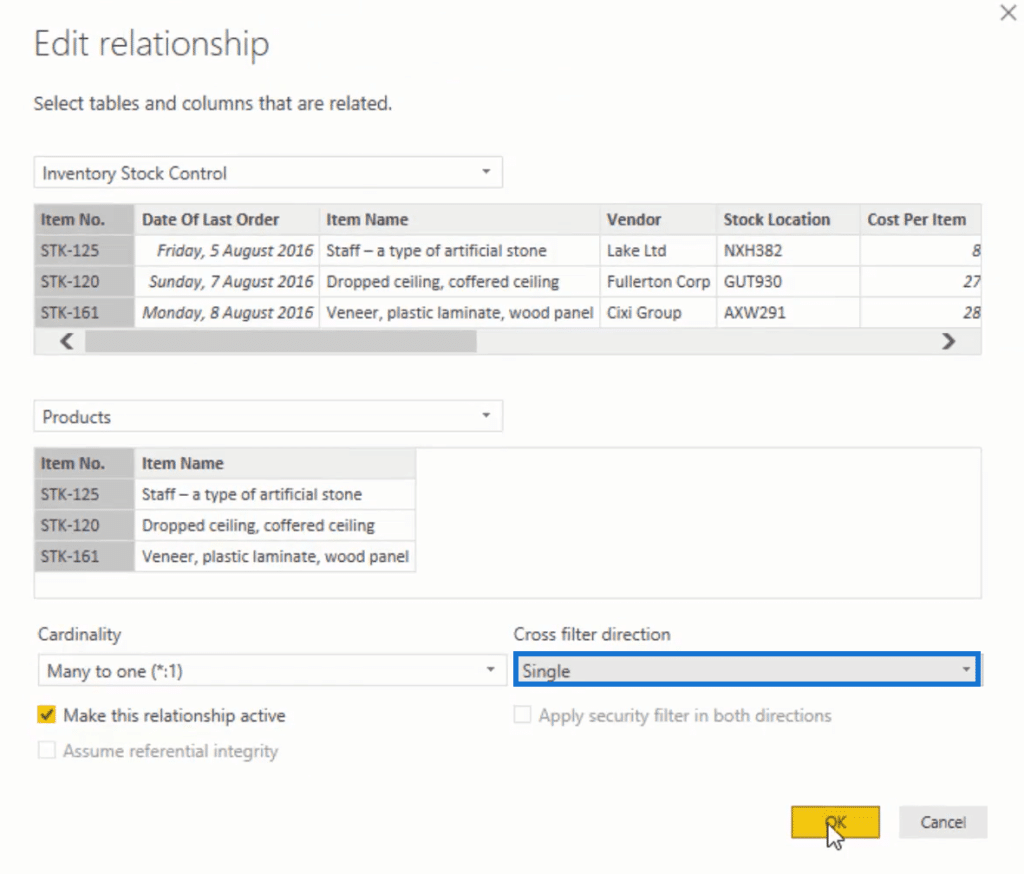
Join the Item No in the Products table with Product Code in the Sales Data table and Item No in the Inventory Stock Control table.

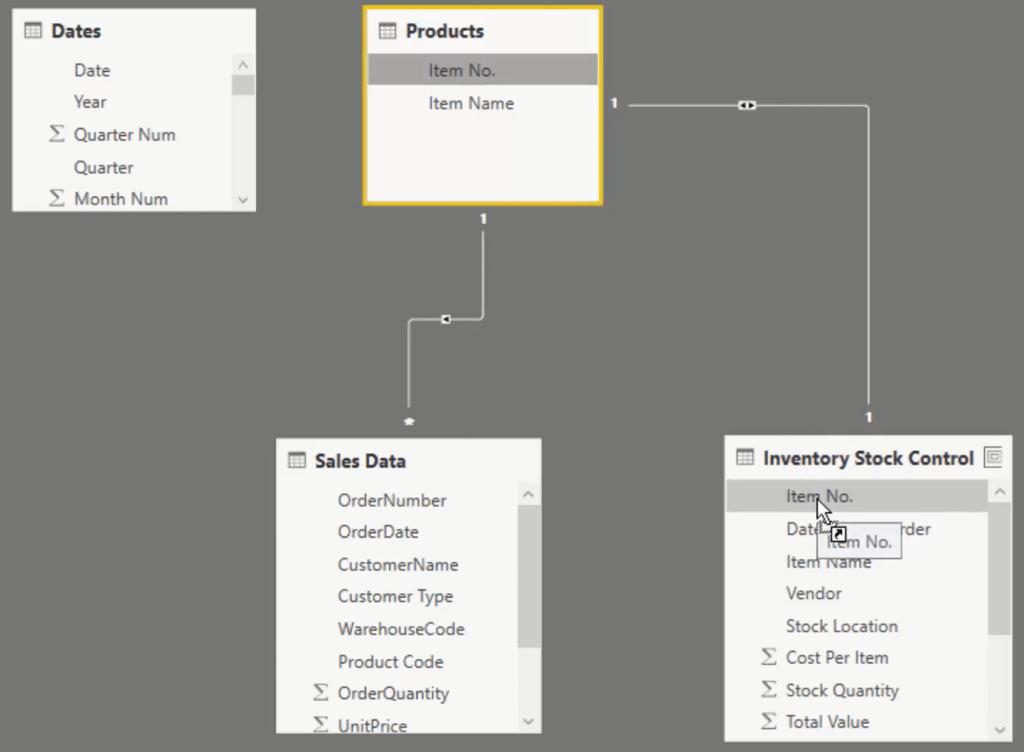
The problem now is that it created a multi-dimensional relationship which is undesirable.
Get rid of it by clicking the relationship in Products table and then change the Cardinality to One to many because this product table has only one item per row.
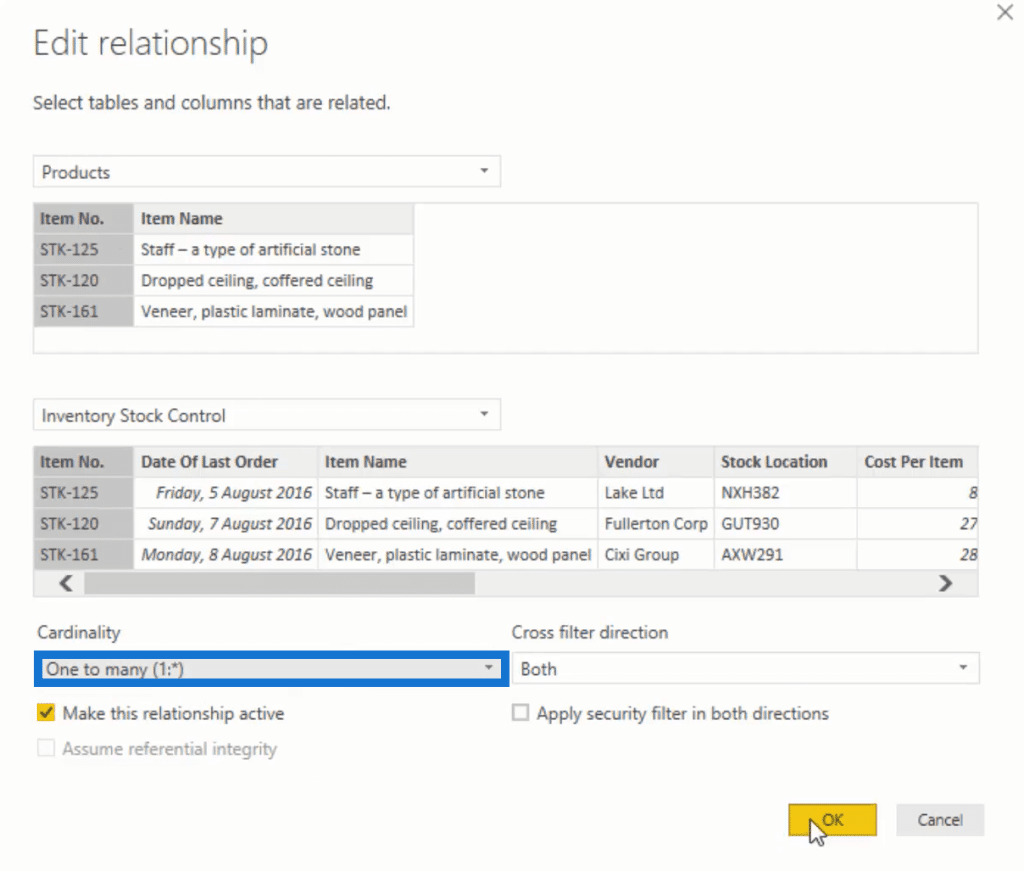
For the relationship in the Inventory Stock Control table, change the Cross filter direction to Single.
Next, bring Date in the Dates table to Order Date in the Sales Data table.
You can also easily create tables using the table feature.
Creating A Centralized Lookup
There’s a dimension in both of the Fact tables that you need to extract to make it a lookup table. For the Sales Data table, it’s the Warehouse Code; for the Inventory table, it’s the Stock Location.
Go to Modeling and then New Table. Name the table Warehouse Codes, use the DISTINCT function, and then place the WarehouseCode dimension inside.

If you go back to your model, you’ll see that you now have this new table. That’s a quick way to create a table instead of doing it in the query editor.
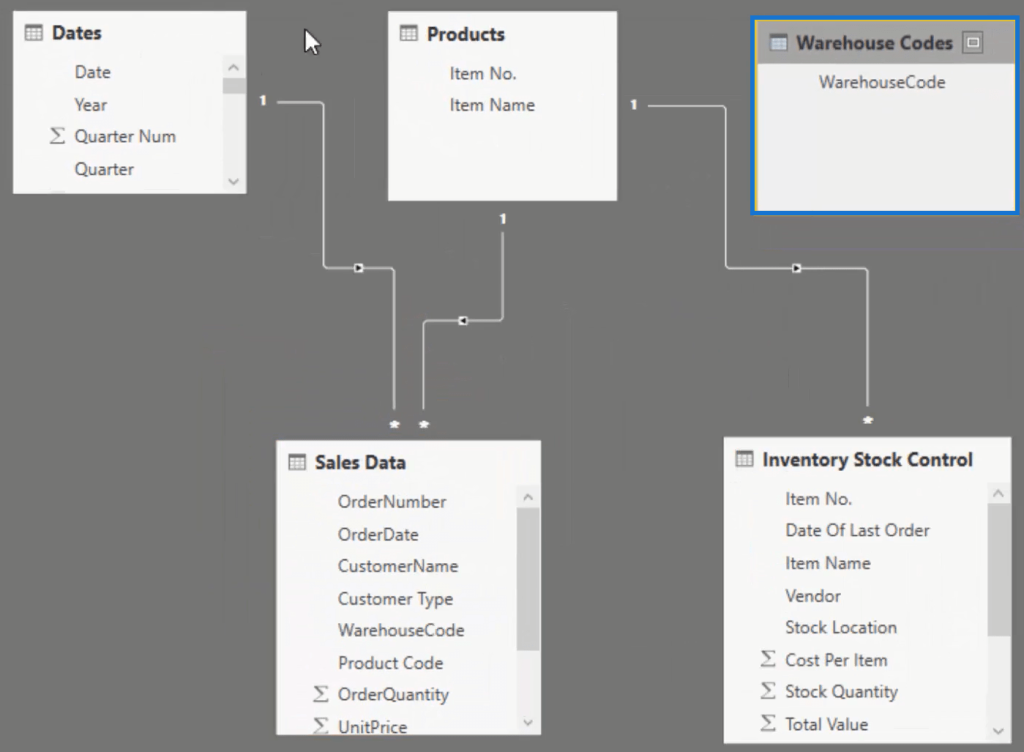
Now, drag WarehouseCode to Sales Data and the Inventory tables’ WarehouseCode and Stock Location, respectively, to form a relationship.
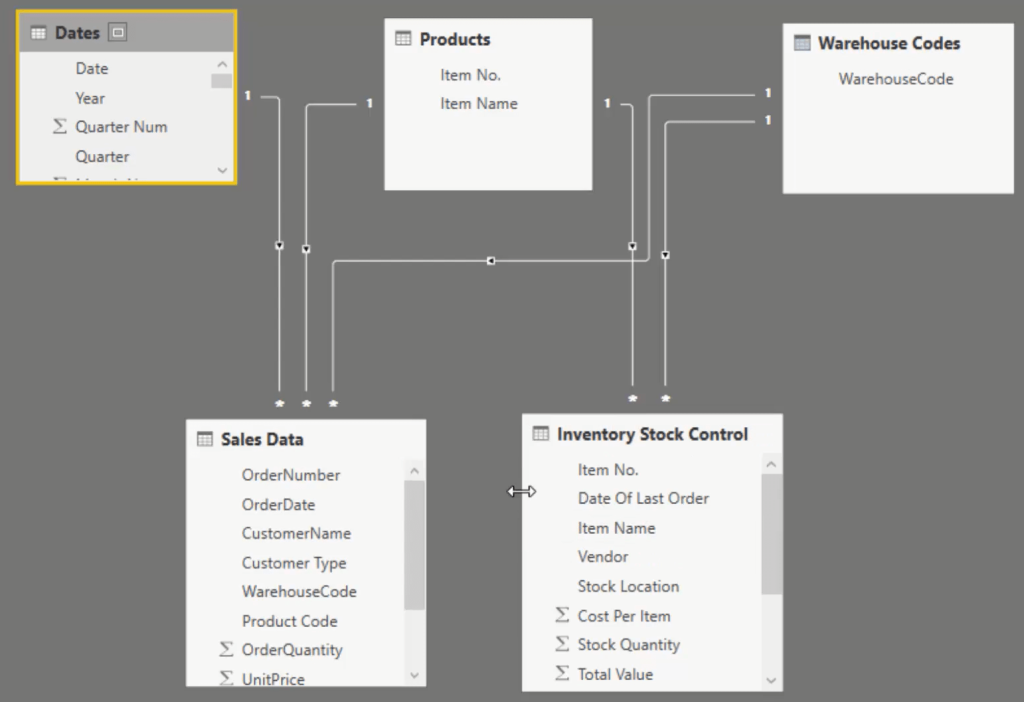
You should never make relationships between Fact tables. That’s why you should create a centralized Lookup table, like the Warehouse Codes table, to filter both of them.
The Products and Warehouse Codes are the two key dimensions in your report because they filter your Fact tables.
***** Related Links *****
Inventory Management Reports To Show Trends In Sales
Calculate Days Of Zero Stock – Power BI Inventory Management Insights
Inventory Management Insights With Power BI: Comparing Stock To Sales
Conclusion
Sorting out the data model is the top priority when it comes to creating an inventory management dashboard.
If you don’t properly set this up, it’s going to adversely affect all the other elements in your report. You might end up having to start again from scratch.
A good data model is the best foundation for any report and dashboard in Power BI.

All the best,
Sam


