
This Enterprise DNA Power BI Showcase focuses on Inventory Management. You may watch the full video of this tutorial at the bottom of this blog.
If you’re an organization which sells products through a range of different warehouses, you need to effectively manage your inventory.
Aside from managing the cash held up in your inventory, you also need to make sure that you’re stocked well enough to anticipate the trends in Sales from your retail outlets or sales representatives.

This Power BI Showcase talks about managing your inventory to identify real-time based insights.
Inventory Overview
In this Inventory Overview report, you’re looking at Inventory value by product.

You can navigate where the stock is held and work through the different inventory values.
If you make a selection in the Inventory Value by Item Name chart, you can see a dynamic change in the other visuals.

You can see information on the Inventory value for each warehouse and vendor.

There’s also key information shown in the visualization located at the left side of the report page.

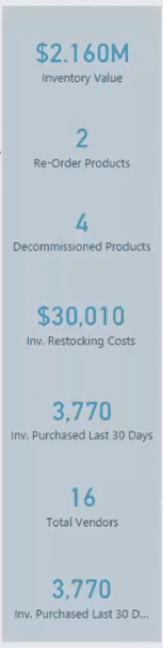
It shows the number of re-order products. You can see which products are below the thresholds for reordering. These thresholds may vary across different product ranges based on the speed by which the orders are fulfilled.
These re-order calculations enable you to understand which products to order at a certain period so that it’s in stock whenever a possible Sale is forecasted.
Sales Performance
This report page analyzes Sales Performance.

It’s showing a variety of information which you can use to analyze your Sales performance over time.
This is an important insight because it helps you understand how a product is selling. The data in this report allows you to see if you’re stocking enough or over-stocking based on the Sales trends.
By clicking a specific Item Name, you can see its detailed Sales trend and performance.
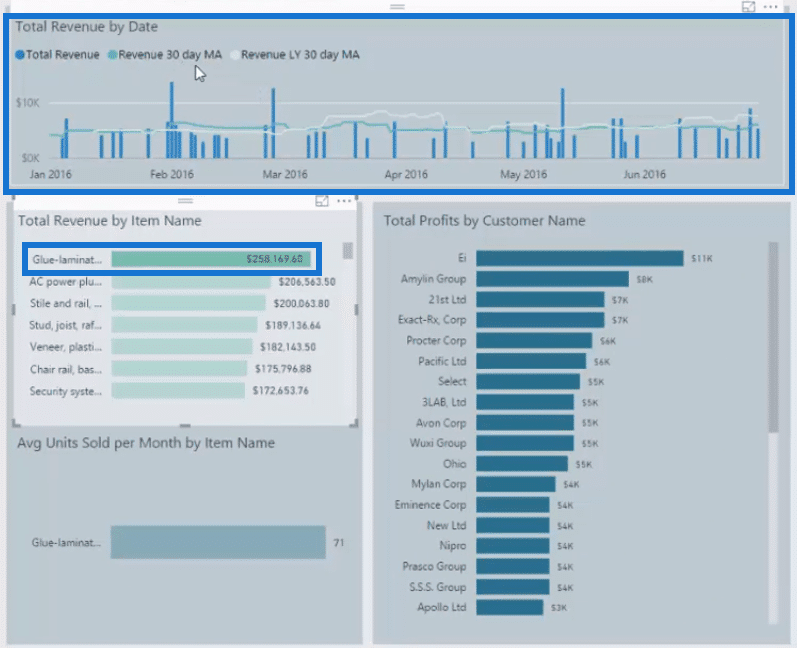
You can also see the Revenue per day which can be used to make comparisons on the current and last year’s Sales or Budget.
This visualization allows you to look at what your customers are buying and at what frequency.
It helps you determine whether they’re buying the same amount as last year.
Inventory Insights
Let’s move on to insights on Inventory Value and Revenue.

This report allows you to see your Total Inventory Value versus Total Revenue for each product you’re selling.
In this case, the worst performing products are taking up too much of your inventory cost without adding enough value to your business.
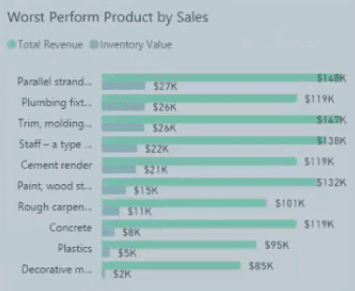
This insight gives you an idea of the strategies to use to solve this problem. One solution is to sell these products at discounted prices.
On a quantity basis, you can see how much space has been taken up by poor performing product lines. So, you need to focus on how to move them from stock to sale.
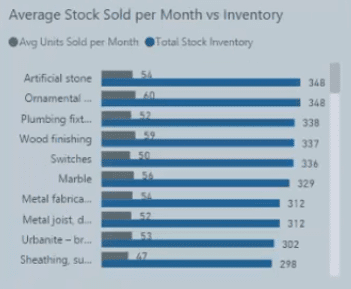
This chart provides analysis on each individual product. It’s showing Total Stock Sales versus Total Inventory On Hold.


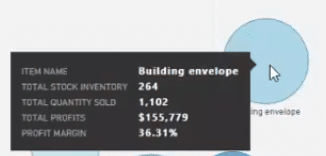
You can drill into each specific product and see more information by hovering over a data in the chart.
Warehouse Inventory Stocktake
By clicking on any grouping or item in this report, you can see where it’s being held in your warehouse.

You can click multiple items and see information in terms of Vendor, Item Name, Total Stock Inventory, Reorder Quantity, Total Inventory Value, Average Days per Order, and Vendor Lead Time.

By getting real-time information, you can identify the exact position of your inventory at any point in time.
You don’t want an employee to manually count everything in the warehouse every day of the week just to make sure that you have enough stock.
***** Related Links *****
Inventory Management Insights With Power BI: Comparing Stock To Sales
Forecasting Product Demand Using Power BI Analysis Techniques
Power BI Mobile Reporting Tips And Techniques
Conclusion
This concludes the Inventory Management Power BI Showcase by Enterprise DNA.
There’s a huge amount of information captured in these four reports which can be used to generate valuable insights for your business. It helps create strategies that improve the efficiency of your warehouses and increase your revenue per product.
If you want to review more Power BI Showcases, you can click on the links below.
All the best,
Sam


