
I’m going to go over a unique piece of analysis here concerning Power BI Inventory Management. You may watch the full video of this tutorial at the bottom of this blog.
This idea came from a query on the Enterprise DNA support forum. The member wanted to work out how many days there were when the inventory was at zero. This is going to be based on stock movement data.

Sample Data Visualization
Let’s start off with a visualization of the sample data given, as shown below.

You’ll see that the graph shows the stock levels over a given period of time. A lot of SAP systems actually show data like this where you can see actual stock movement.
You can see whether the stocks increased by 20 at a certain point, or decreased by 3, and so on. You can see that here on the Quantity column.
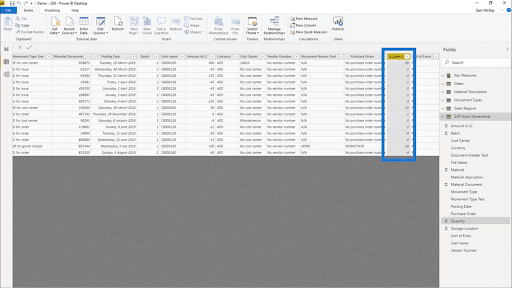
The materials are also divided into specific groups for clarity. It makes it more efficient to find out which specific products or materials are moving.

When stock changes happen, you also need a date associated with that. This tells you when a specific stock showed movement.
The same thing is done when there is additional inventory coming in. Each activity is associated to the date when it happened or when it was posted.

Model Showing Required Data
From those specific groups of data, this simple model is generated. It shows every movement required to get the results you need.


With this information, we can create a Cumulative Total of our stock level at any given point in time. From there, we can count up the days when there was zero inventory.
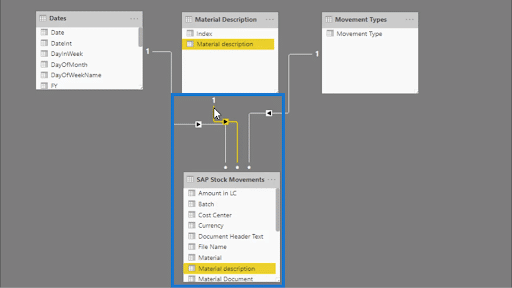
Let’s apply some context here. We’re counting up the days; this means that we would need specific dates.

As mentioned earlier, the materials are also divided into separate groups. This tells us which specific stocks are moving. We see that here.

As for the calculations, they will all happen in the table below.

The demo model is not that long and complicated, but it shows all the movement you need.
Now, let’s see what these look like on our table. You just need a simple SUM on the stock changes and the quantity.

That calculation will show up on the Quantity column.

We’re also going to add some filters here. I’ll show the formula used for the filter later on, but this is what our filter looks like.

You’ll see that we only have one specific material chosen at the moment. This is why you also see the same type of material listed on the Material Description column.
Of course, we have a slicer that allows us to specify the time period for the data we’re getting as a result.

When you look at the table, you can now see that on this specific date, we had minus 1, which means that one stock was probably sold.

Each time there’s a change in number, you’ll see the visualization changing as well. So in this case, that 1 piece of stock sold can be seen in this drop on the chart.

Aside from products sold, you can also see that on a certain day, 15 pieces of stocks came in.

Counting Up The Total Days With Zero Stocks
The technique that I used here is very similar to the usual way you would do a Cumulative Total.

When this Cumulative Total is created, it’s going to be mirrored in your visualization. We’re looking for days where the inventory is at zero, which you’ll see in the dips on your chart.


Here, you’ll see that on a specific day, 13 stocks were moved out of the inventory, causing you to have zero stocks. So all we need to do is find similar days like this, then find out how many of those days there are in total.
This result is going to be shown here, labelled as Days Out Of Stock.

To start getting that number, we need to build a virtual table that’s going to show the three columns containing the data we need.

That virtual table is built using this part of the formula.

Let’s discuss that formula piece by piece.
I started off with ADDCOLUMNS, then I used CROSSJOIN to make sure that each specific date and material is represented.

So let’s say a specific kind of material was moved on a specific day. This part of the formula makes sure that all the dates within the time period are listed, including the date when the movement occurred.

On the other hand, it’s this part of the formula that creates a list of all possible types of materials. This ensures that when that movement happens, the table accounts for that specific stock.

Once the dates and stocks are added into the table using CROSSJOIN, you can now create a new column that shows the Cumulative Total, as shown in this part of the formula shown below.

Now, remember that you’re only counting the zeros here. But what about the blank spaces on our Totals?
That’s what this part of the formula is for.

You’ll see that we’re looking for columns with zero in it. At the same time, we’re also excluding rows that are BLANK.
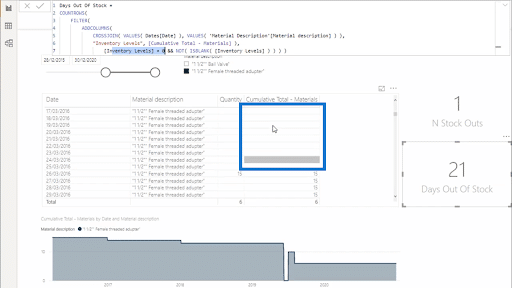
These blank rows are there because that specific kind of stock may not have been part of the inventory just yet during that specific time. In the table above, you’ll see that the blank spaces come before 15 pieces of that specific stock was added. This means that this delivery of 15 stocks might have been the first time for them to have that kind of product.
Once the formula is applied, you’ll get that number you need. That’s definitely much better than scrolling through the rows one by one, tallying how many of them would show zeroes.

***** Related Links *****
Inventory Management Insights with Power BI: Comparing Stock To Sales
Power BI Mobile Reporting Tips and Techniques
The Importance Of Creating Compelling Power BI Visualizations
Conclusion
So once again, we’ve solved another problem by building a virtual table. This time, the approach is applied as a Power BI inventory management technique. That virtual table gave us the exact result we needed, which was the total number of days when there was zero inventory.
Hopefully, you can find some use for this unique concept inside Power BI.
All the best,
Sam


