In this tutorial, you’ll learn how to create measures in Power BI using Tabular Editor 3. You’ll also learn how to load the measures into the Power BI Desktop and create visualizations. The IntelliSense feature of the Tabular Editor will also be shown and discussed.
Create Measures In Power BI
To create a measure, right-click on a table and select Create. Then, choose Measure.

In this example, the Sales table is used to create a measure. You can open the Sales table to see which column can be used in the measure. Right-click on the Sales table and select Preview Data.

Place the Sales table on the right side of the screen. Your workspace will then look like this.
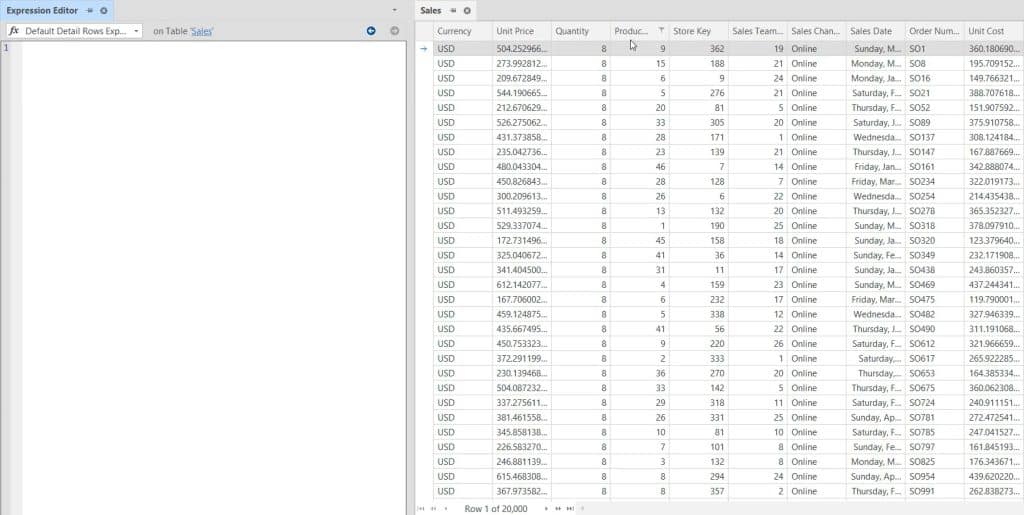
For the measure, the Unit Price, Quantity, and Unit Cost columns will be used. These columns can be used in functions like SUMX, MINX, MAXX, among others. The remaining columns can be used in functions like COUNTROWS and DISTINCTCOUNTNOBLANK.
Maximize The IntelliSense Feature
If you input a keyword of a function in the Expression Editor, a suggestion box will appear. The box contains all functions with the given keyword. In this example, you’ll see the functions that are related to the keyword SUM.

If you write the initials of a table or column, Tabular Editor will find the table or column that matches the initials. In this example, you can see that the Sales[Unit Price] is suggested using the keyword SUP.

For this measure, use the SUMX function to get the Total Sales. If you input SUMX, an open and close parenthesis appears. You can also see a suggestion box about the function being used.

The box shows that the function is an iterator. It also informs you that the first and second arguments to be used should be a table and an expression, respectively.
The table used for the first argument is the Sales Table. For the second argument, Quantity is multiplied by the Unit Price.

Change the name of the measure to Total Sales.

Now, if you go back to Power BI and open the Sales table, you can see that the Total Sales measure doesn’t exist.
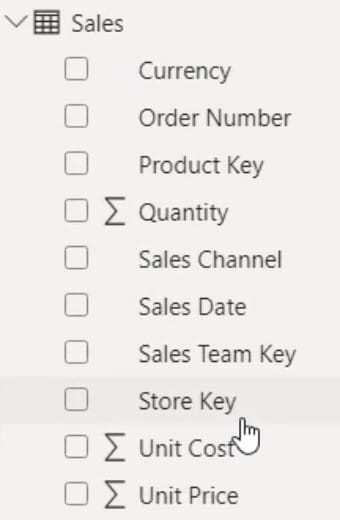
Load Measures In Power BI
To load the measure inside Power BI, go back to the Tabular Editor and press CTRL + S. After doing so, the measure will now be deployed in Power BI.
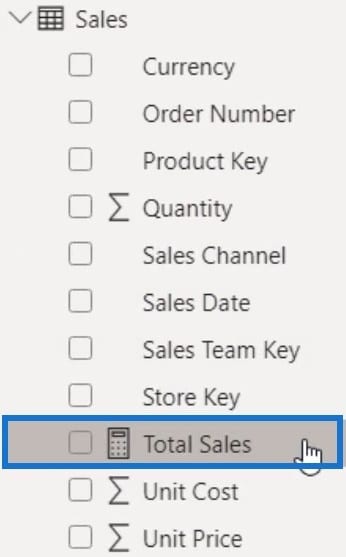
Create A Visualization
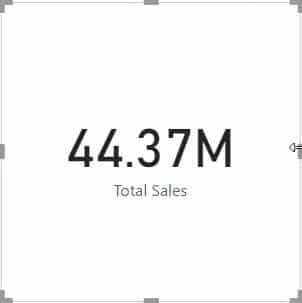
Following that, drag the measure into the report view and turn it into a card visualization.
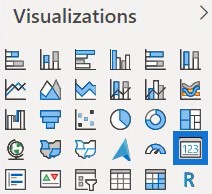
You can then see the Total Sales of the table.
Create Measures For Total Cost and Total Profit
For the next measure, use the SUMX function again and input the Sales table as the first argument. For the second argument, Quantity is multiplied by the Unit Cost.

Then, name the measure Total Cost. Once done, press CTRL + S to load the measure inside Power BI.
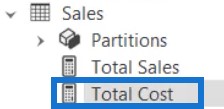
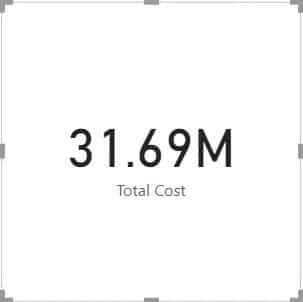
Next, drag the measure into the report view and turn it into a card visualization. You can then see the Total Cost.
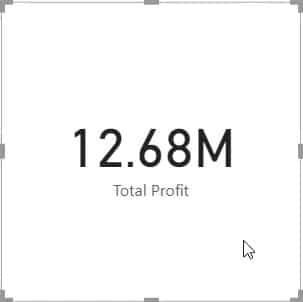
Now, create another measure that subtracts the Total Cost from the total sales. Name the measure Total Profit and then press CTRL + S to load it inside Power BI.

Once done, drag the measure and turn it into a card visualization. You can then see the Total Profit of the Sales table.
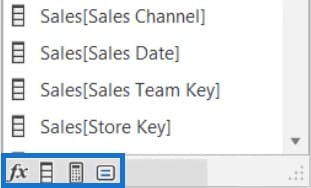
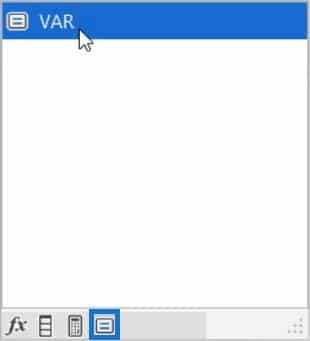
Another interesting thing inside the Tabular Editor is that when you open the Total Sales measure and make the tooltip appear on the screen, you can see four filter options at the bottom.
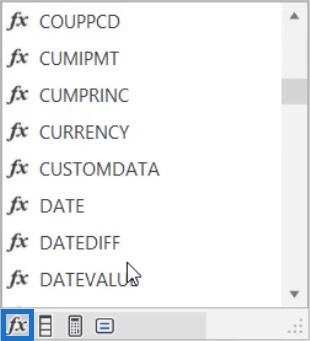
If you only select the first option, the suggestions you’ll get from the tooltip are only functions.
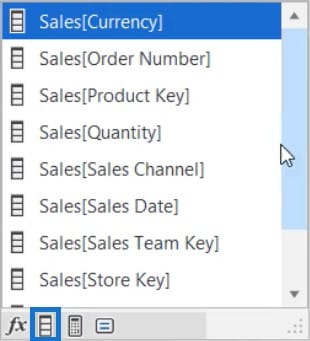
The second option only shows you the columns of the Sales table.
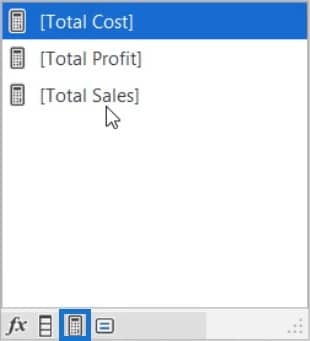
The third option shows you the measures that you can use.
And the fourth option shows you the keywords.
Tabular Editor also has the ability to pop up the IntelliSense option. If you accidentally closed the tooltip box, instead of erasing and writing the expression sign again, you can simply press CTRL and the spacebar to make it visible.
***** Related Links *****
DAX Measure Analysis: Breaking Down Long DAX Measures
Building Power BI Reports: Organizing DAX Measures & Page Development
Power BI Tabular Editor 3: Automate With A Script
Conclusion
Tabular Editor 3 lets you conveniently create measures. You can create DAX codes while opening a table or data for reference within the editor itself. It also has the IntelliSense feature to help you bring out and use functions easily.
Enterprise DNA Experts


