
Today, we’ll be talking about one of my favorite programs, the Power BI Tabular Editor 3 (TE3). Let’s delve deeper into the scripting capabilities of Tabular Editor 3 – the different ways you can generate, record, and use scripts within it to automate and simplify repetitive tasks within Power BI. You can watch the full video of this tutorial at the bottom of this blog.
This is basically a continuation of a tutorial I did back in April, where I gave an overview of the general feature set of TE3. There are some really great functionalities in the TE3, and some things that I think you’ll find are huge time savers and ways to really customize the program to make it work best for you.
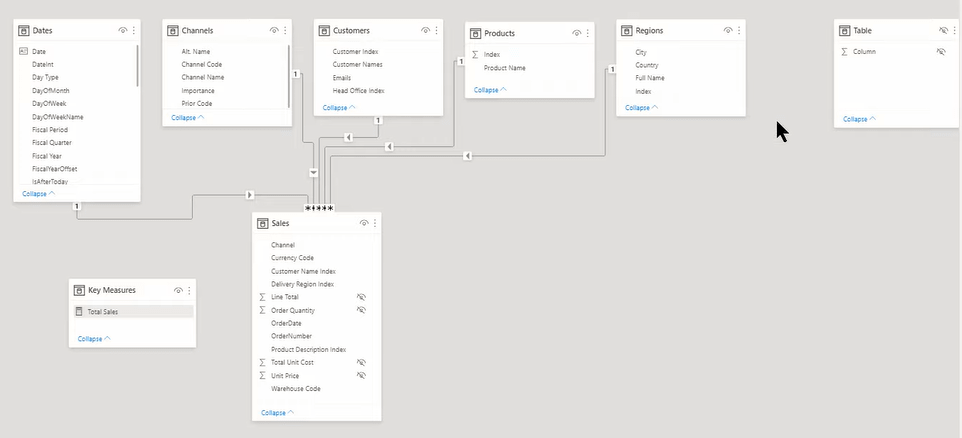
In this example, I have a simple model here, which is just the Enterprise DNA Practice Data Set, External Tool. This is a simple star scheme of practice dataset and I’ve just got it set up with one measure, but that’s going to change quickly as we kick the scripting capabilities into gear.

Power BI Tabular Editor 3 Scripting Capabilities
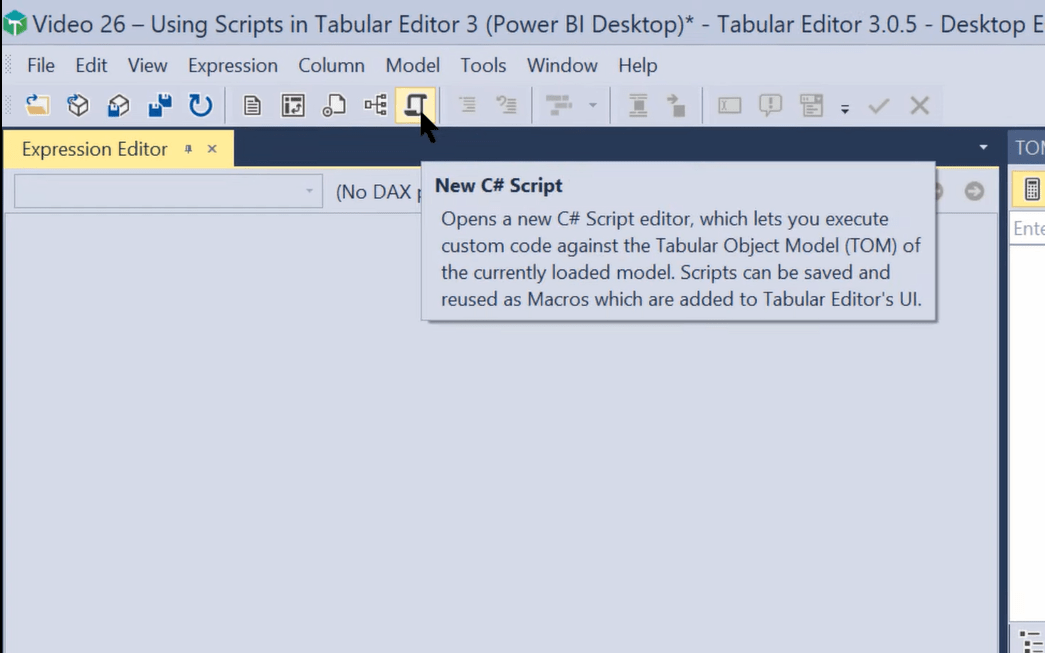
In terms of those scripting capabilities, there are four ways to bring a script into Tabular Editor. The first of which is the C#. You can just click here on New C# Script, start coding, and then save that as a Macro.
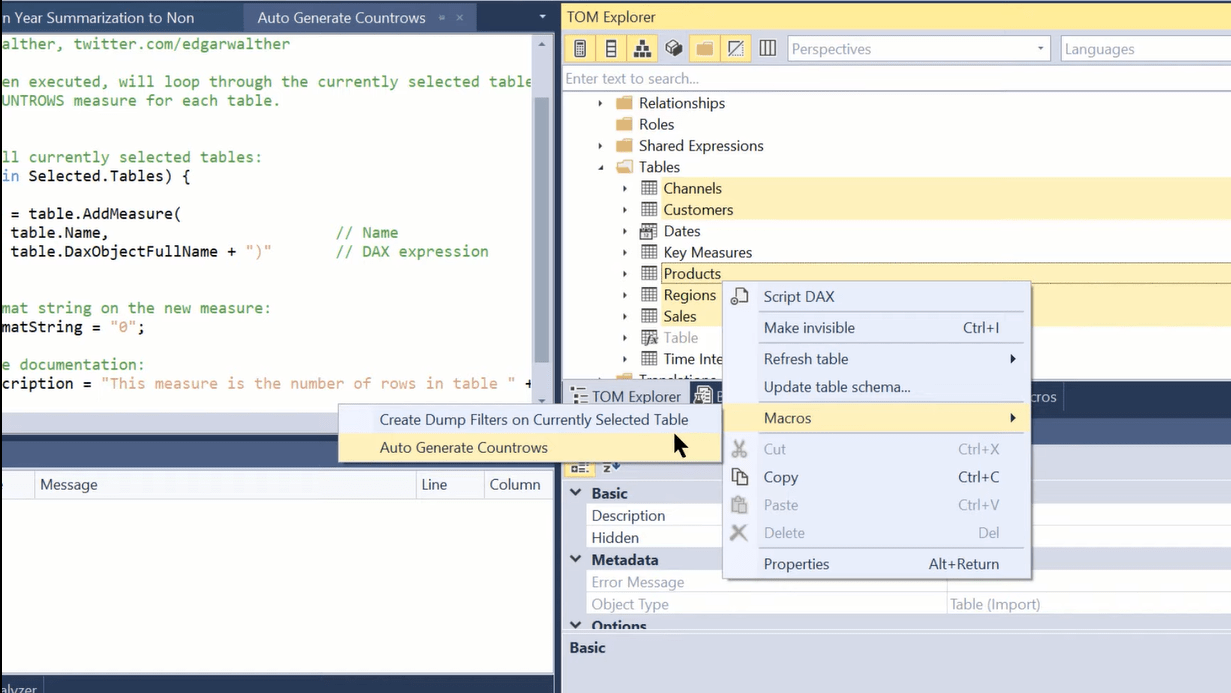
This is probably not going to be the way that most of us access the scripts. I think most of us are going to be accessing existing scripts. There is a really cool Script Record feature. It bridges the gap between some custom programming and using existing scripts.

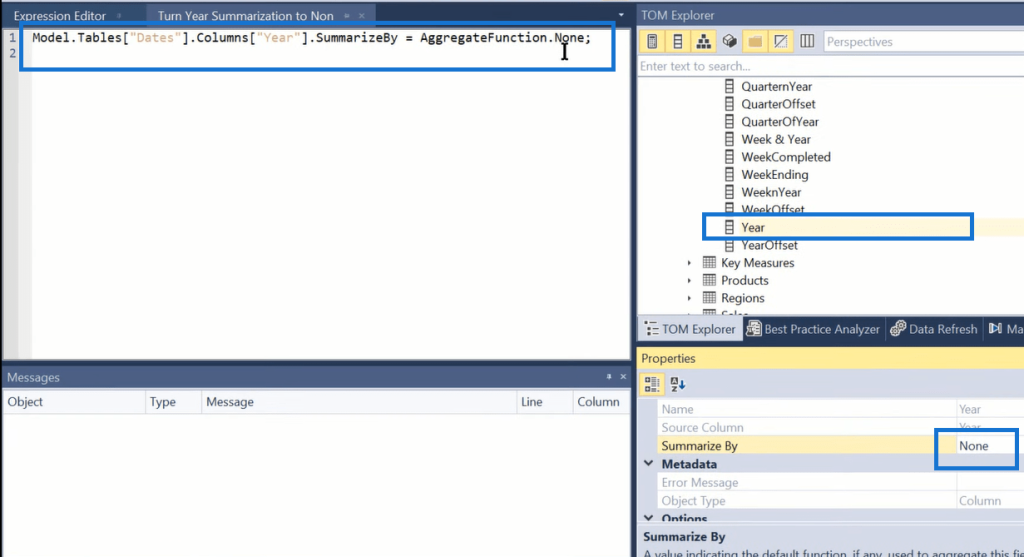
For those of you who don’t know C#, you can hit record here. Then, let’s say we want to turn off the Summarization on our Year column in our Date table. And so, you click on Year and select None; then, save that as Macro.
That’s not a super useful script, though. It’s pretty limited in its use and utility. But, it gives you the C# script code. By taking that code and combining that with the code that you find in existing scripts, you may be able to build some rudimentary scripts that actually do something quite useful even if you don’t have much programming experience.
It’s definitely worth playing with C#, but I think the more common thing to do is to use existing scripts. There are a number of repositories that are very helpful. There’s a whole library of useful script snippets in the TE3 documentation that range from the creation of measures to generation of documentation to formatting, DAX expressions, creating relationships, and a whole range of scripts that you can apply directly into your version of TE3.
Furthermore, there’s a community repository for people to provide scripts to the TE3 community. These are divided up into basic and intermediate. There are some really good, useful scripts here.

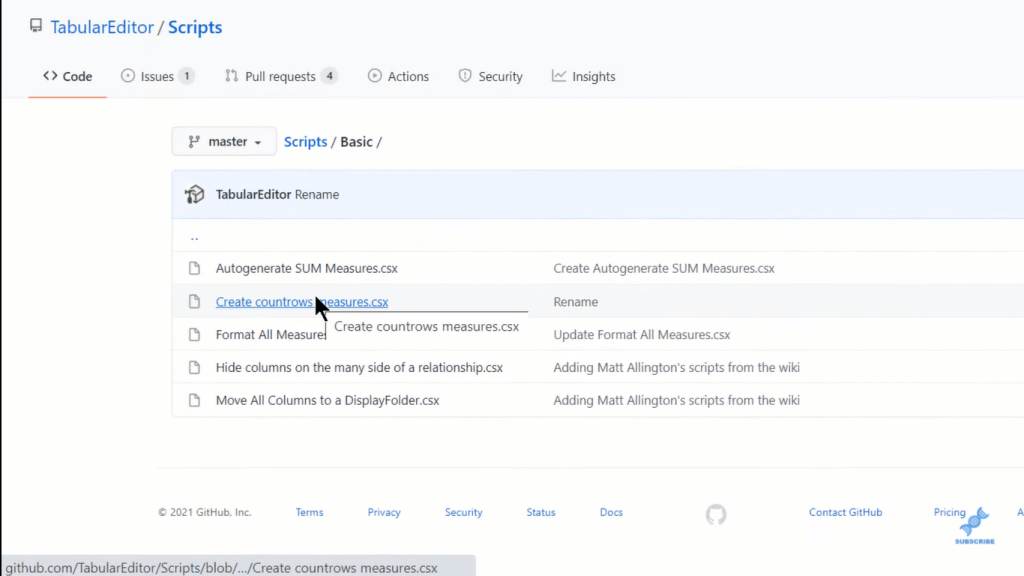
You can simply copy some measures from here and paste them into the Tabular Editor 3 and save them as Macro. With this, you can automatically create simple measures.
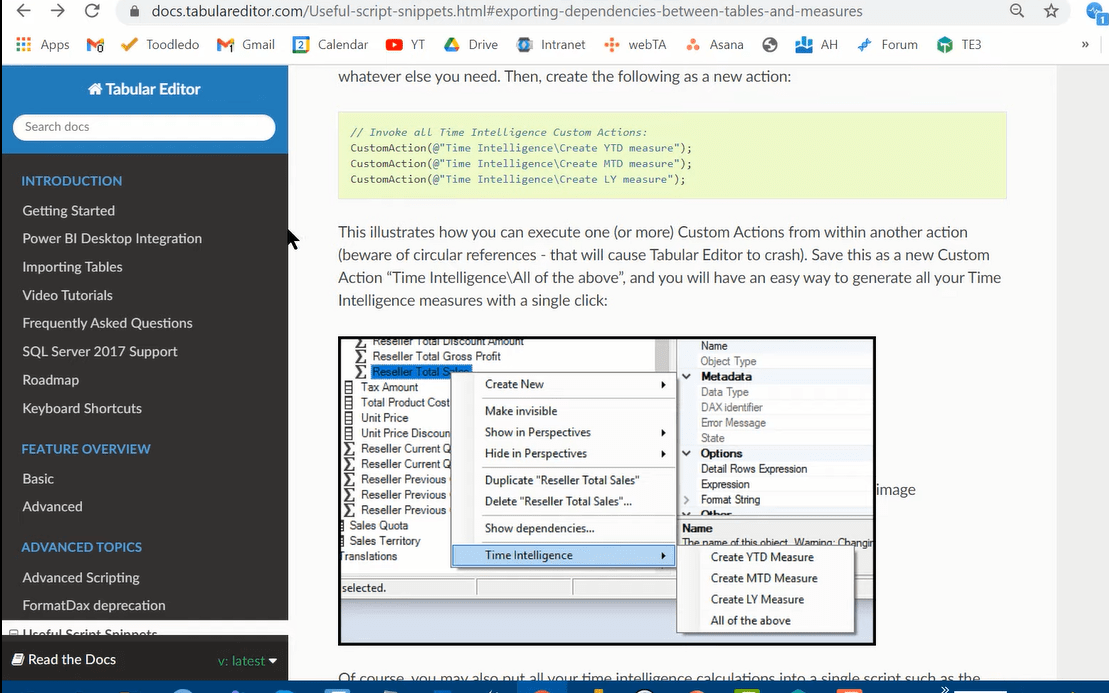
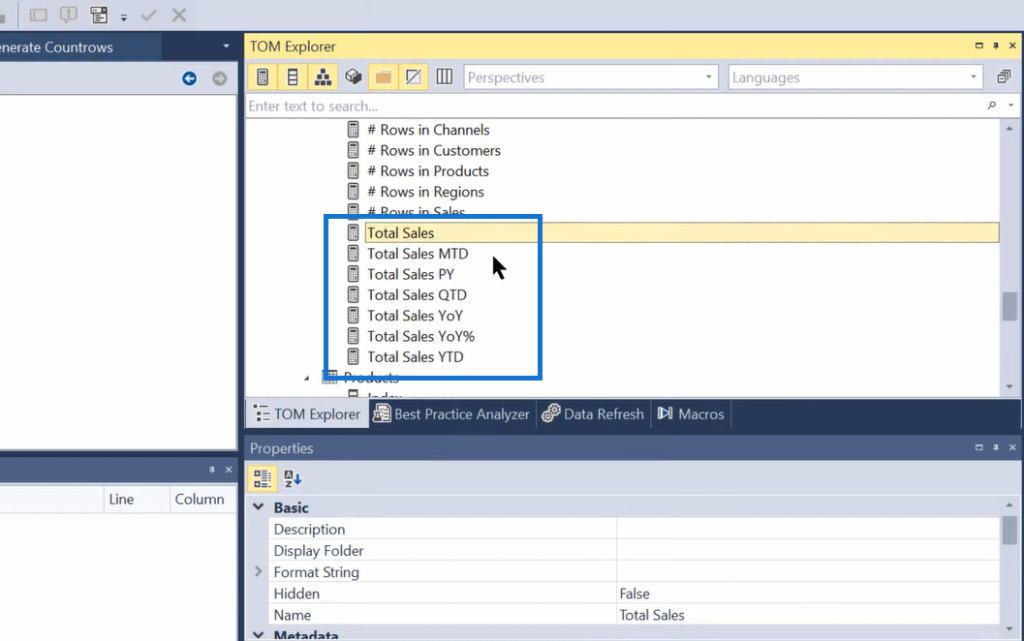
Another thing that I think is really interesting is that if we go to Total Sales and then click on it, there’s a Macro that allows us to create time intelligence measures for every selected measure.
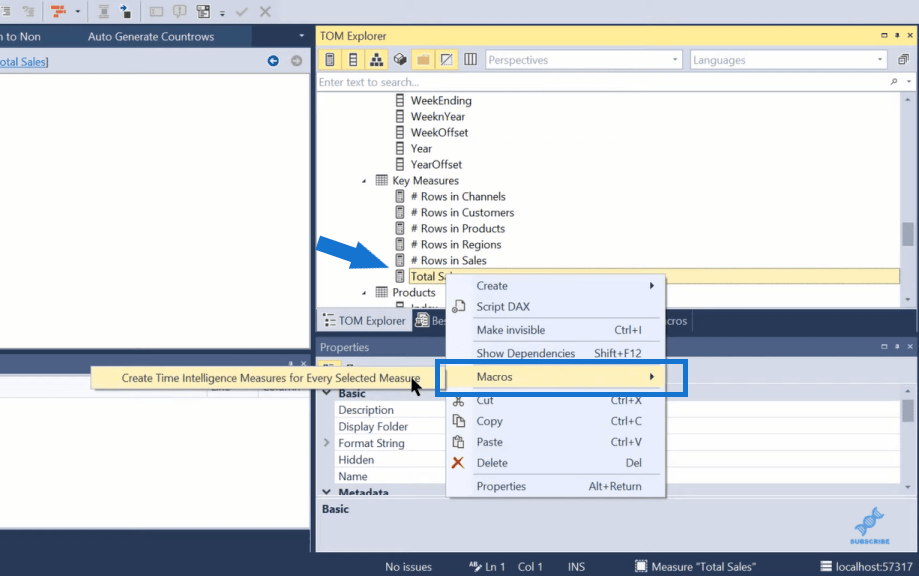
And so, if we click on that, it automatically generates month to date (MTD), previous year (PY), quarter to date (QTD), year over year (YoY), year over year percentage (YoY%), and year to date (YTD).
For those of you who are Analyst Hub users, go to Analyst Hub and search for tabular in the Raw Code application. You’ll find a whole series of scripts, where you can copy the codes directly into TE3 as well.
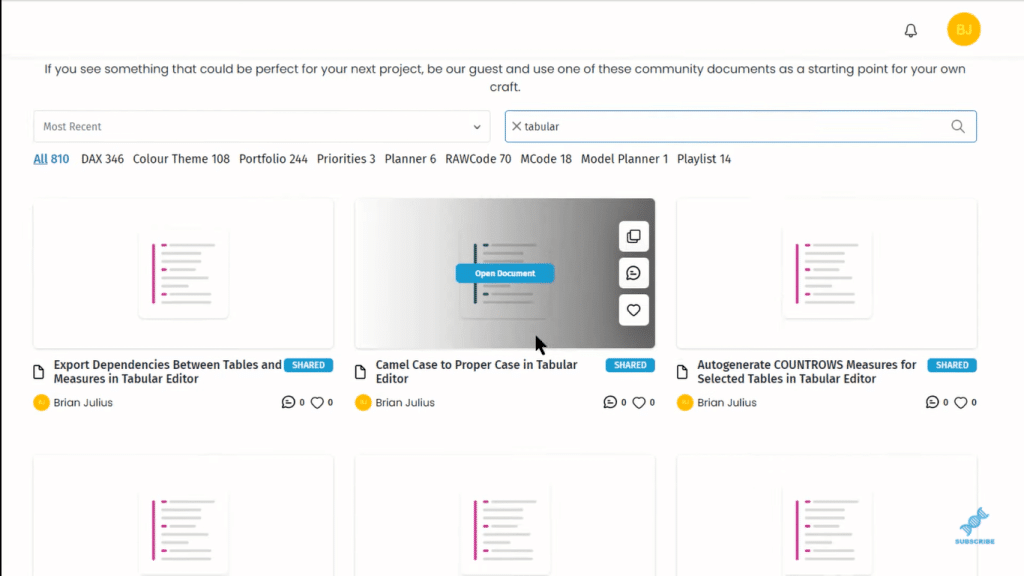
The next thing that I wanted to show you is some well-documented and well-established scripts. Let’s go to Macros and let’s take a look at Create SUM Measures as an example. This is a really interesting one. Not only does it create a measure, but it also sets a format string and provides documentation that hides a base column.
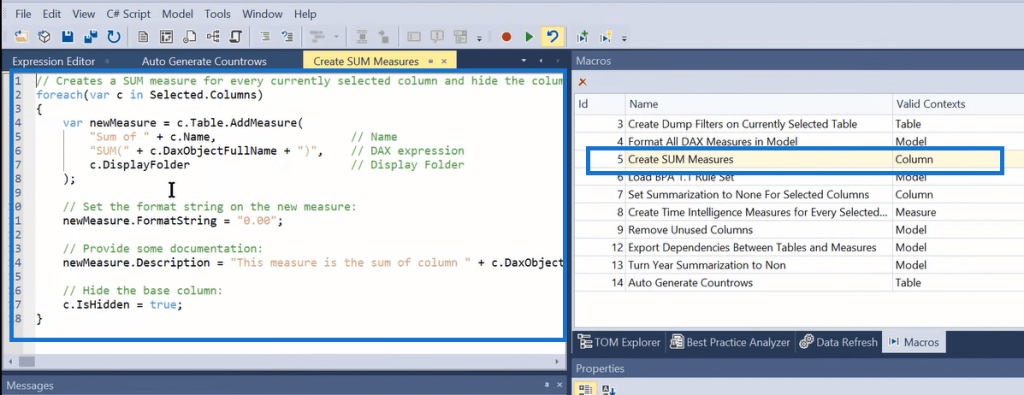
You can then copy this over and replace that SUM measure and create MAX measures or SELECTEDVALUE measures, for example.
Lastly, I want to show you the Best Practices Analyzer. Microsoft published a very comprehensive 1.1 version of the ruleset, and we’ve put that up in the Analyst Hub. You can just copy it from there and paste it into the Tabular Editor 3.
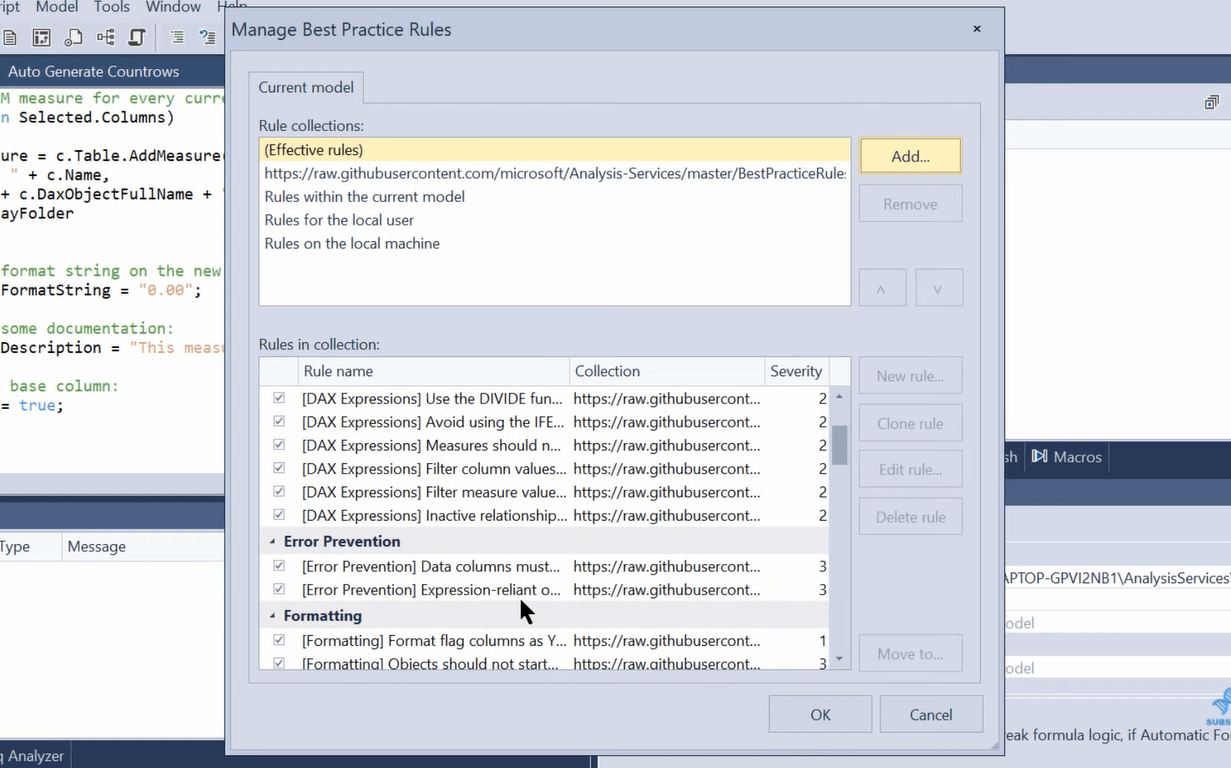
This is an amazing feature of the program, but we’ll be delving into this in more detail in another tutorial. I just wanted to show you how to load that, so you can go through and begin to play with that on your own.
***** Related Links *****
Tabular Editor Power BI: Version 3 Review & Tutorial
Use Tabular Editor To Create Calculation Groups In Power BI
Level Up Your External Tools Menu In Power BI
Conclusion
That’s the basic functionality of scripting of Tabular Editor 3. I’ve just shown you where you can go to get scripts and how you can generate them on your own. I hope you find this blog helpful. I recommend that you explore this tool more.
Let me know in the comment section below your own experience of using the Tabular Editor 3.
All the best!
Brian


