
Data Visualization Report Template With PowerPoint | Part 1
For this series, I will walk you through on how you can create a beautiful data visualization report...
For this series, I will walk you through on how you can create a beautiful data visualization report...
For today, we'll be continuing the discussion on our enhanced visualization frameworks for Power BI....
In today’s tutorial, we will be talking about the key elements of actionable reporting in Power BI...
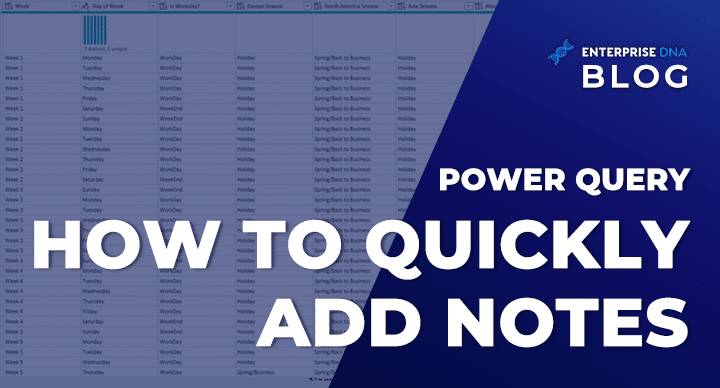
In this post, we’ll learn different ways to add notes in Power Query, which can benefit the people who...
In this tutorial, we’ll learn and understand how we can utilize a subquery in SQL. A subquery is a...
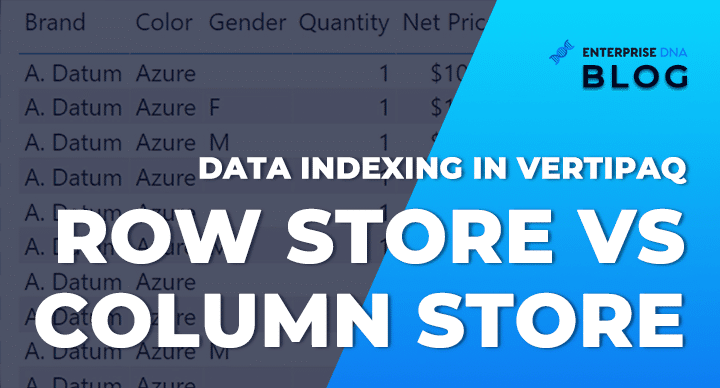
In this tutorial, we're going to cover the difference on how data indexing works in a relational...
Today, I'll talk about enhanced visualization frameworks for Power BI. This is the Analyst Hub, an...
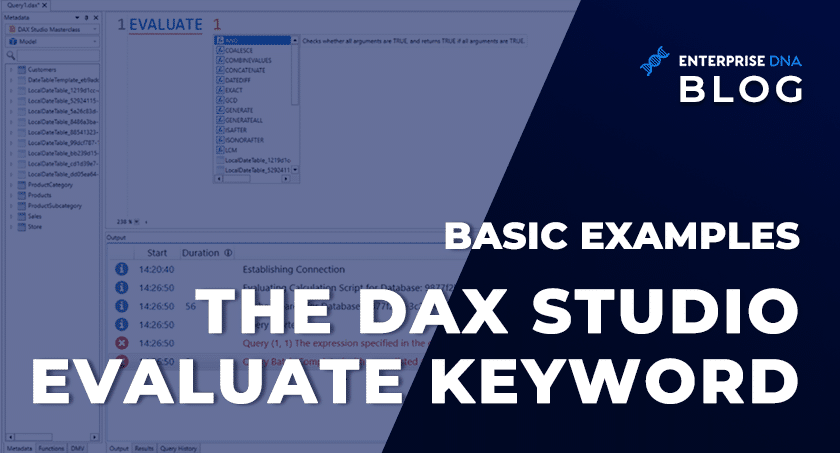
After successfully connecting DAX Studio to Power BI and learning about its user interface, the next...
MultiIndex in Pandas is a multi-level or hierarchical object that allows you to select more than...
Power BI has always proven to be such a dynamic tool for data professionals, not only because of its...
Today, we’ll have a quick introduction to IBCS, which stands for International Business Communication...
In this tutorial, we'll learn common functions that we can use in SQL. These functions can be a String...
")