
For today’s tutorial, I want to take this opportunity to showcase and appreciate some of the best Power BI report examples you’ll encounter out there that really demonstrate the great capabilities of Power BI. You can watch the full video of this tutorial at the bottom of this blog.
These reports in particular are entries into our recent Power BI Challenge 15 that works with quite a unique data set that deals with Formula 1. These are also, by far, a few of the best ones I’ve seen across all of our Power BI Challenges.

Best Power BI Reports Examples: Tooltips, Unique Visualizations, & Awesome Navigation
One of the requirements in this particular challenge was to use only one page. And so, what we found was that everyone used tooltips and they were absolutely outstanding. When you’re creating reports, think about staying high level in your initial report, but then within your tooltips, make them really detailed and comprehensive.
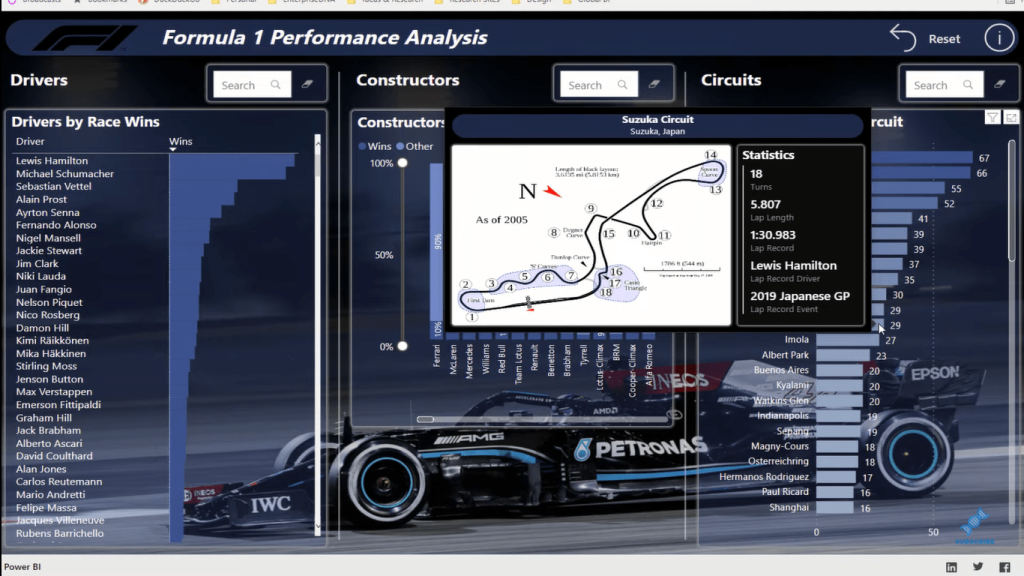
This one is from Greg, one of our Enterprise DNA experts. Within this report, you’ll see that there are so many additional insights that have been created.
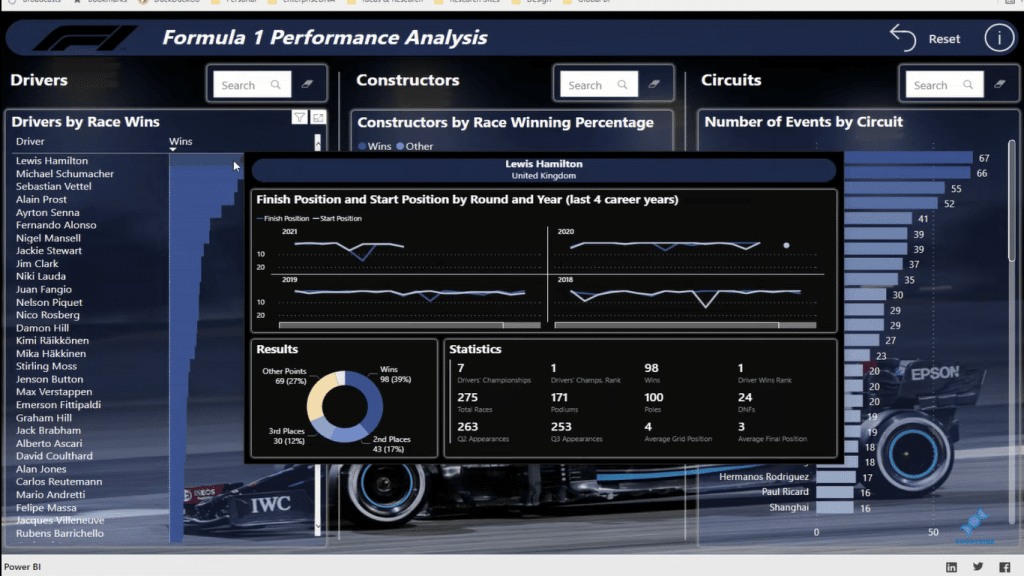
There’s one tooltip here where Greg has implemented a dynamic visualization.
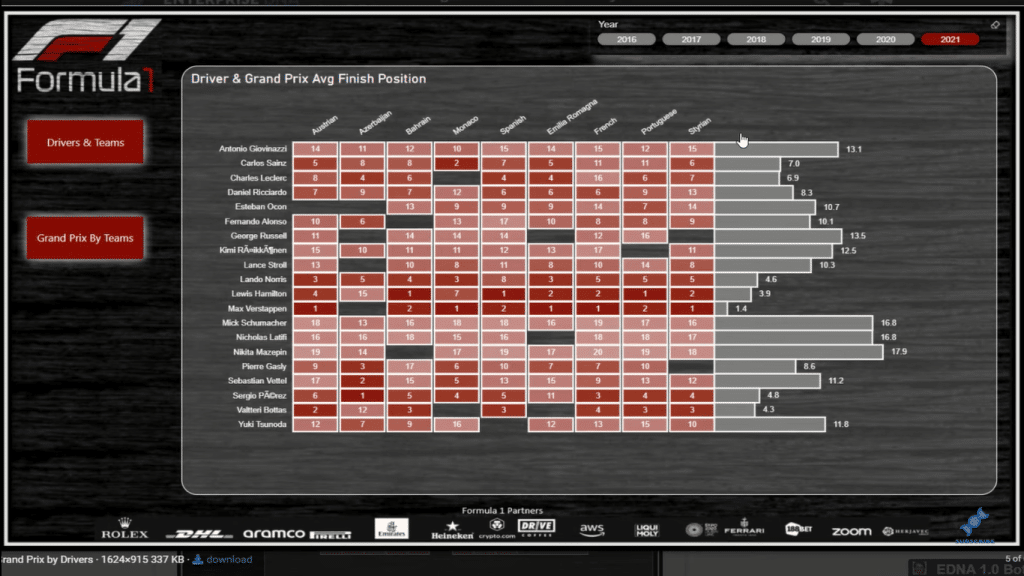
This one is from Jarrett and he used a charticulator visualization, which combines a sort of a matrix with an actual chart.
Another great submission was from Alex, an Enterprise DNA expert and probably one of the best Power BI designers in the world. In this report, he used charticulator as well; the design is absolutely phenomenal. The navigation is also fantastic. There are so many little things that have gone into this, from the way that the background is embedded into the report to the navigation features.
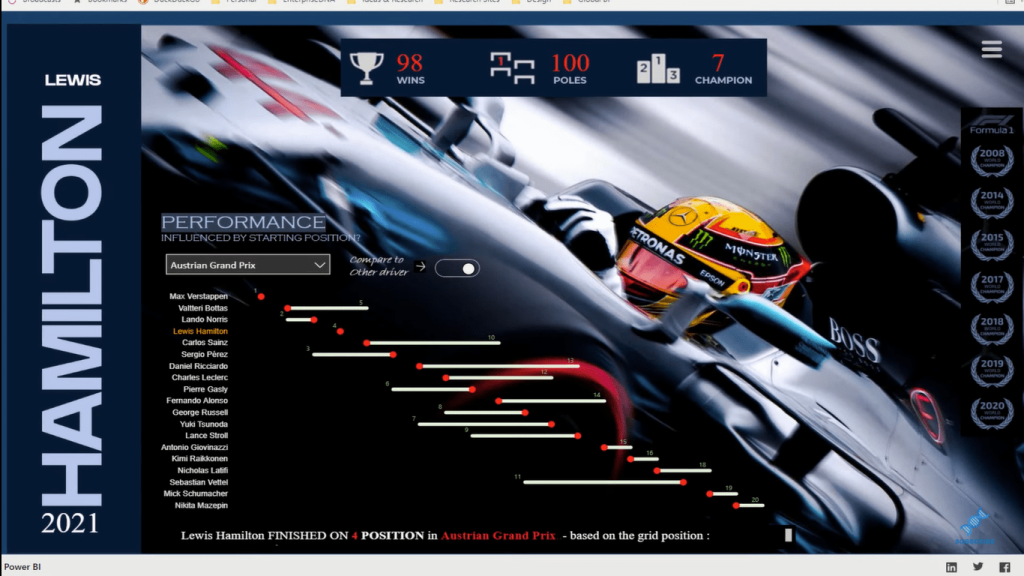
There’s a range of tooltips embedded in this report as well. Alex embedded one in a card visual. It’s quite tricky to do, but Alex did an incredible job here.
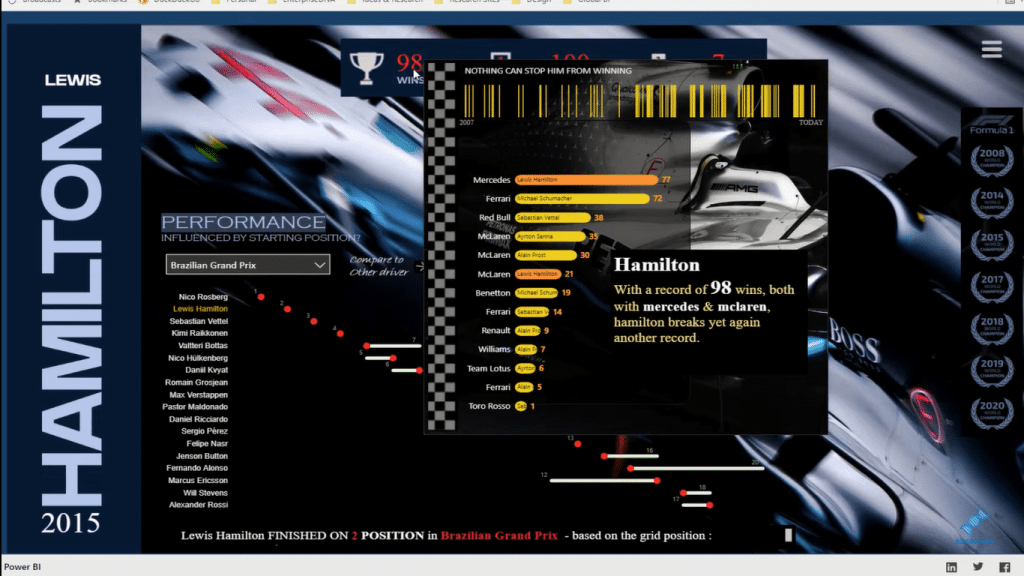
The most amazing thing here is that this is all one page within Power BI. Yes, there are other pages on the Power BI desktop that enable you to see those insights within this one page, but all of this being summarized in one page is just absolutely incredible.

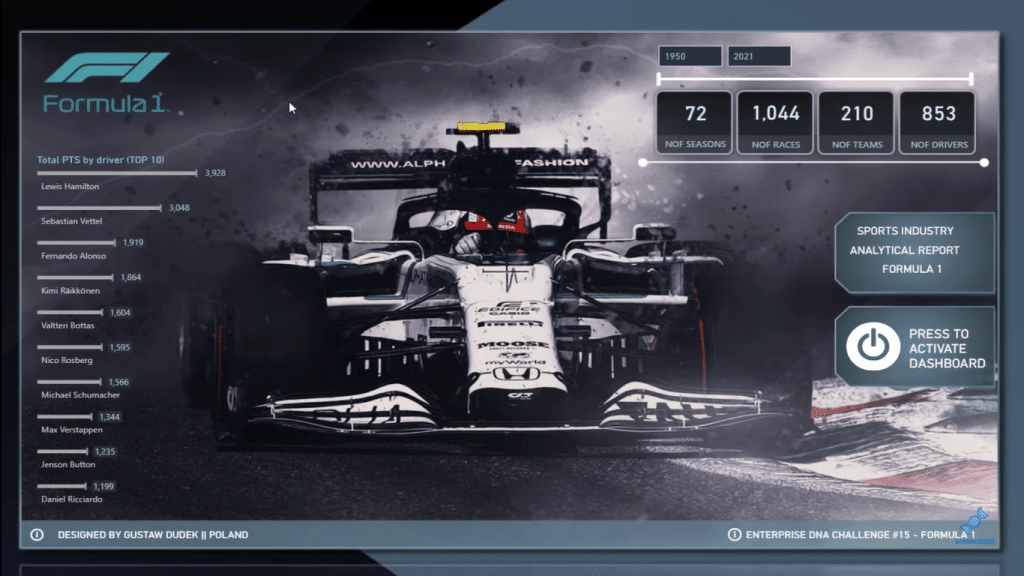
Here’s another great submission from one of our members. This is a little bit simpler, but it has a lot of great features. It utilizes icons that just take you to different insights. The way that the report is structured is simple yet effective.
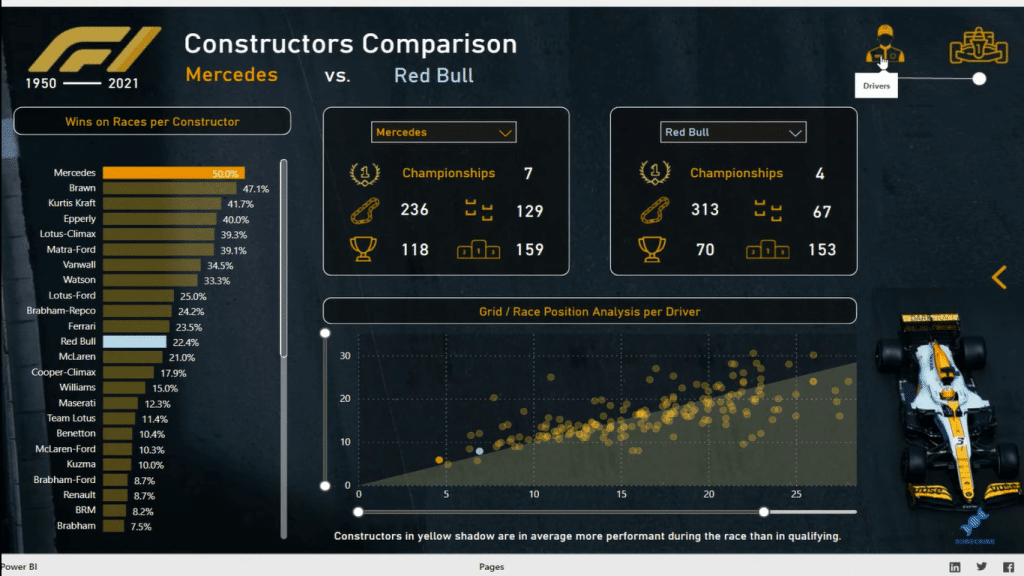
Below is one of the best entries. It’s an absolutely incredible report. Everything is perfect – the design, the insights, the navigation – they are all really high quality. It feels like you’re in a web-based application that allows you to find insights that you need quickly and intuitively. In reality, this is actually a few pages, but the fact that it looks like one page is really well done.
***** Related Links *****
Best Practices For Power BI Report Development
Reporting Apps Using Power BI For Transport & Shipping
Interactive Reports In Power BI | Enterprise DNA Tutorial
Conclusion
The effort that goes into these challenges just blows my mind. I’m so proud that the challenges have got to where they’re at. Please get involved in as many challenges as you can. There’s no better learning experience than these.
You are always welcome to come and visit the forum. Go through the threads and learn as much as you can. Hopefully, you are inspired by these examples. Please watch the full video of this tutorial below to see the sample reports in detail.
Cheers!
Sam
[youtube https://www.youtube.com/watch?v=7D9M8YcEN1g&w=784&h=441]


