
Regression analysis in Excel is like a super-smart calculator that helps us understand and predict relationships between different things.
There are actually two different types of regression analysis.
Let’s explain.

In Excel, you can do two types of regression analysis: simple and more advanced multiple. You have a few choices to do this: you can use the Data Analysis ToolPak, try the graph method, or go with the LINEAR function.
So, let’s learn how to get calculated linear regression equations, get regression analysis output, and interpret regression analysis output.
What are the Types of Regression Analysis in Excel?

In Excel, you can perform two types of regression analysis:
1.) Linear regression – Finding the best-fitting straight line through your data points.
2.) Nonlinear regression – Finding the best-fitting curve.
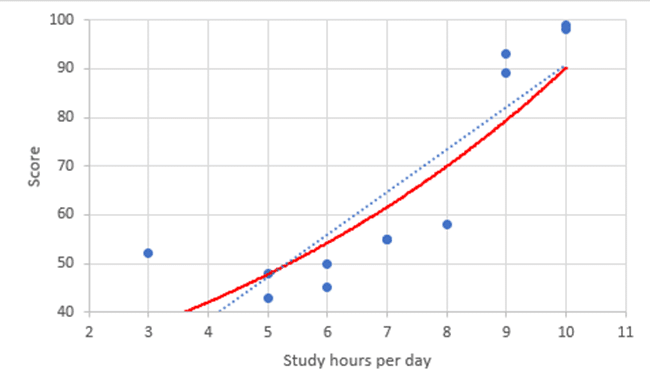
Both types can be executed using built-in tools in Excel.

How to Do Simple Linear Regression in Excel?
Simple linear regression is a statistical method that allows you to understand the relationship between two variables.
How to Do Linear Regression with Analysis ToolPak?
In Excel, you can perform this analysis easily using the Data Analysis ToolPak. In this section, you’ll learn the process of implementing linear regression in Excel using “Data Analysis.
How to Activate Data Analysis Toolpak in Excel?
To perform a linear regression in Excel, you can use the Data Analysis Toolpak.
If you haven’t already, you’ll need to activate the Toolpak. To do that follow the below steps.
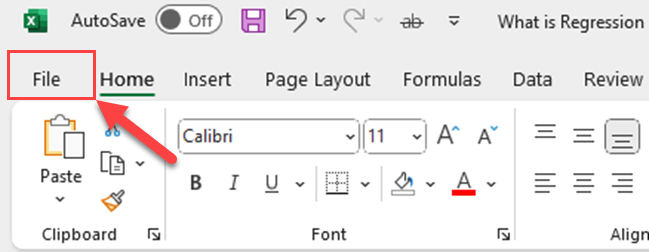
Step 1
Go to the “File” Menu.
Step 2
Click “Options”.

Step 3
Click “Add-Ins” from Excel Options.
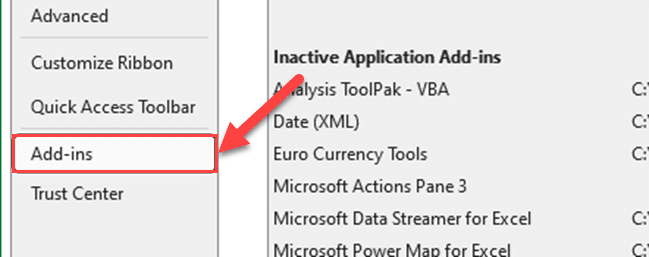
Step 4
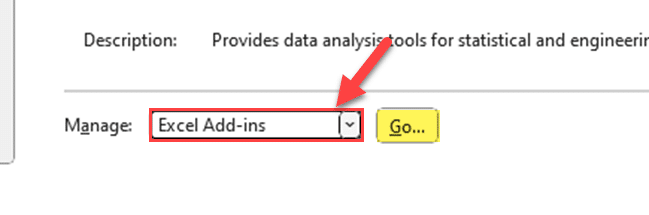
Select “Excel Add-ins” from the “Manage” box and Click “Go”.
Step 5
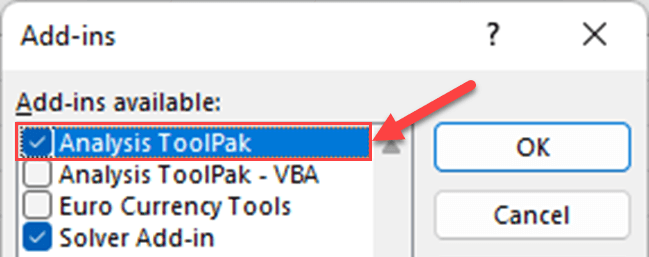
Check “Analysis Toolpak” and click “OK”.
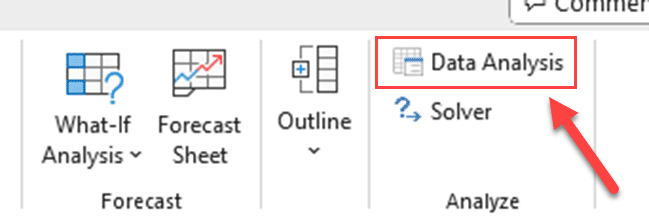
Now, you can access the regression tool by clicking on Data Analysis in the Data tab.

Steps to Do Linear Regression in Excel with Analysis ToolPak
Let’s learn how to do linear regression analysis using the Data Tab.
Step 1
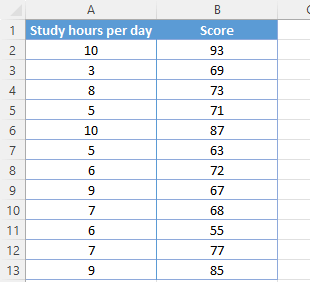
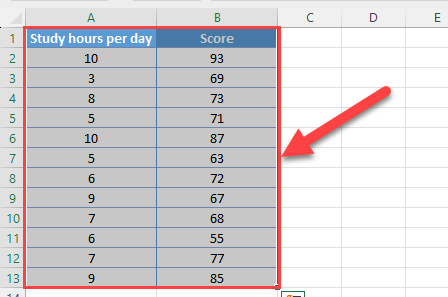
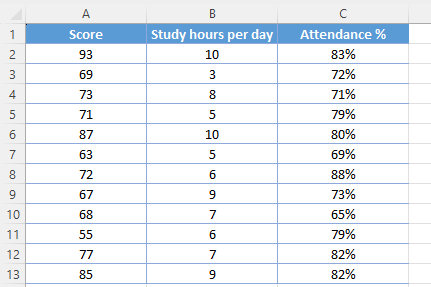
Organize your dataset into two columns, with the dependent variable (response) in one column, and the independent variable (predictor) in the other.
In the below example, there are two variables.
Score (Dependent)
Study hours per day (Independent)
Step 2
Go to the Data tab in Excel, and click on Data Analysis.

Step 3
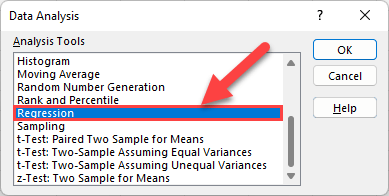
In the Data Analysis window, select Regression and click OK.

Step 4
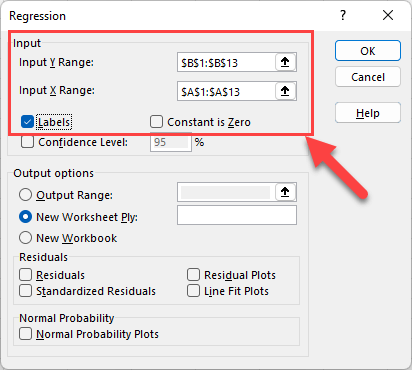
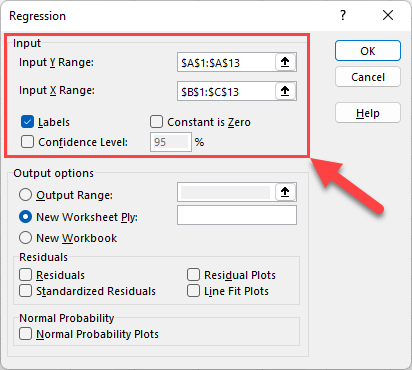
In the regression dialog box, select the dependent variable (Y) range and the independent variable (X) range including labels. Remember to check the Labels Box.
Step 5
Click OK.
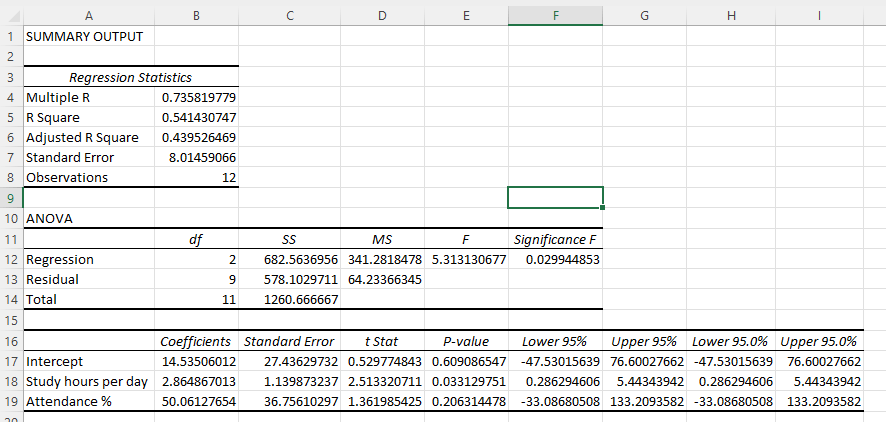
Now, you’ll get a bunch of information to help you understand the relationship between independent and dependent variables in your data.
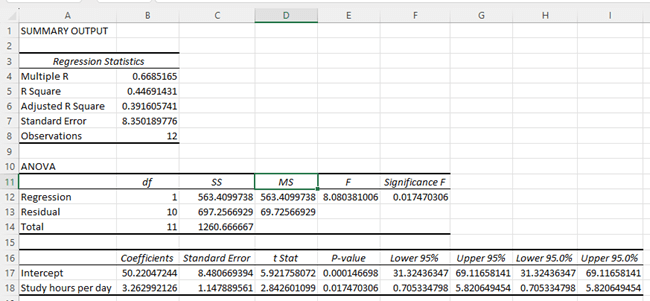
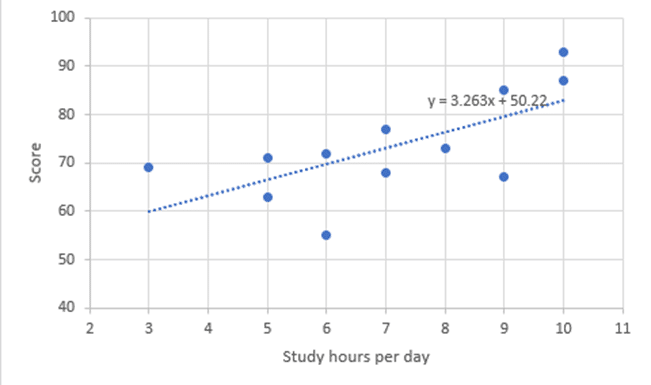
Based on the regression coefficients of the above Summary output, you can construct the below regression line.
y=50.22+3.26x
Here are some important things to look at:
Summary Output: This is like a report that shows the impact of each thing you’re studying on the other things. It gives you numbers called coefficients, which tell you how much each thing affects the other.
Residuals: These are the differences between what you expected to happen and what actually happened. By looking at these differences, you can see if your prediction model is good or if there’s a pattern that needs fixing.
Significance F: This is a test that checks if your overall model is meaningful. A small value means at least one thing you’re studying is important in predicting the other things.
P-values: These tell you if each thing you’re studying is important on its own. A low value means it’s significant, while a high one suggests it might not be important.

Standard Error: This shows how sure you can be about the numbers in your report. A smaller number means more confidence and a bigger one means less confidence.
Correlation Coefficient (Multiple R): This is a number that shows how two things are related. A positive number means they go up together, a negative one means one goes up while the other goes down, and a number close to 0 means they’re not strongly connected.
Coefficient of Determination (R Square): This tells you how well your model fits the data. A higher number, closer to 1, means your model is doing a good job explaining what’s happening.
Understanding all these things in the Excel output helps you check if your model is accurate and if you need to make any changes to make it better at predicting stuff.
How to Draw a Simple Linear Regression Graph in Excel?
Using Microsoft Excel, you can easily create a simple linear regression chart.
To do that follow the below steps.
Step 1
Select the data points.
Step 2
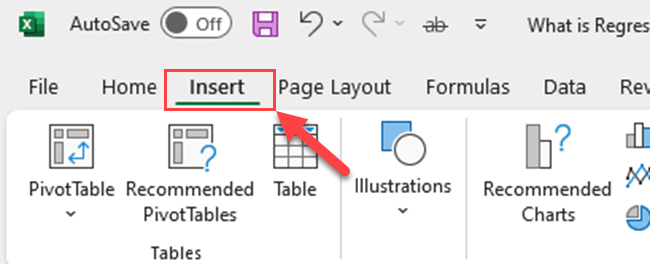
Go to the Insert tab.
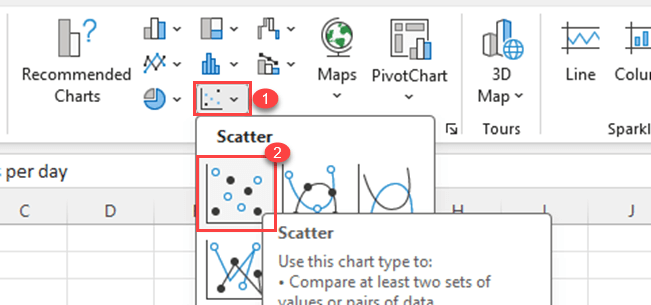
Step 3
Click on the scatterplot icon, and choose a scatter plot type from the dropdown menu.
Step 4
Expand the Chart Elements and check the Trendline box.
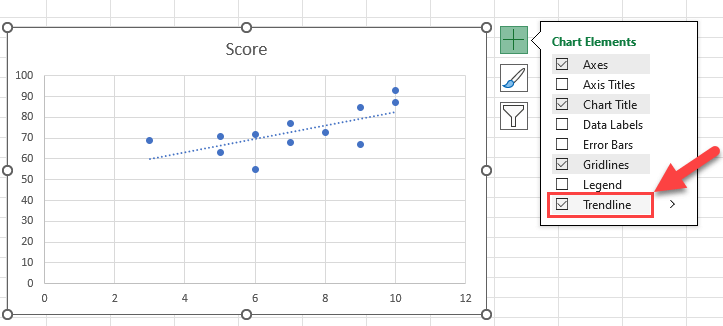
Now, you’ll see a regression line in the scatter plot. This line represents the equation that best explains the relationship between the dependent and independent variables.
Step 5
Double-click on the trendline and open the “Format Trend line” box. Then, check the “Display equation on Chart” option.
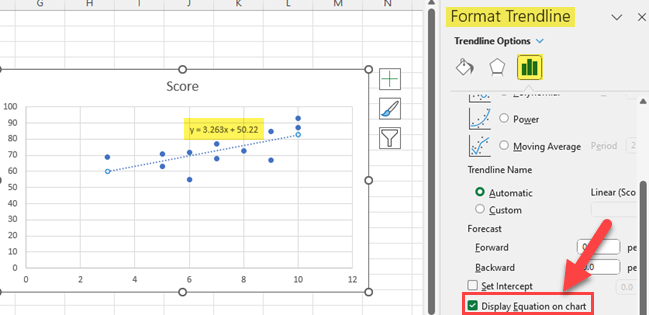
Excel can calculate this line based on the least squares method, which aims to minimize the distance between the line and the data points.
How to Use Excel Functions to Do a Simple Linear Regression?
Another way to perform regression analysis in Excel is by using the Excel functions.
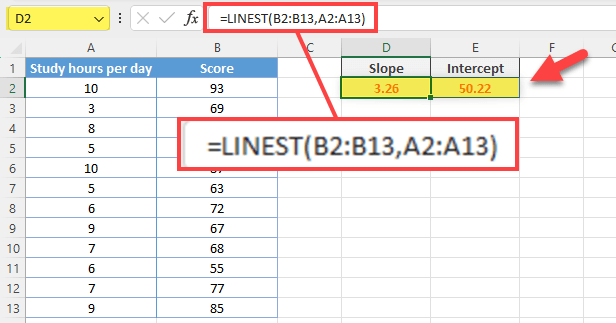
Let’s learn how to use Excel LINEST function to do a simple linear regression analysis.
You have to use the below function.
=LINEST(Y_range, X_range).
Replace “Y_range” and “X_range” with appropriate cell ranges for your data.
These tools and techniques in Excel will help you perform regression analysis effectively, analyze the relationship between variables, and make data-driven decisions. Remember that you can customize your analysis by selecting appropriate options and utilizing Excel’s powerful statistical functions.
How to Do a Multiple Linear Regression Analysis in Excel?
Multiple linear regression is a technique used in statistics to understand the relationship between two or more independent variables and a response variable. It helps in creating a predictive model where you can estimate the effect of each explanatory variable on the response variable while holding other variables constant.
In this section, we’ll discuss how to conduct multiple linear regression in Excel.
Step1
First, arrange your data in columns with each variable in a separate column. The response variable should be placed in the leftmost column, followed by the independent variables. Ensure that there are no missing values, as Excel requires complete data sets to perform the analysis.
Step 2
Go to the Data tab in Excel, and click on Data Analysis.

Step 3
In the Data Analysis window, select Regression and click OK.
Step 4
In the regression dialog box, select the dependent variable (Y) range and the independent variables (X) range including labels. Remember to check the Labels Box.
Step 5
Click OK.
Excel will generate a summary report with the results of the regression analysis.
This output will include the coefficients for each explanatory variable, the R-square value, the adjusted R-square value, and various other statistics about the model.
Basically, the coefficients are the values by which each predictor variable contributes to the response variable.
You can use the estimated coefficients to create a multiple linear regression model. Furthermore, this model will help you make predictions about the response variable based on values of the explanatory variables.
Remember, multiple linear regression in Excel assumes a linear relationship between the variables, and outliers or high multicollinearity between variables may adversely affect the accuracy of your model.
Also, It’s essential to analyze the residuals and check the assumptions underlying the regression model to ensure its reliability.
Overall we find familiarizing yourself with advanced concepts and assumptions in regression analysis can massively help you better interpret results, assess the reliability of your model, and make meaningful predictions.
Final Thoughts
Now, you’ve gained the know-how for both simple linear regression analysis and the more advanced multiple linear regression analysis using Excel. There are a few routes you can take: use the Data Analysis ToolPak, explore the graph method, or opt for the LINEAR function method.
Thanks to Excel, you can pull off a whole regression analysis in the blink of an eye. Seriously, it’s like the superhero of spreadsheets, helping you understand your data in just a minute. So, go ahead, play around with those tools, and watch Excel turn you into a regression analysis pro in no time!
Are you interested in discovering how Data Mentor can revolutionize your data analytics strategy and elevate your AI-driven solutions? Check out the video below to gain insights:
Frequently Asked Questions
How do I perform linear regression in Excel?
To perform linear regression in Excel, follow these steps:
Click on the Data tab and select Data Analysis from the Analysis group
In the new window, choose Regression, and click OK
Specify the Input Y Range as your dependent variable and the Input X Range as your independent variable
Choose where to output the results, either on a new worksheet or a specific range
Click OK to perform the regression analysis
What is the process for multiple regression analysis interpretation in Excel?
After performing a multiple regression analysis in Excel, you need to interpret the results. Some important values to consider:
Multiple R: represents the multiple correlation between the response variable and the predictor variables
R Square: indicates the proportion of variance explained by the predictor variables
Coefficients: represent the relationship between each independent variable and the dependent variable
P-value: helps to assess the significance of each predictor variable
How do I conduct logistic regression in Excel?
Logistic regression is not directly available in Excel; however, you can use the add-in Solver or third-party add-ins to perform logistic regression.
To do this with Solver:
Create an estimated probability column using the logistic function
Define an error column calculating the difference between actual outcomes and estimated probabilities
Invoke Solver and set the target cell involving the sum of squared errors to be minimized
Add constraints for the coefficients and set the Solver’s solving method to use GRG Nonlinear
Click Solve to perform logistic regression
Can you provide an example of simple regression output in Excel?
Let’s say you have data on sales (dependent variable) and advertising expenses (independent variable). After running a simple regression in Excel, you might get the following output:
Intercept: 145
Advertising Expenses Coefficient: 0.25
R Square: 0.85
Your regression equation would be: Sales = 145 + 0.25 * Advertising Expenses, meaning for every $1 increase in advertising expenses, sales are expected to increase by $0.25.
How can I add Data Analysis ToolPak to Excel?
To add the Data Analysis ToolPak in Excel:
Click File > Options and choose Add-Ins
In the drop-down menu at the bottom, select Excel Add-ins and click Go
Check the box next to Analysis ToolPak and click OK
After these steps, you will see the Data Analysis option under the Data tab.
Is it possible to do regression analysis in Google Sheets?
Yes, you can perform regression analysis in Google Sheets using the LINEST and LOGEST functions for linear and logistic regression, respectively. You can also use the add-on XLMiner Analysis ToolPak for regression analysis similar to Excel’s Data Analysis ToolPak.


