In today’s blog, I want to teach you all about data table types. It’s important to understand how the tables work so you can build your data model effectively.
A data table contains columns and rows of information used to achieve easier visual representation.
There are two types of tables within a data model: the lookup table and the fact table.
A lookup table is a fundamental part of your data model. Lookup tables serve as filtering tables and can help speed up your calculations inside Power BI.
On the other hand, a fact table is a table of your transactional data or sales information in which all the granular details are incorporated. It could be a different table for everybody depending on the scenario they’re dealing with.
Think about the tables that have a lot of the numbers in it, the ones that you’re going to run calculations over, and references all the sales that you’ve been making – these are your fact tables. You’ll want to locate your fact tables somewhere at the bottom.
Setting Up The Data Table Types
I’ll show you how to create a structure for your model by creating the connections between your fact table and lookup table.
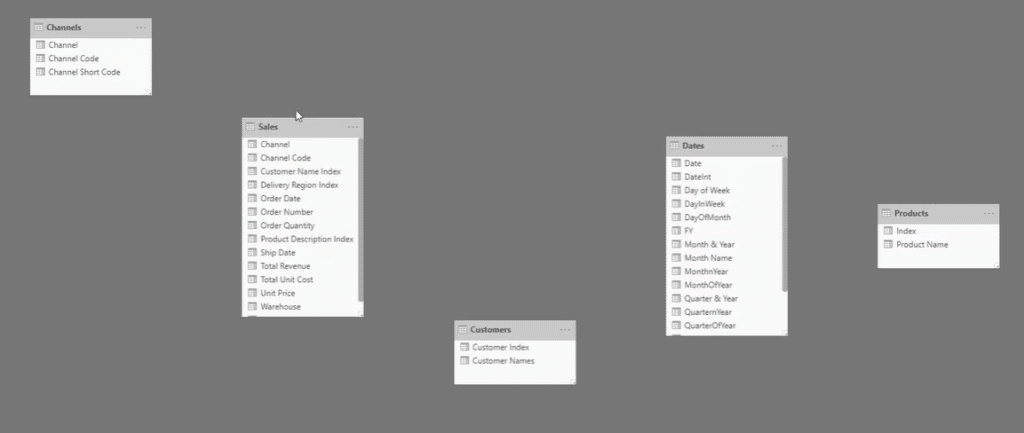
In this example, you can see that I have already created various data tables. This is what the initial data model looks like.

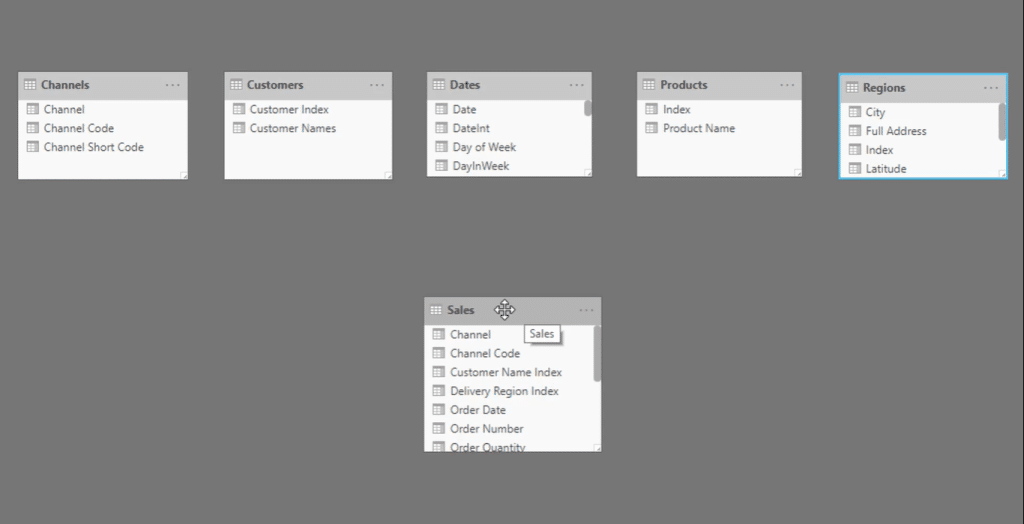
You should place the lookup tables at the top and place the fact table below. This is what your data model should look like.

You can see the Channel, Customer, Dates, Products, and Regions lookup tables lined at the top. Meanwhile, the Sales fact table is placed below.
Your data model looks better if you structure the tables this way. At a glance, any user can identify which are the filter tables and which are the dimension tables.
Creating Relationships Between The Data Table Types
After setting up your model, you can now create relationships between the data tables.
First, you need to connect the lookup tables to your fact table. This is necessary so you can do a filter or slicer selection from the lookup tables.
You need to have a waterfall of filters, where the filters are flowing down from the lookup tables to the fact table.
All the sales information from the Sales fact table will be used during the calculations. This way, you can extract insights like revenue, costs, and more.
Additionally, if you want to do time intelligence calculations, you have to make sure that the Dates table is connected to the Sales table. This way, you can easily analyze how insights change over time.
In my example, I only have one fact table, but you can always have multiple ones in your own model. You are not limited to having just one fact table.
***** Related Links *****
Create A New Table In Power BI
Build A Comprehensive Date Table In Power BI Really Fast
Advanced Tips To Optimize Your Power BI Table
Conclusion
To sum up, you need to identify your lookup tables and fact tables so you can structure them accordingly. This technique is applicable in every scenario, no matter what business information you’re dealing with.
Always remember to build relationships from a lookup table down to a fact table. This is a very intuitive approach to implement in your data model.
Don’t get confused the moment you encounter tables that are scattered everywhere. Just take your time and identify the two data table types so you can clean them up.
Sam


