
In this tutorial, we’ll go through a technique that will create a lookup table from subtotals using the query editor in Power BI. You may watch the full video of this tutorial at the bottom of this blog.
This is most useful when we’re getting data out of Microsoft Excel because most of its data will contain subtotals.
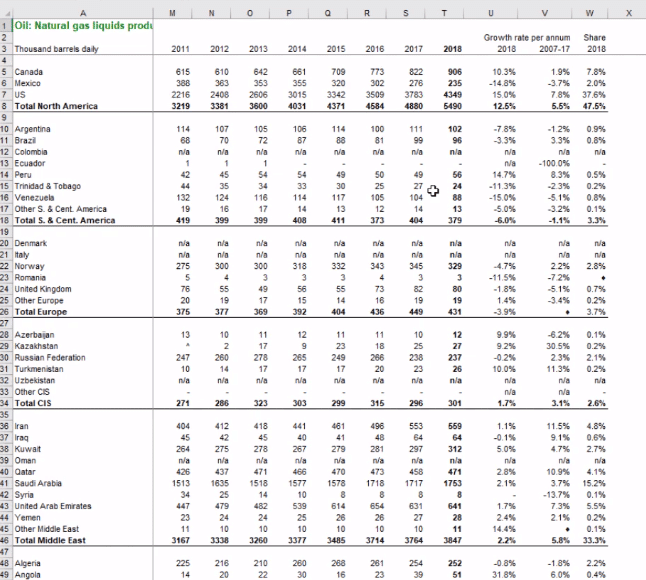
We’ll be using some oil and gas statistics found online.

Subtotals In Excel Data
Subtotals are typically found in financial information.
There’s usually a breakdown of the individual parts and then the subtotals.
However, in Power BI, this data is very sub-optimal.
All we need is the underlying information and then we can easily create the subtotals and aggregation of the amounts within the Power BI model itself.
We need to create a lookup table containing the countries and their categories or regions, and then extract the data into an optimized lookup table so that we can filter the information.
What The Result Will Look Like
This is the original table of the oil and gas statistics when imported to Power BI:


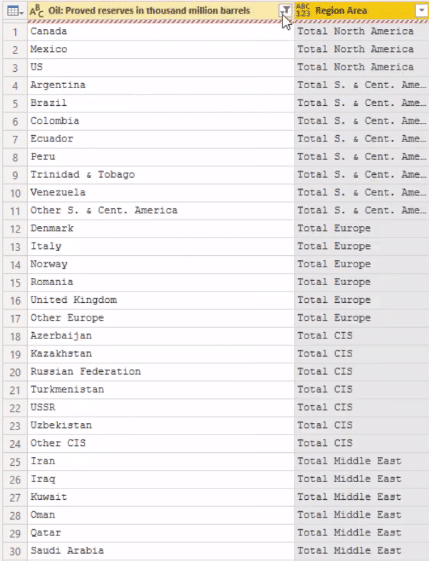
By using this technique, the table was eventually optimized:
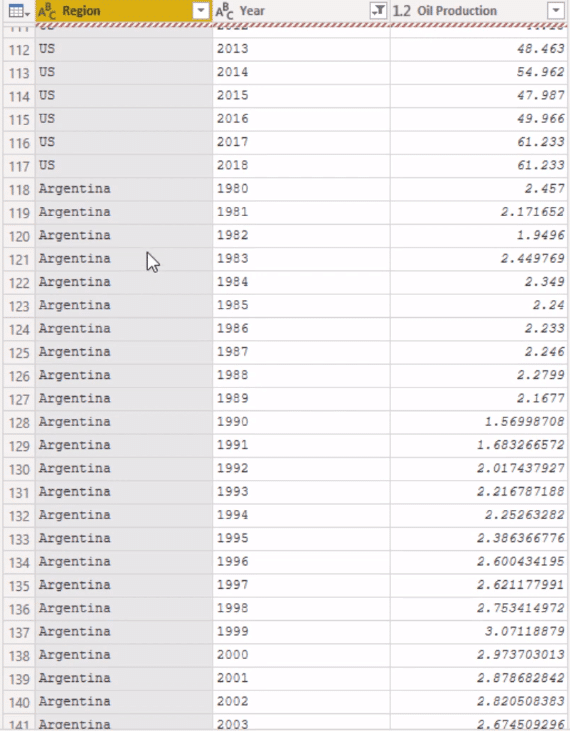
We can see that the Region’s column doesn’t contain any totals; it only contains the countries. So, we need to create a table that has the Region and the Region Area.
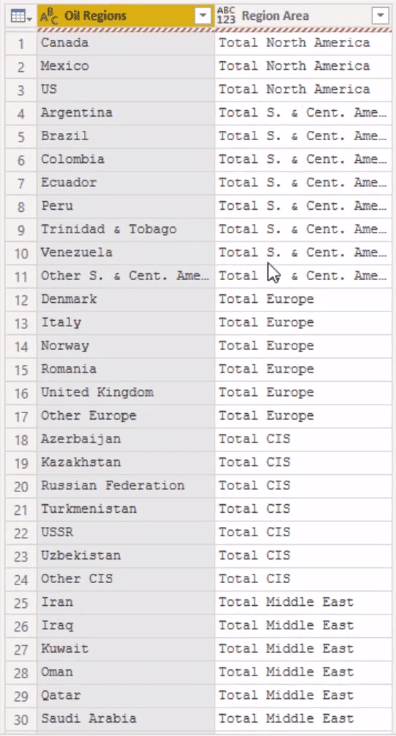
With this, the totals have now become a subcategory in this table.
Creating The Lookup Table
These are the steps we need to do to optimize our tables in Power BI.
First, we need to bring in the initial table in Power BI and then remove all the columns on the right-hand side.

We have got rid of the columns that we didn’t need.
However, there are still totals embedded in the columns that should only contain the countries.
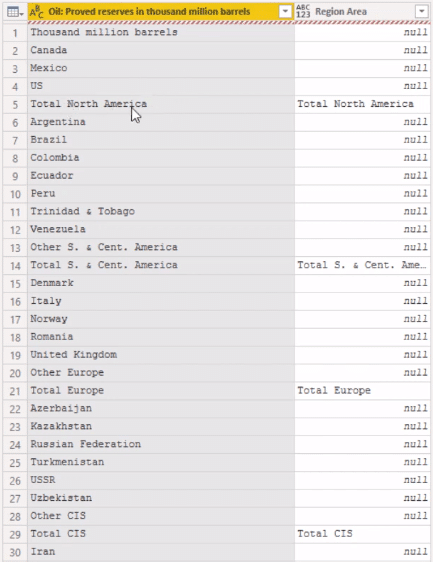
So, we need to create a Conditional Column to remove the unnecessary entries.
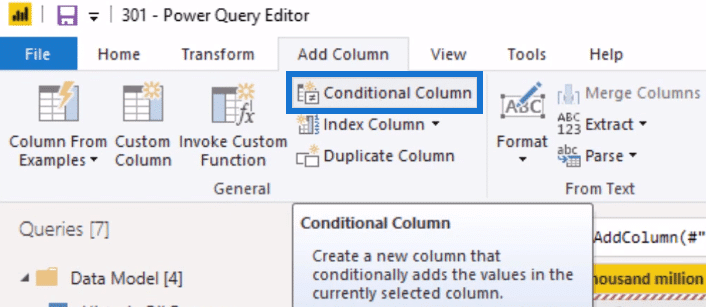
If our main column contains the word ‘total’, it will have the same value in the conditional column, otherwise, it will return ‘null’.

With this, we’re able to extract the values we want into another column.
Next, we need to right-click on the conditional column, use the feature called Fill and then choose Up.
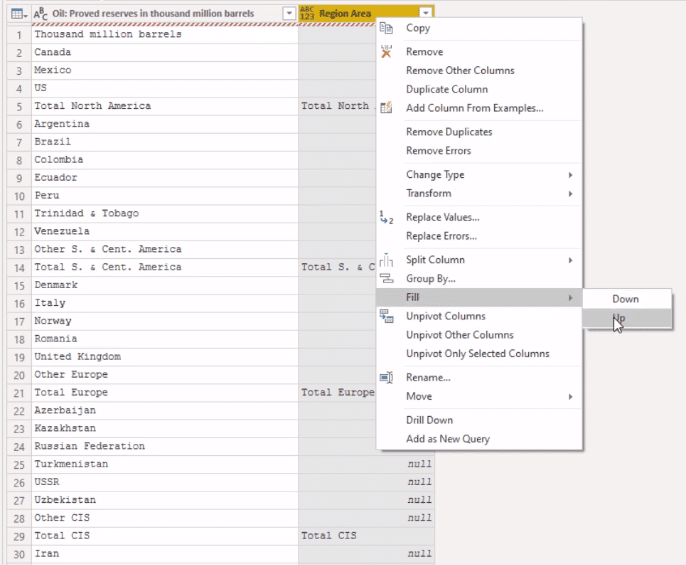
This populates the subtotal across all the countries it was part of.
Now, to get the final table, all we need to do is filter and remove the subtotals in the original column.
So, we can now generate the subtotals within our model by linking the tables we’ve created.
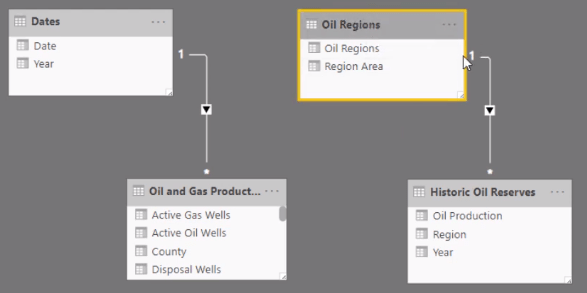
The Oil Regions table is now a lookup table for the Historic Oil Reserves table.

By doing that, we can create a simple visualization which is broken down into all the subcategories.
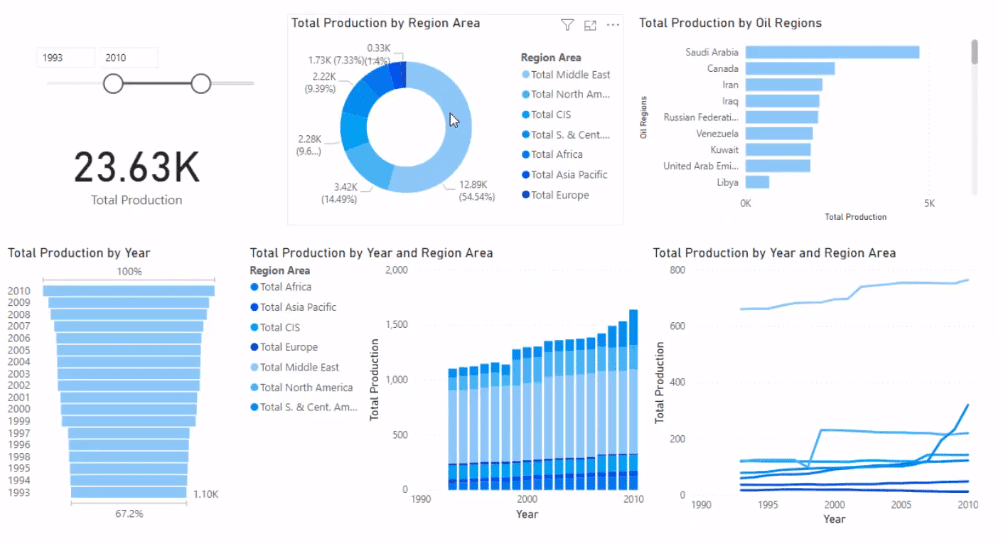
This is a more appealing presentation compared to looking at the Excel data.
***** Related Links *****
Power BI Query Parameters: Optimizing Tables
My Practice Tips When Using The Power BI Advanced Editor
Power BI Financial Reporting: Allocating Results To Templates At Every Single Row
Conclusion
If we think back to the original table, it was very hard to comprehend and get insights from. But with this technique, we can transform the data into a simple and intuitive report.
We can quickly dive into various aspects of the data visually and generate highly interesting insights from it.
This is a great technique that can be utilized in different situations.
A common issue raised by Power BI users in the Enterprise DNA support forum is understanding how to optimize the tables and model to simplify tasks in Power BI.
By implementing this technique in our reports, we can fully optimize and simplify how our data is processed and presented.
All the best,
Sam


