In this tutorial, you’ll learn how to add elements for vendor analysis in your inventory management dashboards using DAX formulas.
Previous blogs have discussed how to set up the data model and the code used to get stock reorder analysis. The next details you need to focus on are the vendor tables.
You have a number of different vendors and you should know how much inventory you have for each of them. Thus, you have narrow down your vendors to the top 5.
This part brings in another concept or pattern that you can utilize in your formulas with DAX. You just need to understand how to utilize it in your models to get valuable insights quickly and effectively.
Vendors By Stock Units
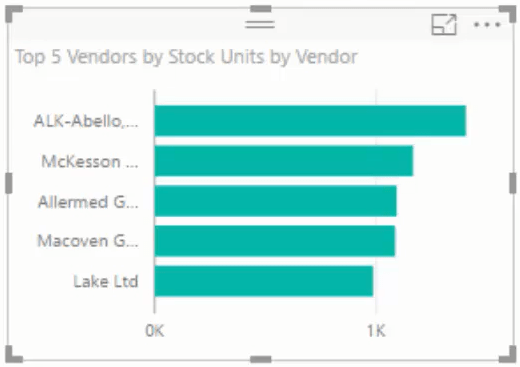
Create a new measure and name it Top 5 Vendors by Stock Units. Then, use the CALCULATE function and put the Inventory Stock Quantity.
In another line, add in the TOPN function and input 5 to return the top five. Use the ALL function and then order it again using the inventory stock quantity. This ALL statement releases the context on the vendors. So, you need to bring back the content by using the VALUES function.

If you bring it into the chart, it will only show you 5 values. It blanks out everyone that is not in the top five.

Vendors By Stock Value
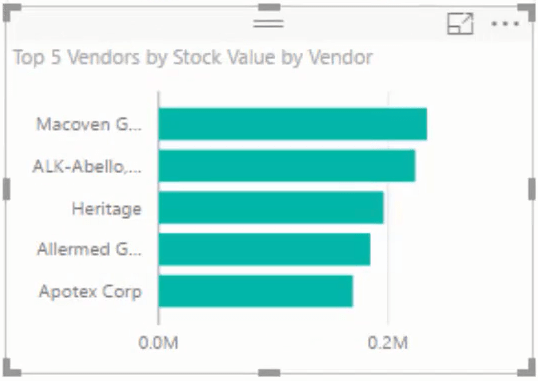
Next, copy the previous measure and alter it to get the Top 5 Vendors by Stock Value.

Bring it in the chart and you’ll have another insightful visualization.

***** Related Links *****
Inventory Management Reports To Show Trends In Sales
Procurement Decisions Model And Analysis In Power BI
Inventory Management Insights With Power BI: Comparing Stock To Sales
Conclusion
The vendor analysis technique discussed in this tutorial is simple but it can give you insights that add immense value to your inventory management reports.
With the steps you’ve implemented following previous tutorials, your dashboard has now all the insights and logic that you need. The next thing to do is to correctly fix and format all the elements in your report. The next tutorials will cover this lesson.
All the best,
Sam


