
In this Power Query tutorial, we’ll examine a unique and intriguing Power Query Group By Alphabets to Columns Excel BI Challenge. It involves turning a single-column table into a table where each letter has its column and is repeated as often as it is present in the source table. You can watch the full video of this tutorial at the bottom of this blog.
Although it’s unlikely that you’ll encounter this challenge, it’s a wonderful scenario to practice your skills and explore the different Power Query tools in Power BI. You can also learn great techniques and methods used by experts in the field along the way!

Power Query Group by Alphabets to Columns Variables

The image above represents the single column alphabet table that we’ll transform in this challenge. Sometimes you can have a very clear idea about how you want to approach this problem. In this instance, it’s ideal to open the Advanced Editor window to see what we have.

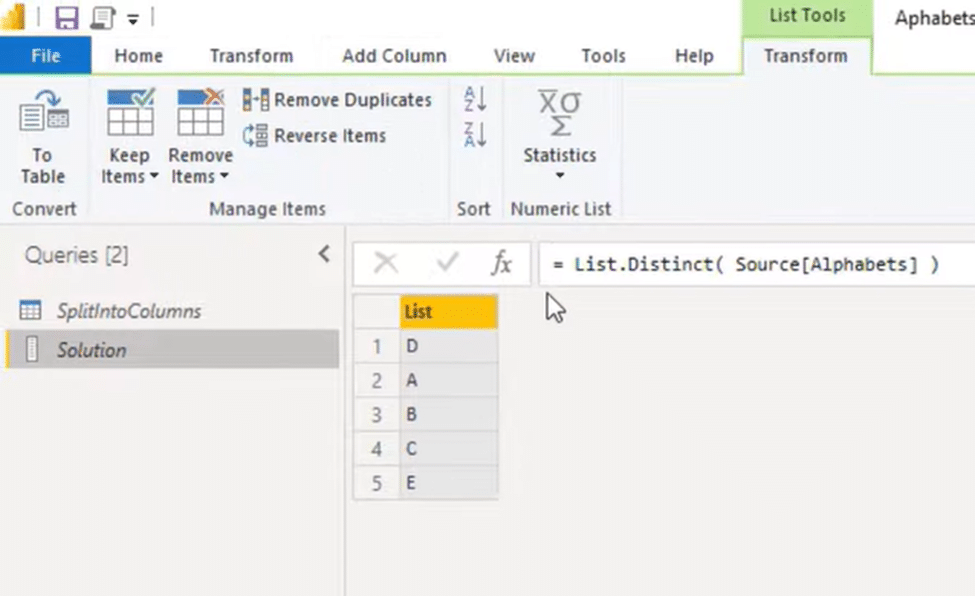
Examining the above results from our Advanced Editor, it’s clear that we need a list with unique alphabet letters present in the alphabet column. So we’ll create a variable called Columns to Add, which will be equal to the list distinct, by entering this code ColtoAdd = List.Distinct.

We’ll then call our Source and refer it to the column alphabets by entering Source [Alphabets]. Finally, we’ll return that variable by replacing the Source at the bottom with ColtoAdd. We click Done to complete the changes and what we get after is the table below.
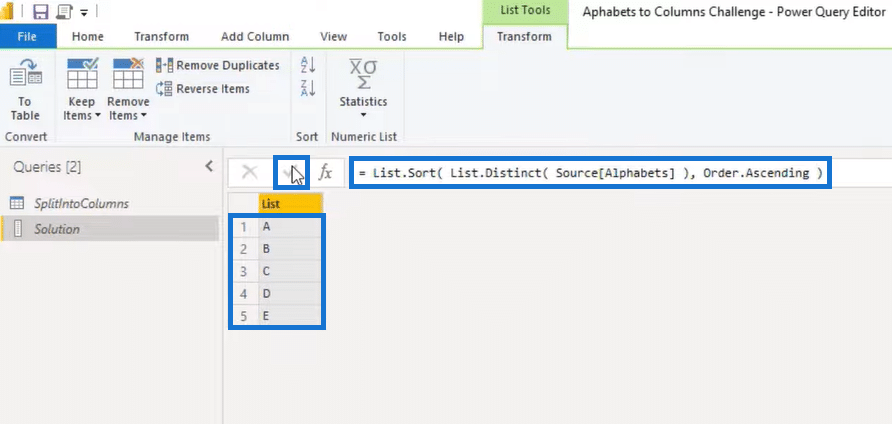
Now we can also sort this list in the correct order by entering List.Sort and Order.Ascending. We press that check mark, and the list is now sorted out.
With this list of unique values, we can generate a list that contains that letter as often as in the source table. So let’s go back to the Advanced Editor and see how it looks.
Power Query Group by in the Advanced Editor
Now we input Result = List.Sort in the 4th line and press Enter. Next, we call our columns to add to the list and repeat each element on that list. That means each list will be its own value, so in the fifth line we type in List.Transform(CallToAdd, each List.Repeat (_),.
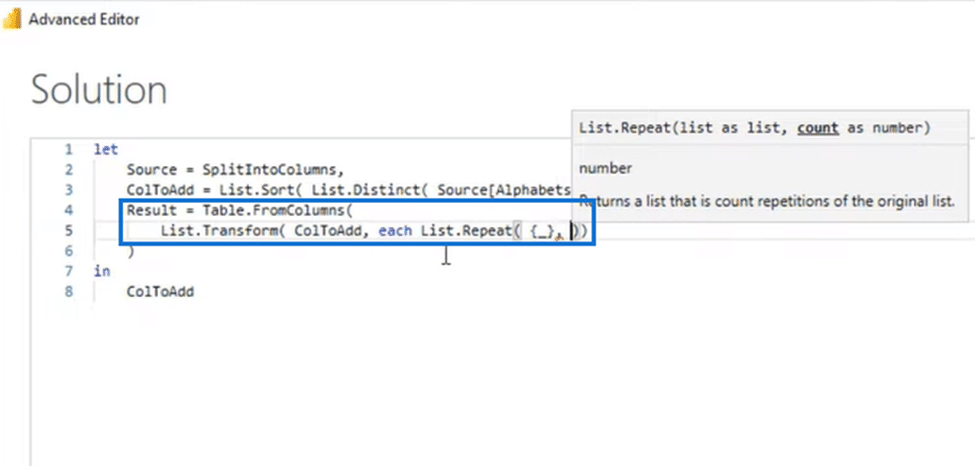
We need to count how many times that letter is in the source table.

So we type in List.Count (List.Select( Source[Alphabets],. From this Source alphabets, we want to ensure that its value is equal to that from the outer iteration.
So we have columns to add, which are the alphabet list from our table and our source list with all the elements. We want to ensure that those items – the inner ListList and the outer ListList – match. So we enter X = _)),.
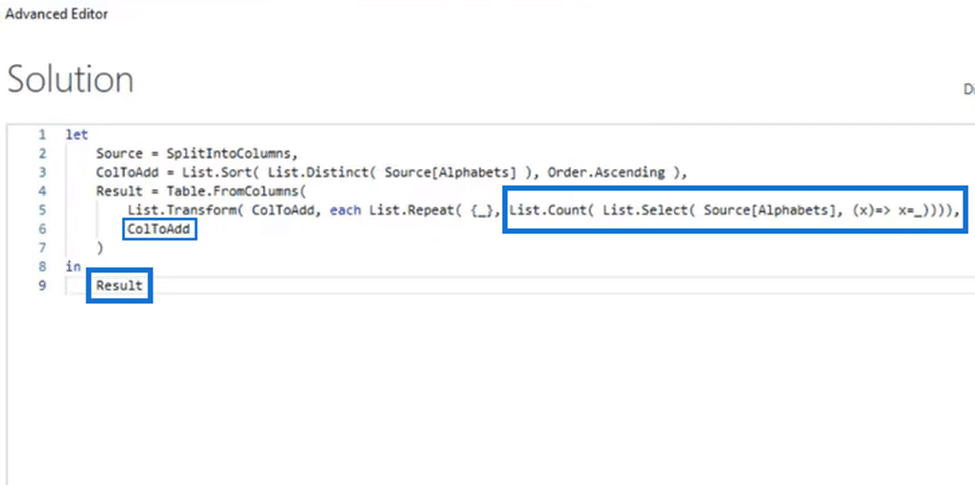
Then we call in our columns to add variables again as new column names by typing ColToAdd in the next line. Finally, we want to return the results by entering Result at the 9th line. Both actions are highlighted in the image above.
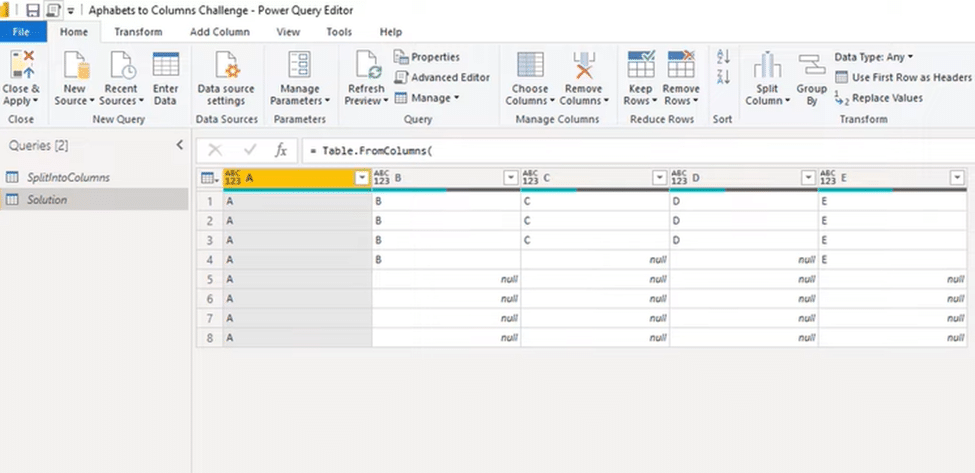
After we press Done in the Advanced Editor, we will get the results below. As you can see, it has turned a single-column table into a table where each letter has its column and is repeated as often as it is in the source table.
Power Query Group By: Bill’s Solution
However, my good friend Bill did something that immediately put a big smile on my face as it was so much more straightforward. I’m going to demonstrate his solution to this Excel Power BI Challenge. So we’ll duplicate our solution, rename it, and remove the steps.
The first thing Bill worked on was Groups on Alphabets. Thus, we’ll go to Group By, bring back all of the rows by selecting All Rows, and call it lst under New columns came. We then click OK to complete the changes.

Now we have a table that we don’t need since we only need the Alphabets. So let’s call that column to get a list by copying Alphabets and pasting it beside each, and putting it inside a set of square brackets instead of the underscore.
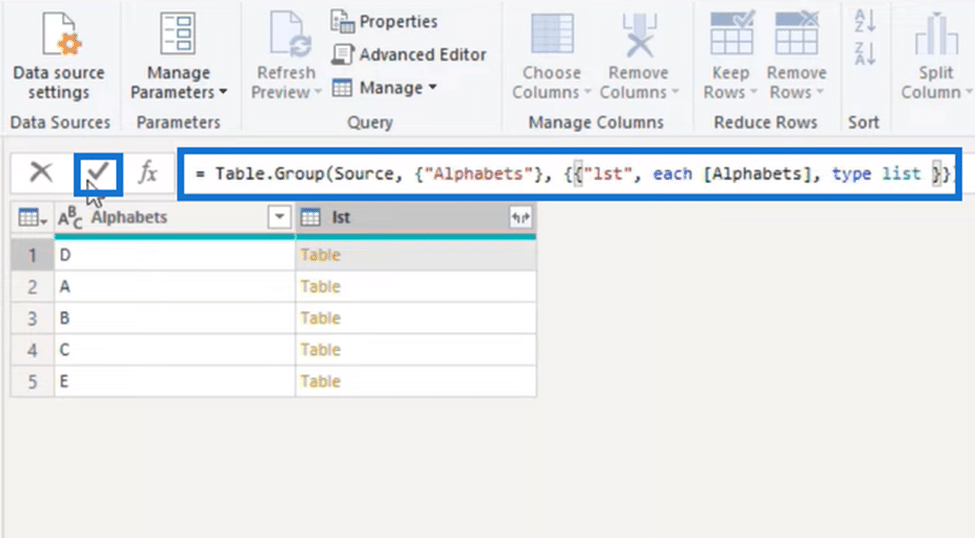
Finally, we paste in the column name beside type, and that will no longer return a table but return a list. Then we press that check mark.
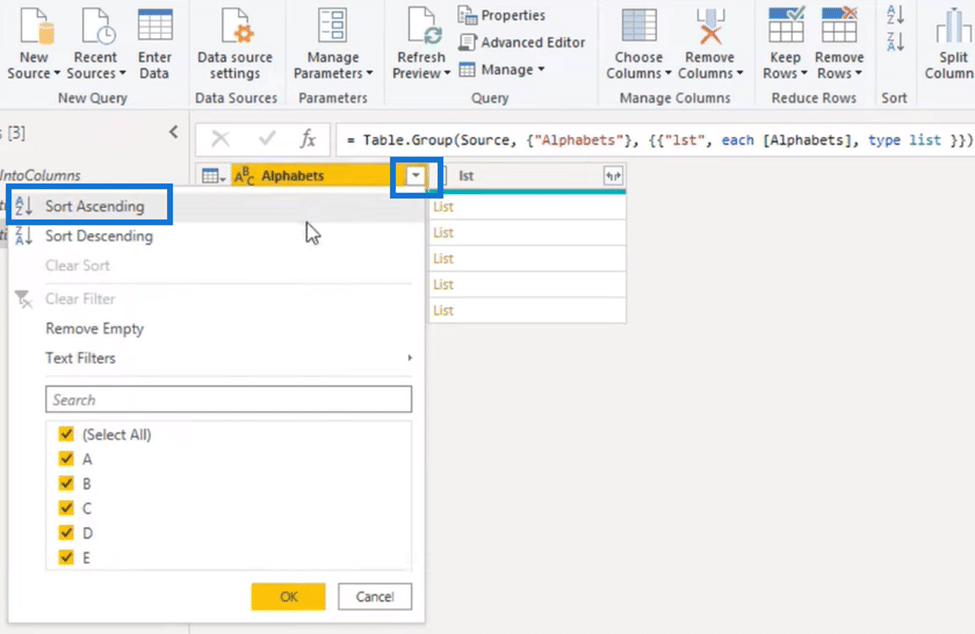
We can sort on the Alphabets here by clicking on the column header and selecting Sort Ascending just like the image above. Now we have the unique column names in the Alphabets column and the column values in the list here.

Now, we have the unique column names in the Alphabets column and the column values in the list here.
We can also construct a table as we did a short while ago. So let’s open our Advanced Editor and do some changes to it.

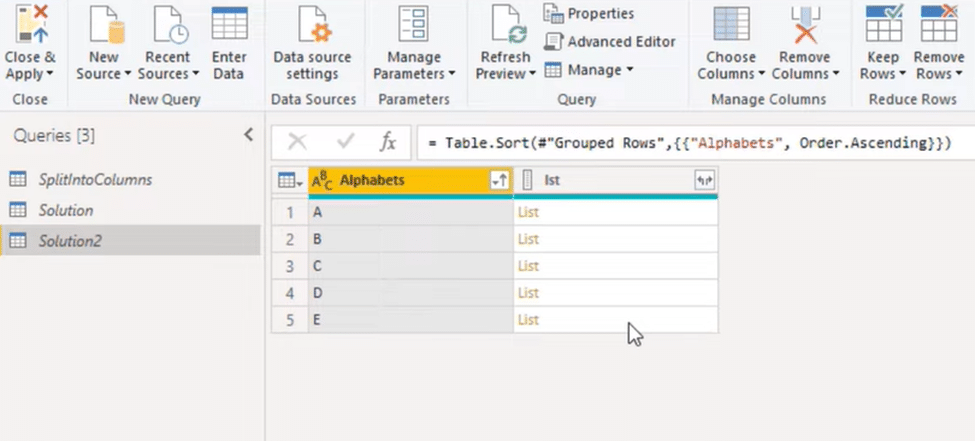
First, we’ll rename this step in the 4th line SortRows and place a comma at the end. We then press Enter and type in Result = TableFromColumns. We add the columns values and their matching list into the equation, making it Result = TableFromColumns (SortRows [list].
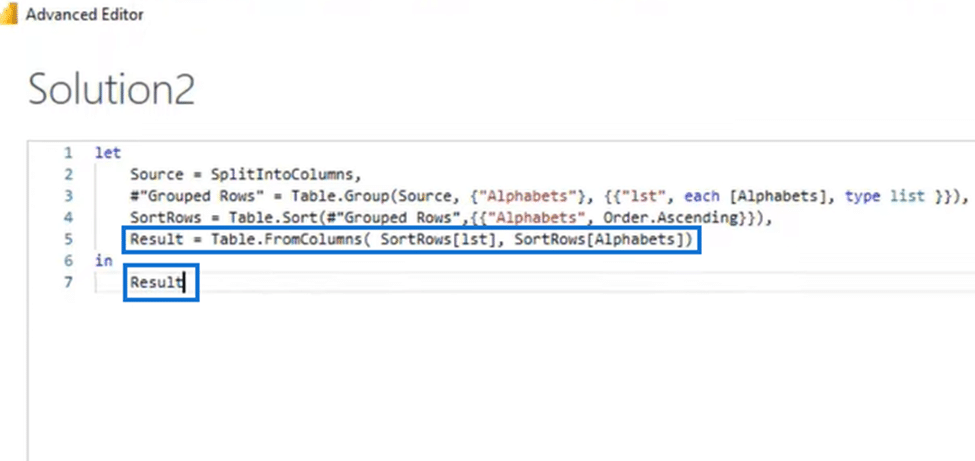
For the column names, we have to refer to the column Alphabets and the previous step name, like in the image above. We’ll then return it by typing Result in the last line and pressing Done.
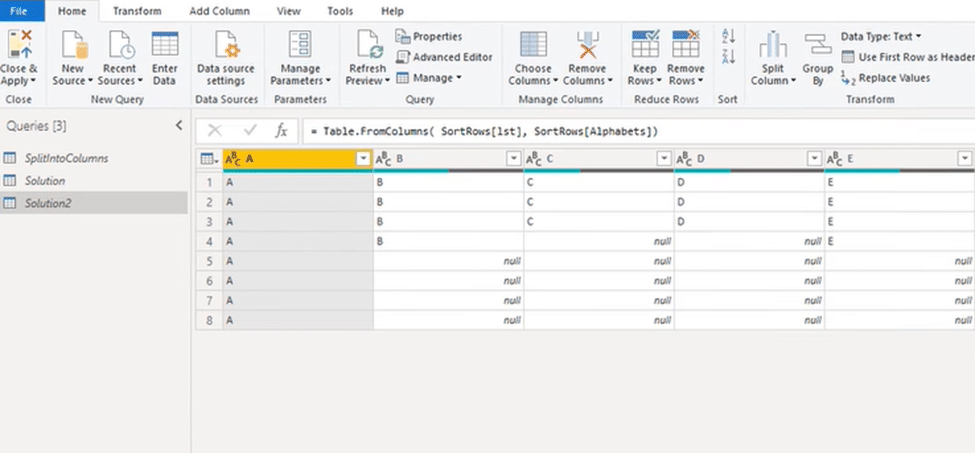
Now we have our final table below, concluding our Enterprise DNA Power BI challenge!
***** Related Links *****
How To Use Power Query Row And Column Selection
How To Dynamically Merge Columns In A Power Query Table
Power Query: How To Merge Tables W/Different Columns

Conclusion
In this blog, you’ve seen two approaches to the Power Query Group by Alphabets to columns in Excel BI Challenge. We have my approach and Bill’s, which is shorter and more straightforward. Try exploring both approaches and use the one that suits you better.
There are many more Excel BI challenges that you may take on the future and this is one is good start!


