
This tutorial is about a power query function in Power BI called Group By. It’s an underrated feature in Power BI that lets you solve common problems in the simplest way possible. You can watch the full video of this tutorial at the bottom of this blog.
Group By function is the best option when you have a series of attributes that you want to group and create an aggregate.

Sales Table Example
This is a sample report using DAX calculations. It has circular redundancy and filter context problems.
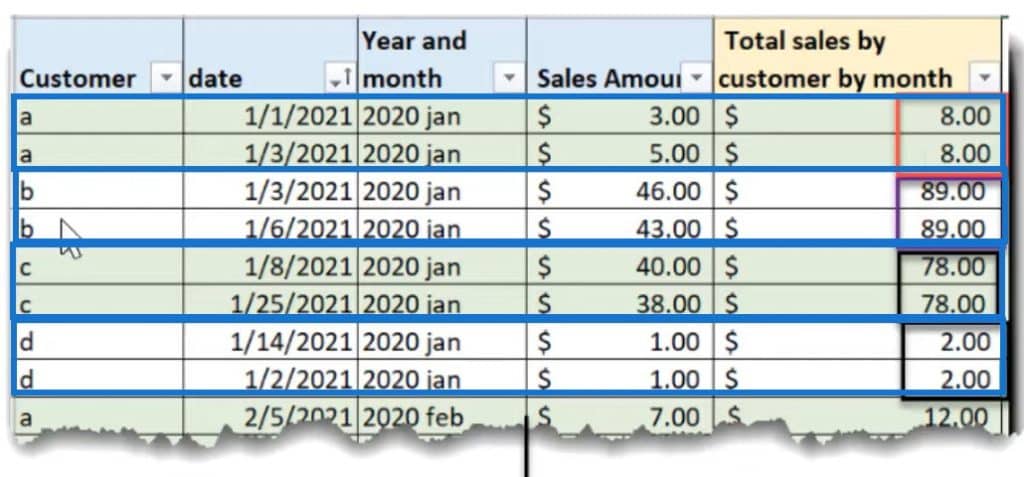
The table was grouped by Customer, Year and Month, and Sum of Sales Amount.
The Total Sales amount is then placed on each row of the group.
Using The Power Query Function Group By
To replicate this using the Group By function, open Power Query and click Group By.
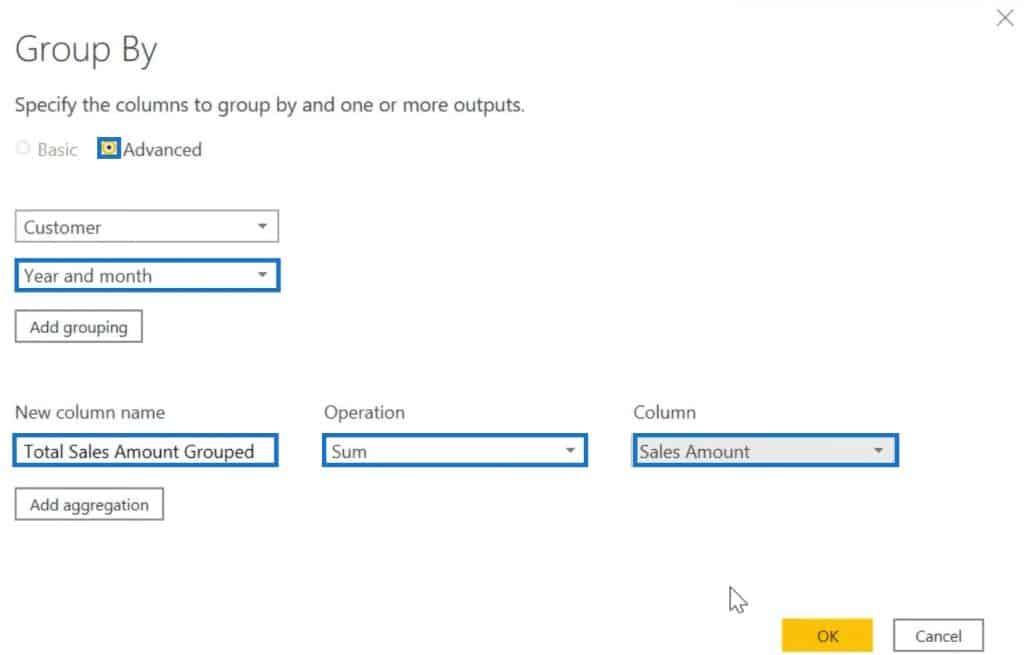
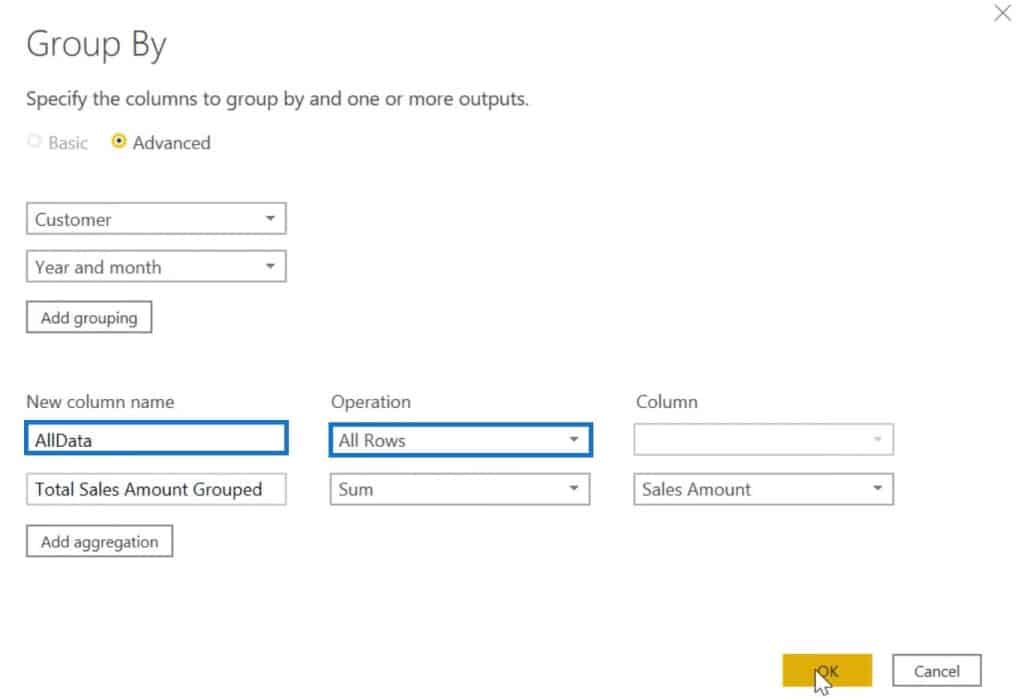
Once it’s open, click Advanced and start grouping attributes.
First, group Customer and Year and Month. In this case, name the column Total Sales Amount Grouped. Next, change the operation to Sum and the column to Sales Amount.
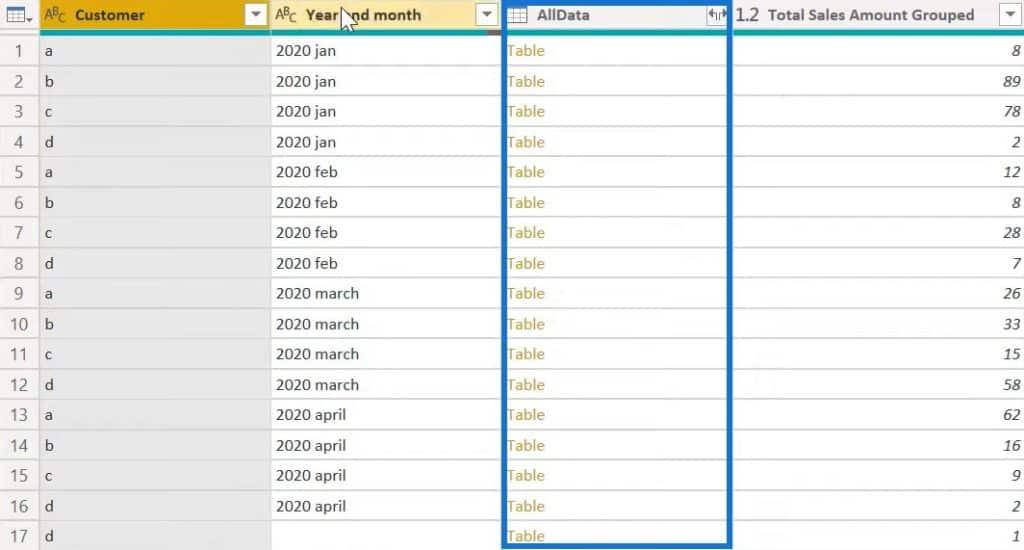
You can see that it generated a column. However, the data is incomplete because it only has one row per customer.

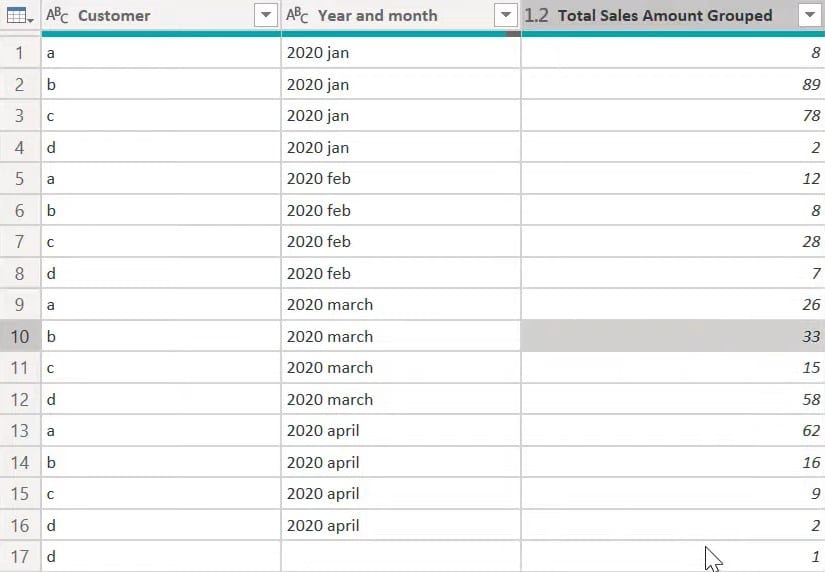
So, go back to the Group By function step to fix this.
At the bottom of the function, click Add Aggregation and name it AllData.
For the Operation, choose All Rows. This operation provides a way to return all of the rows that were in the original data with the aggregate operator applied to it. Next, move the parameters up and click OK.
This creates a new column in the table.
Now, remove the Customer and Year and Month columns and expand the AllData column.
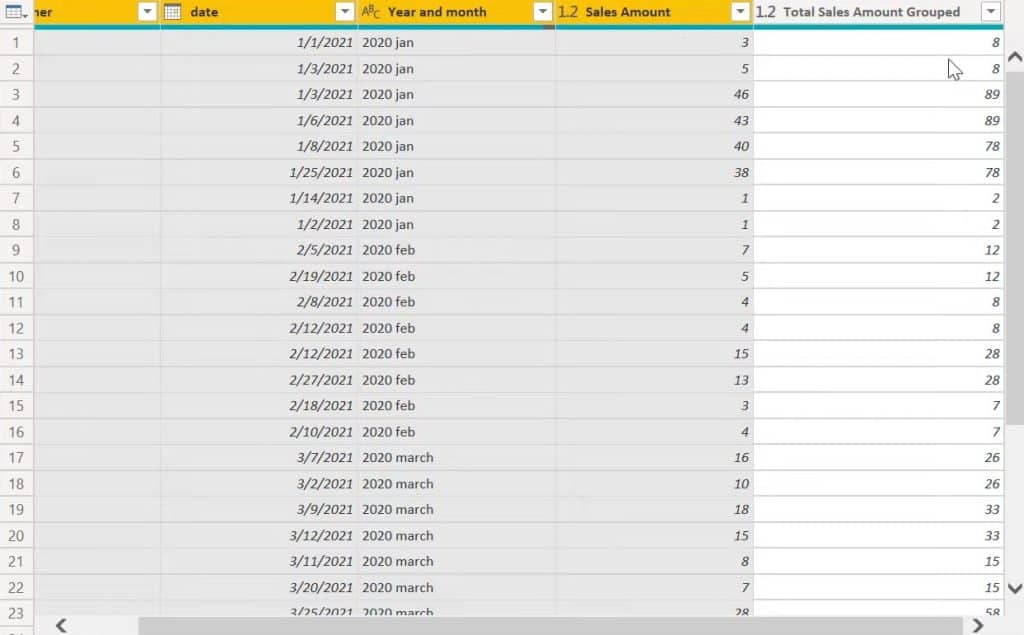
You now have the same table set up as in the example.
So, instead of using complex DAX and circular references, you can use Group By to obtain your desired results easily.
Basketball Record Example
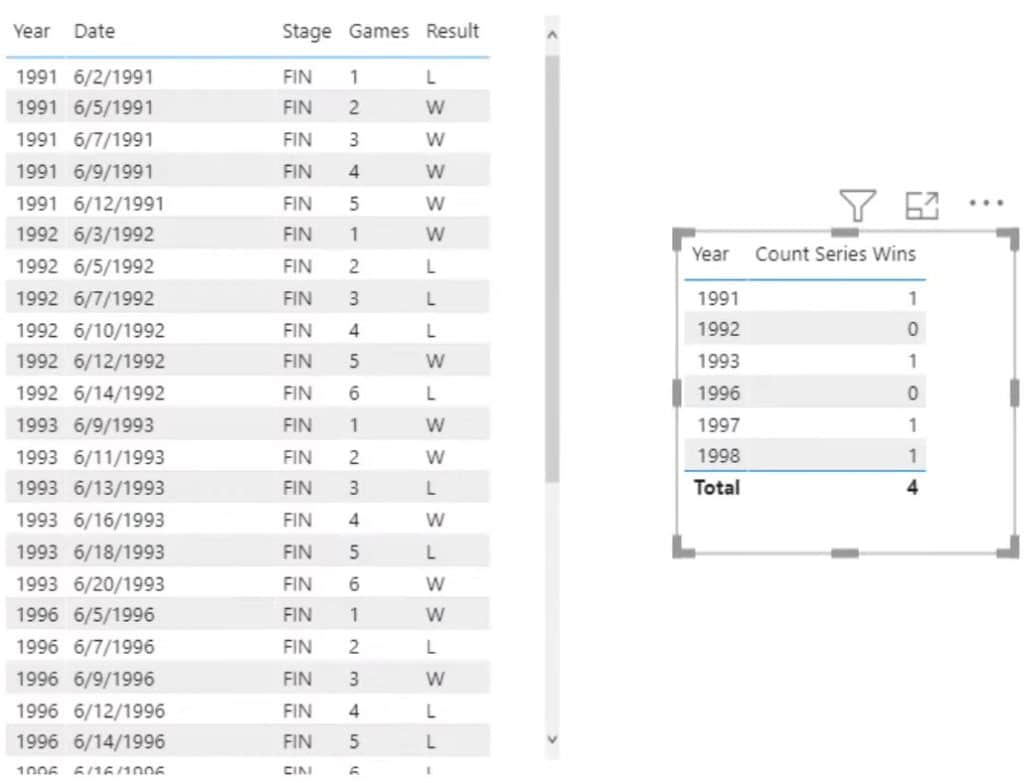
In this example, we have used the finals records of the Chicago Bulls basketball team.
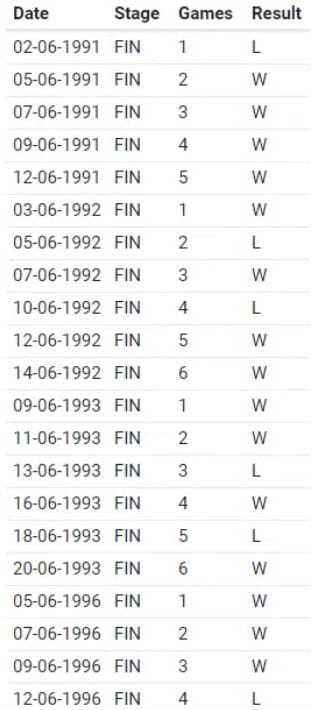
These are the best seven-game series each year.
Applying The Power Query Function Group By
Using the Group By function, you must determine how many series wins they had that was 4 out of 7.
If you use DAX codes, you may end up using this measure to identify the series wins.
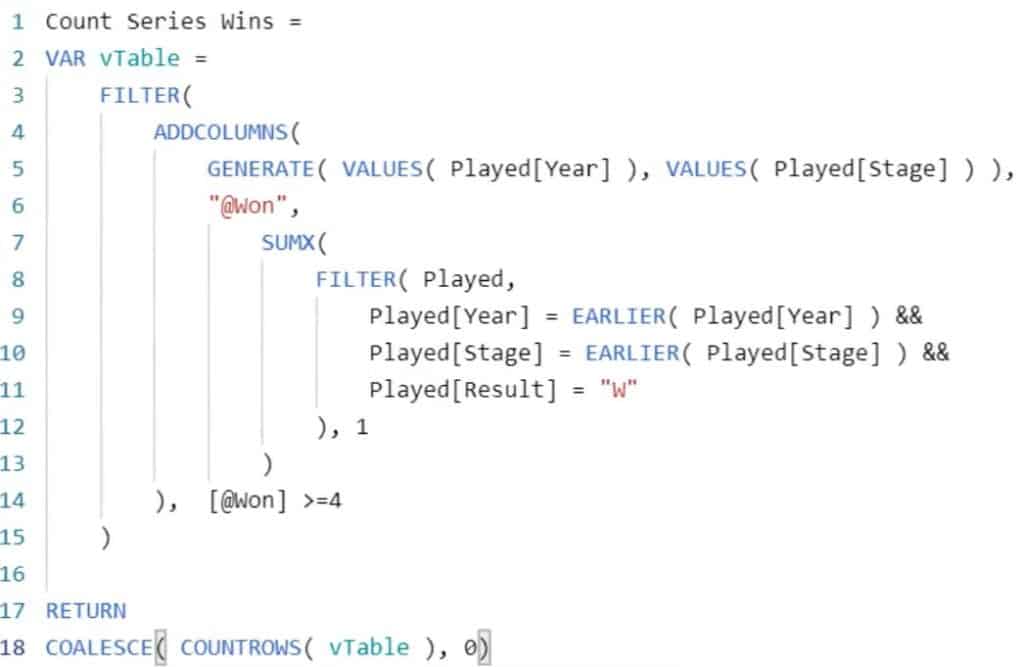
You can see that it uses nested FILTER commands, nested iterators, and some functions such as GENERATE, ADDCOLUMNS.
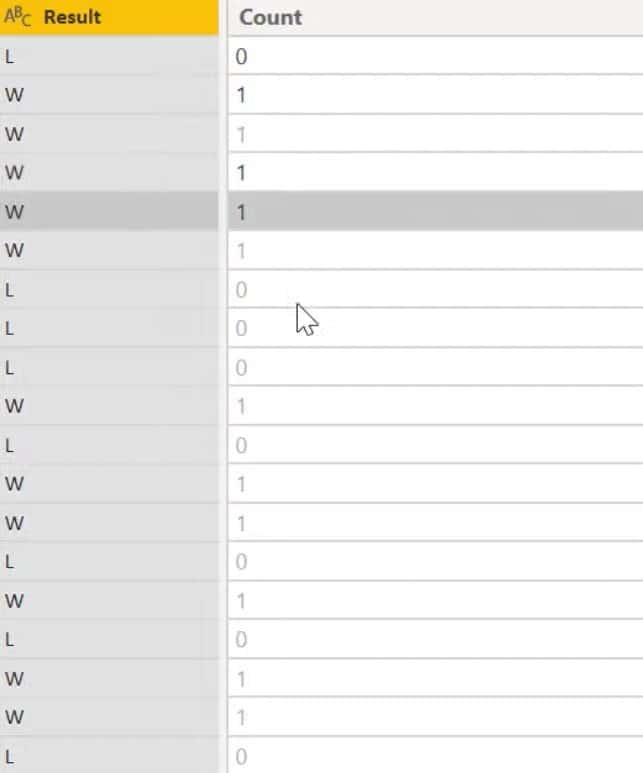
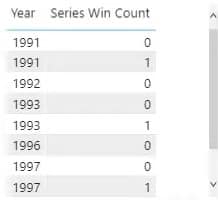
To do it in a power query, take out the wins and losses and convert them into a count measure.
Go to Add columns and click Column From Examples. Then, name the column Count. After that, assign 0 value for the losses and 1 for the wins.
The next step is to figure out the deciding game in each series which is always the last game played.

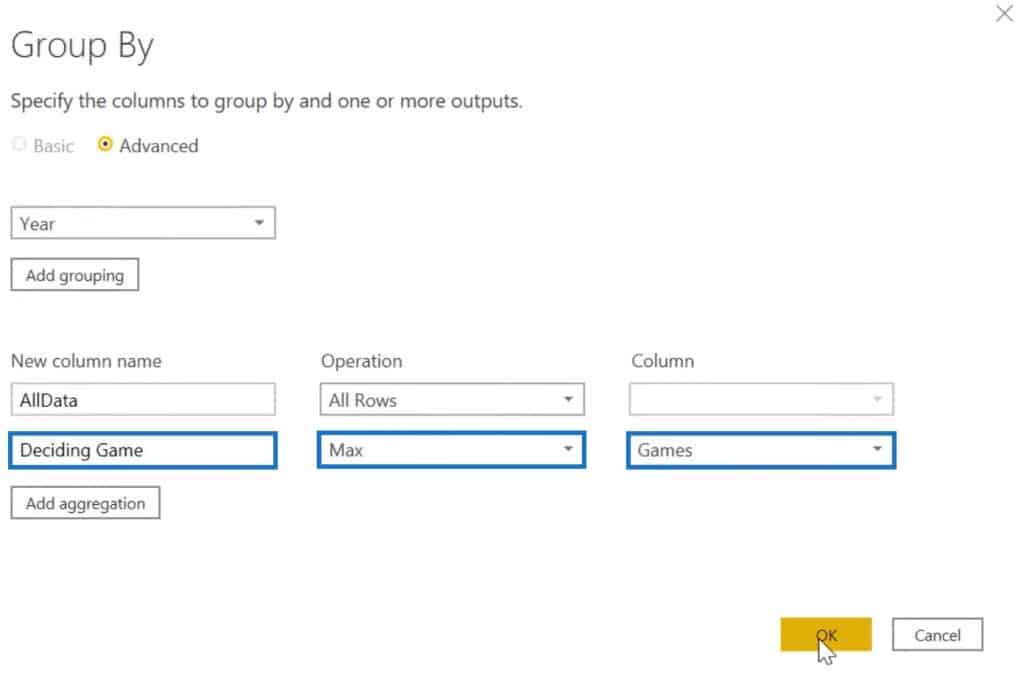
So, go to Group By and click Advanced. Group the Year and set the parameters.
Input AllData for the column name and set the Operation to All Rows. Next, click Add aggregation and call it Deciding Game. Set the Operation to Max and the Column to Games.
Once the columns are generated, expand the AllData column.
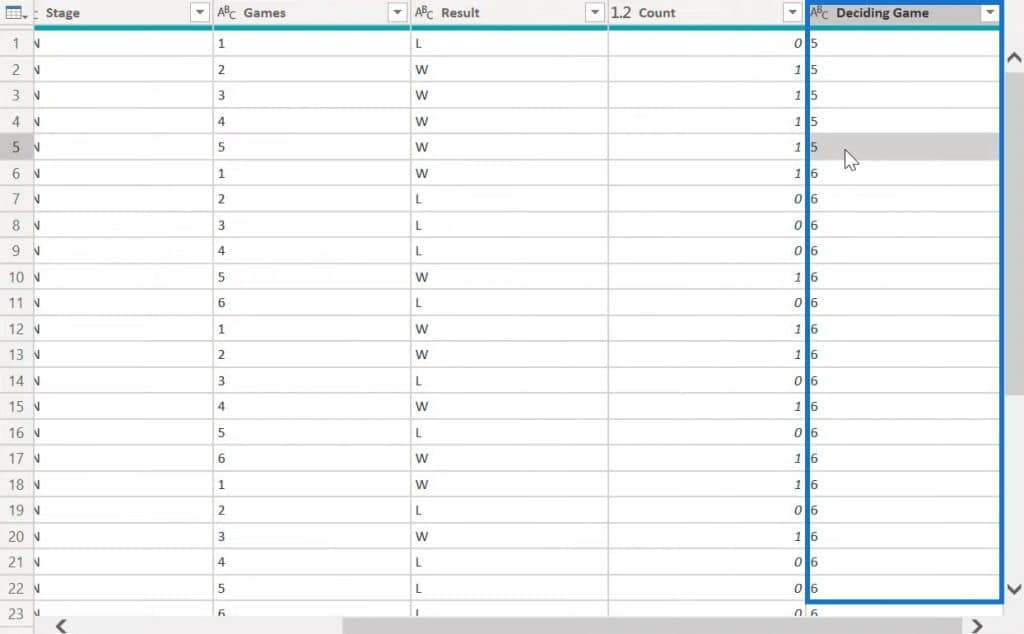
You now have the data for the deciding game.
The last thing you need to do is to create another column that returns the value of the Count column for the deciding game of the series.
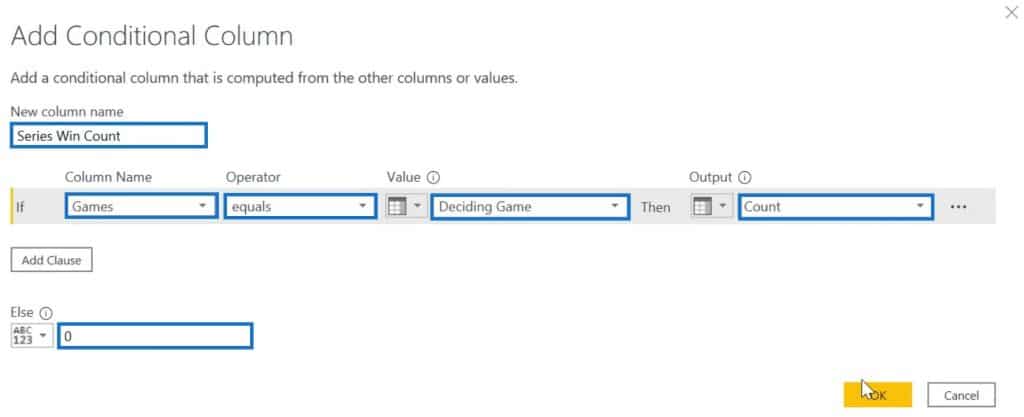
To do that, click Conditional Column and name it Series Win Count. Set the parameter to generate the Count column if the Games column is equal to the Deciding Game column. If not, it should return to 0.
Once done, go to the Home tab and click Close & Apply.
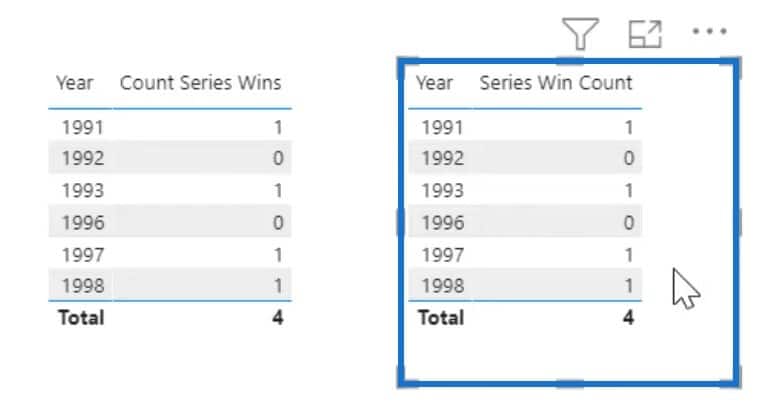
This is the table that was created using complex DAX measures.
Recreating The Basketball Record Table
Using this analysis, you can recreate the table.
Take the Year and Series Win Count columns into the dashboard and turn them into a table.
Make sure that the Year doesn’t summarize and the format of the Series Win Count as a whole number.
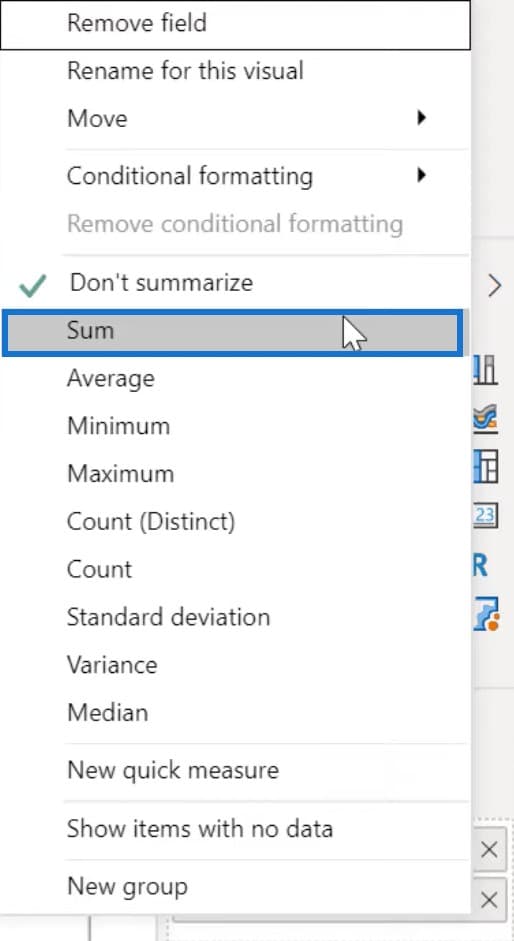
Next, get the total of the Series Win Count. Click the dropdown arrow of the column and choose Sum.
You can see that it has the same results without using a single DAX function.
In these two examples, you can see how the Group By function works when you combine it with the ability to either return the aggregate or return all rows.
It gives you the flexibility to tackle a wide range of group problems.
Conclusion
***** Related Links *****
Effective Ways To Use The GROUPBY Function In Power BI
Organizing Your Queries Into Groups In Power BI
Power BI Calculation Groups – DAX Tutorial
Group By is a highly useful power query function in Power BI. It has great potential in creating reports and visualizations.
If using DAX functions and codes is too complex, you can use the Group By function as an alternative. It helps generate valuable data for complex problems easily.
In this tutorial, we have shown how you can maximize the potential of the Group By function and apply it to your own reports.
Brian


