The ALLSELECTED DAX function inside Power BI is one of the more advanced functions that you can utilize within your reports and dashboards. You may watch the full video of this tutorial at the bottom of this blog.
ALLSELECTED DAX function is a derivative of the ALL functions. So there’s ALL, ALLSELECTED and ALLEXCEPT. They all do something similar, which is remove the context or filters. Here, we’ll focus on the difference between ALLSELECTED and ALL.
ALLSELECTED Vs ALL
To really show what ALLSELECTED can do, I’m going to use Cumulative Sales as an example.
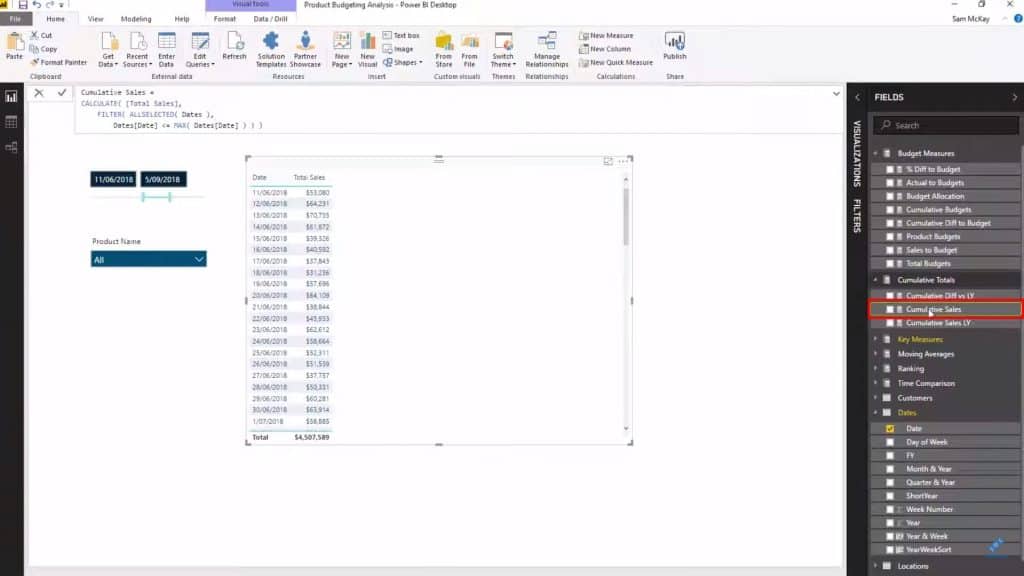
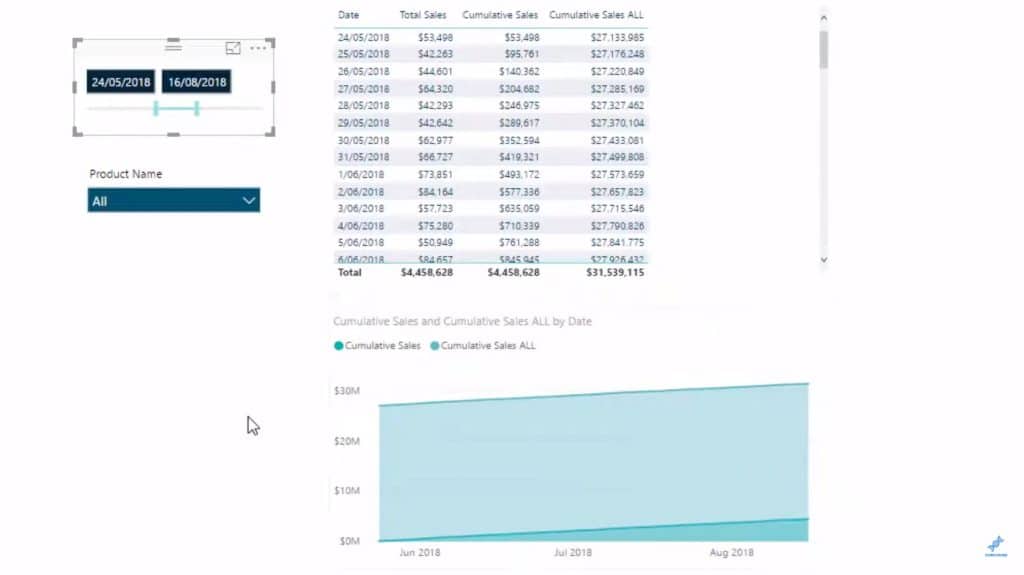
In this example, you see that I used ALLSELECTED DAX function to filter out a specific timeframe. So the total you see under Cumulative Sales shows numbers within that filter.
Now, let’s see what happens if I change ALLSELECTED to ALL.
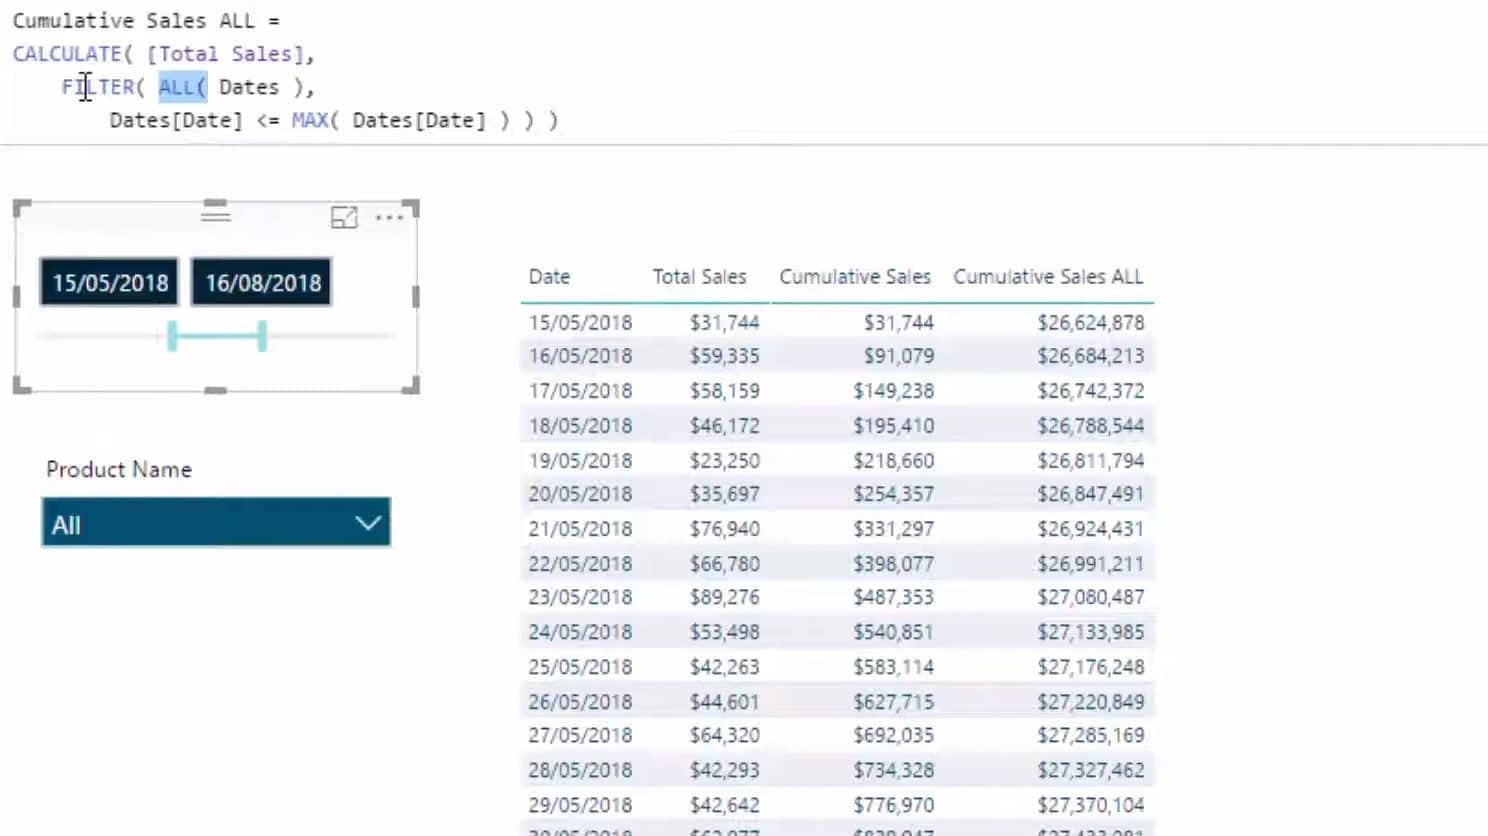
So the results under Cumulative Sales shows the total if you use ALLSELECTED. On the other hand, the column Cumulative Sales ALL shows the total if you use the ALL function. Looking at both results, you’ll see a huge difference.
Here’s what happened there. When we used ALLSELECTED, we wrapped our Dates table where the filter came from.
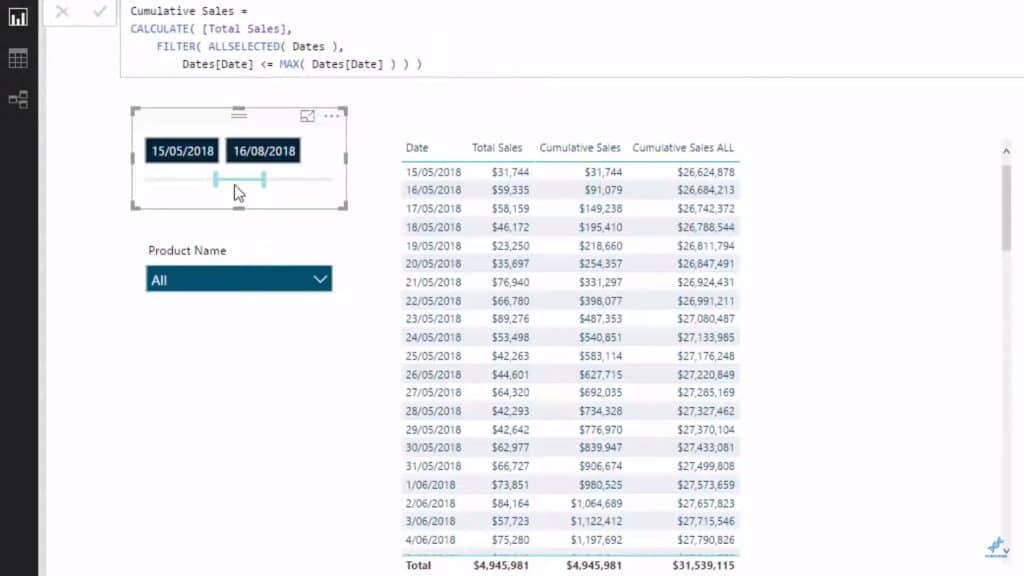
This means that the results are based on us removing some context from the overall data presented.
Importance Of Context In ALLSELECTED
So context is actually the key here. You have to understand context to understand ALLSELECTED. So, at the moment, our current context lies in the dates we selected. And whenever we change the date selection, the current context changes as well.
How is the context different when it comes to the ALL function?
With the ALLSELECTED function, you are only removing context within this particular date selection. But what ALL is doing is it removes all context regardless of the dates selected. That’s why we’re getting different results.
In other words, ALL looks at the complete set of data from the beginning to the end. It disregards any selection or filter you make within your report.
If we try and visualize that, you’ll notice the difference even more. This is what our Cumulative Sales looks like if you use ALLSELECTED.
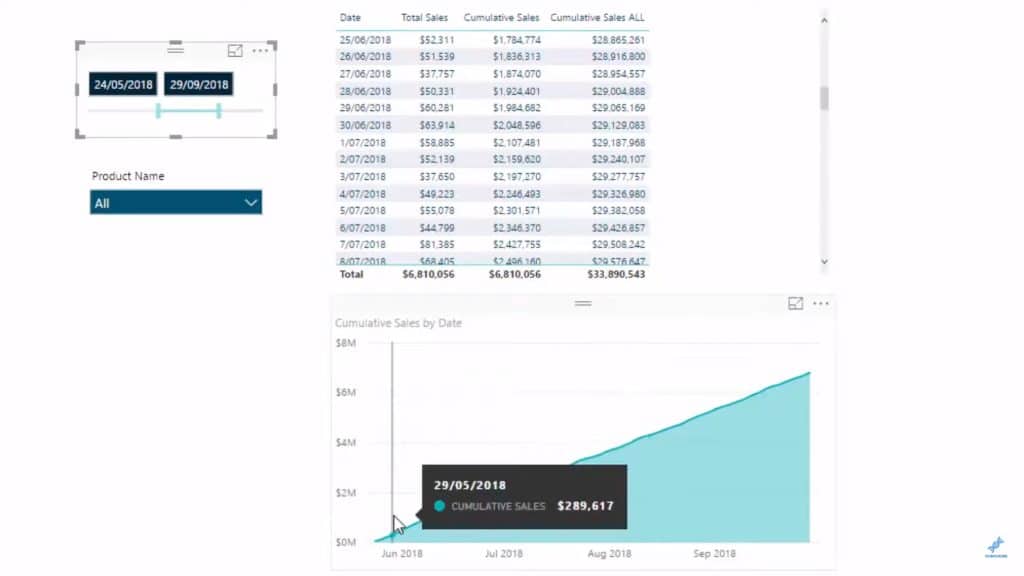
But if I overlay the results for Cumulative Sales using ALL, you’ll see that the number multiplies into a staggering amount.
***** Related Links *****
ALL Function In Power BI – How To Use It With DAX
Using The ALL Function In Power BI For High Quality Insights
Compare Cumulative Information Over Different Months In Power BI
Conclusion
We showed ALLSELECTED being used here as applied to Cumulative Sales over a given time period that I selected. But you can also use the same approach if you want to branch out and look at sales from last year, last quarter, etc. The bottomline is, you can use it to showcase information not from the entire data set, but within a selected time range.
As with a lot of other Power BI functions, ALLSELECTED can also be used in other ways. In working with Product Budgets, for example, you can apply SUMX to iterate daily data, then apply ALLSELECTED to adjust the results based on the dates even if there is no physical relationship existing in that particular model. This means that ALLSELECTED can be useful from a manufactured relationship perspective as well.


