
This blog post will show you how to use the ALL function in Power BI to effectively showcase unique insights and differentials in your numbers. You may watch the full video of this tutorial at the bottom of this blog.
We’re going to dive into the average order size for the sales we may be making across a variety of different products.
This tutorial will also show you how to use the ALL function and perform valuable analytical work from start to finish.

How To Get The Average Order Size
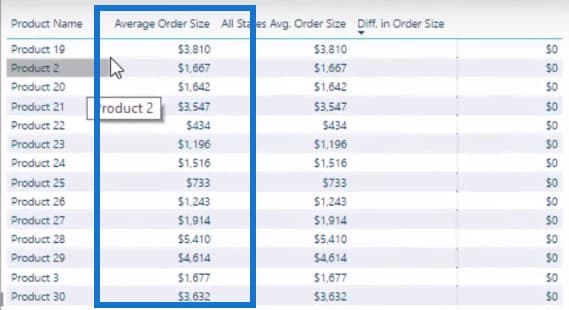
For this particular insight, we’re looking at the Average Order Size of our orders.
Let’s take a quick look at how we arrived at this formula. It’s not too difficult a formula because basically all we’re saying is for every product, we will look at every single order, which is what the VALUES function does.

Then by using AVERAGEX, we will be able to find the average sale we make on every single order.

This in itself is already a pretty decent insight. We can further improve the way this formula looks as well.
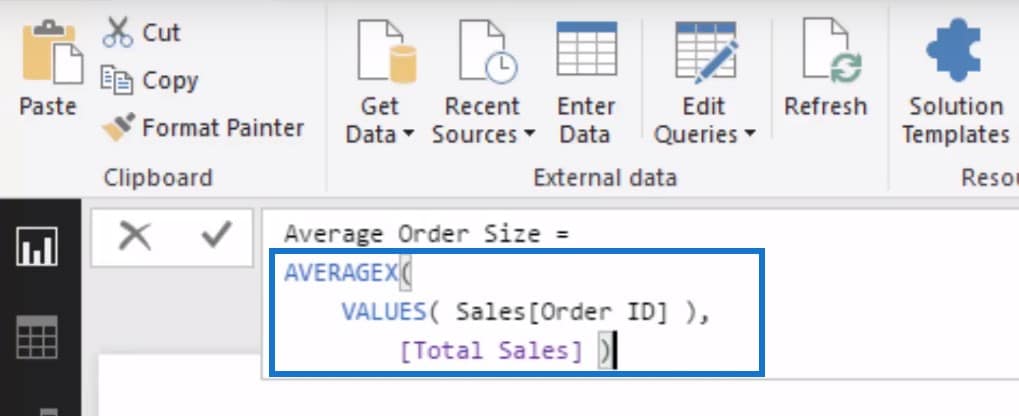
The goal is to get the Average Order Size. To do that, we need to iterate through every single order and then work out what the Total Sales was for that particular order. We will then get an average of it all using the AVERAGEX function.
How To Use The ALL Function in Power BI To Compare Average Order Size
To visualize what we’ve come up with so far, we use the CALCULATE function to determine the Average Order Size for all states.


What the ALL function does is instead of allowing a filter to happen, it removes the filter instead. We won’t initiate any filter for the State column no matter what happens in this report page.
Regardless of any selection we make, the numbers under the All States Average Order Size column will remain constant.
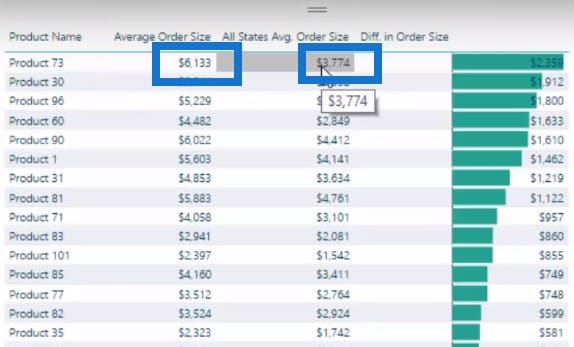
Let’s say we do not select any state in particular. Let’s look at Product 73 and see that the Average Order Size is at $3,774.
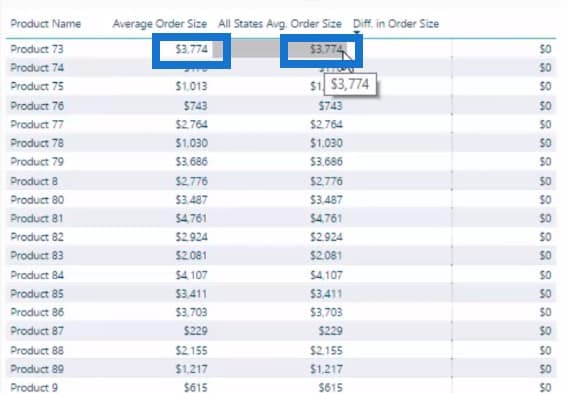
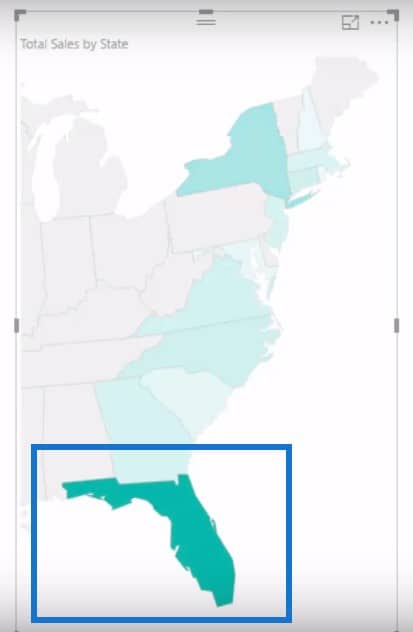
But once we select on a particular region, say for example Florida, we see that the number changes from $3,774 to $6,133 for that region. However, the Average Order Size for all states remain exactly the same.
How To Use The ALL Function To Differentiate Average Order Size
We can also use this new function (which uses the ALL function) to determine how much the difference is between a region’s Average Order Size and the Overall Average Order Size. All we have to do is reuse the measures using this formula:

Why Use The ALL Function in Power BI?
By using the ALL function, you can compare how one region is performing compared to the overall Average Order Size of the entire location.
If you’re selling to a lot of regions, chances are you might be making sales at varying average order sizes.
Analyzing why this is occurring is essential, with many gains to be made if you can work out why and then replicate these great selling regions to the poor selling ones.
For example, in the table below, Products 51 and 47 are selling at a much higher order size in Florida when compared to the average. Why do you think that is?
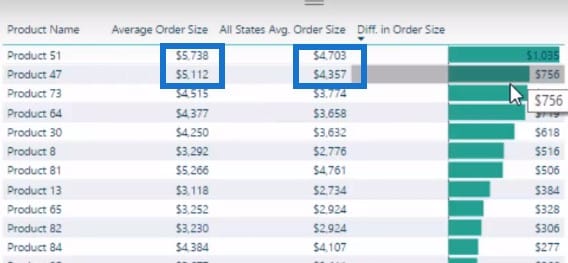
This is a really good insight to use in your business. You can determine why these very same products are selling below the Average Order Size in other regions. Factors like the weather or socio-economic background of your customers could be some of the reasons.
Conclusion
By comparing the Average Order Size of a regional selection to all the other regions, you will see the significant differences in terms of the price you are selling goods in one area versus the price you are selling across all the other areas.
This insight would enable any management team or leaders to understand the actual drivers of your business’ performance across different regions.
The ALL Function in Power BI is a really important function to learn if you’re just starting out with DAX. This function allows you to do a lot of analytical work that can be applied in many different scenarios.
Enjoy!
Sam
***** Related Links *****
ALL Function in Power BI – How To Use It With DAX
Deep Dive Into ALLSELECTED – DAX Function In Power BI
Deep Dive Into The CALCULATETABLE Function – An Important DAX Formula To Understand Well

***** Related Course Modules*****
DAX Formula Deep Dives
Mastering DAX Calculations
Financial Reporting w/Power BI
***** Related Support Forum Posts *****
Filter Function Inside CALCULATE
Top 10 DAX Functions For Beginners
Data Modelling – Table Function
For more filter function support queries to review see here….


