I’m incredibly excited about today’s blog because it’s going to show how the worst feature in Power BI currently is suddenly going to turn into the best feature. I’m talking about the Tabular Editor Power BI. You can watch the full video of this tutorial at the bottom of this blog.
I was fortunate enough to try the preview version of Tabular Editor 3 in December 2020 and get into the beta program. I’ve been using it every day now for the past few months and it has really revolutionized the way that I use Power BI. So, I want to take some time today and walk you through the basic features of the Tabular Editor Power BI version 3 (TE3). I’ll show you how I think it’s really going to change the way you use Power BI as well.

Tabular Editor Power BI Version 3 Features & Functionalities
Here are some of the basic features of TE3 that I found very useful and quite amazing actually.
Configurability
One of the things I want to cover is the configuration. As you can see here in Tabular Editor 3, we’ve got multiple windows and all of these are completely configurable. You can move stuff around. You can pull stuff out in a really intuitive way and develop new sections. You can resize them as well.
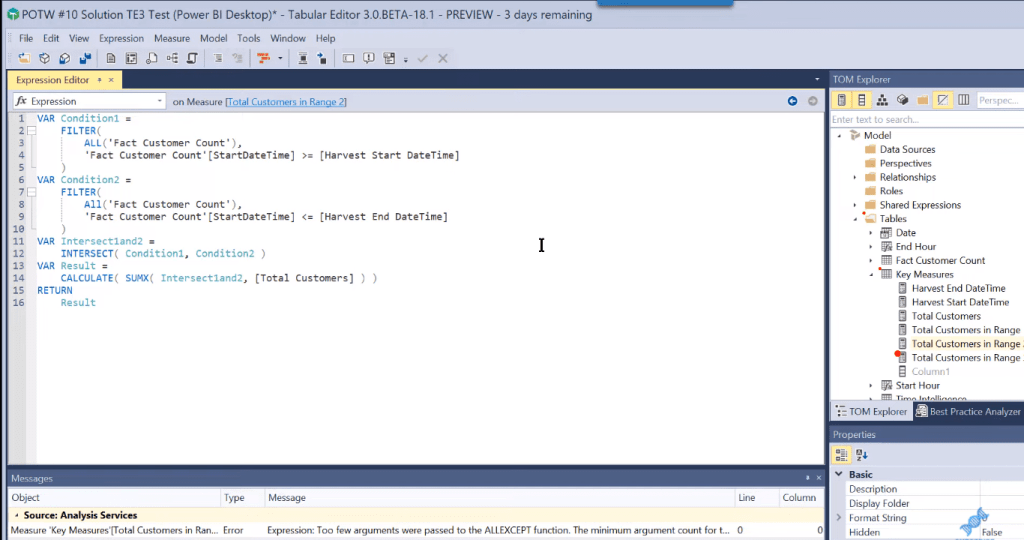
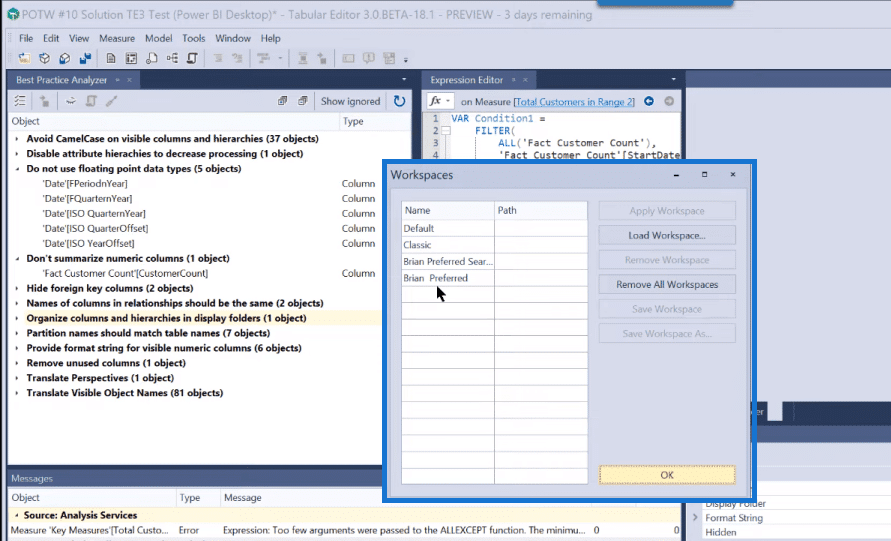
You can also save this in Capture Workspaces, and then save those to a list of available Workspaces.
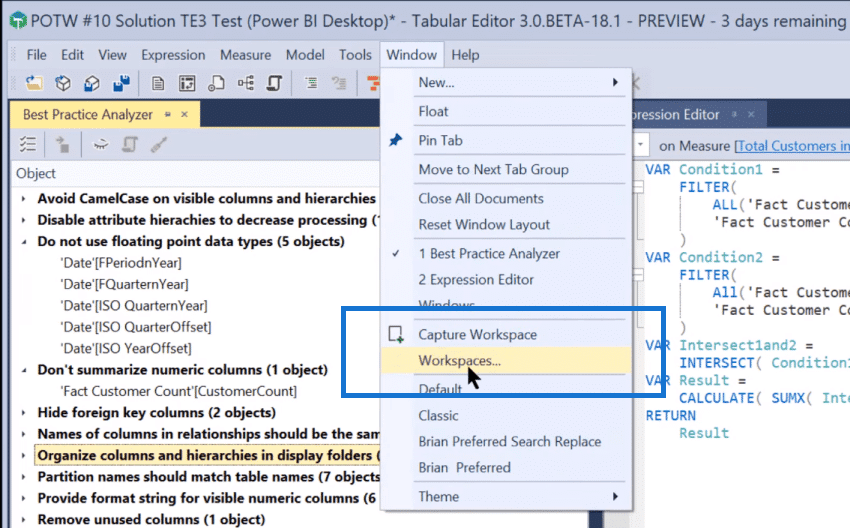
So, for example, you’re working at Best Practice Analyzer where you’re doing search and replace, you can pop into a different workspace if you’re editing measures. I found that to be incredibly useful.
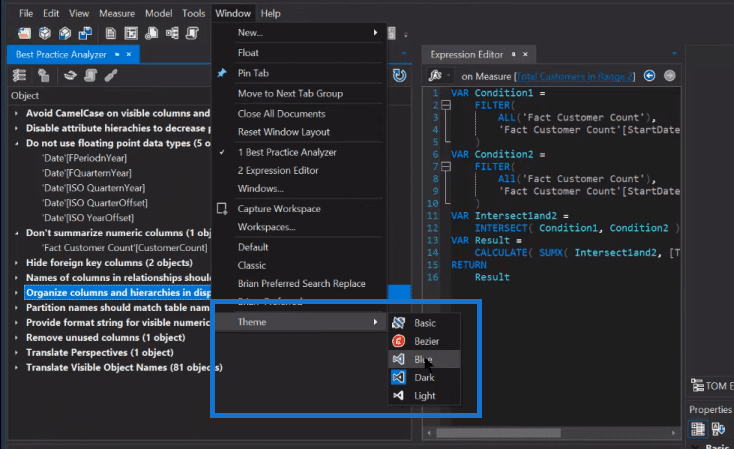
It’s also got a number of different themes. If you’re a dark mode fan, you can just pop right into dark mode. I like the blue one, just a personal preference.
All the toolbars are configurable. The menus are configurable. You can just get this working exactly the way you want it to work and feel comfortable working. Given the amount of time you spend in Power BI writing DAX, I think that’s pretty important.
Writing DAX
The next thing I want to talk about is how TE3 IntelliSense assists you in writing your DAX. As I pop in here to a new measure and start writing some DAX, you’ll see right away how this is a real improvement.
There are some nice small features here. For example, you don’t have to worry about control (ctrl), enter, or shift enter. You just hit enter and it moves you to the next line. And then, F5 is what would commit your code.
Here, you can see the standard IntelliSense and some additional information. It’s saying we’re in context transition mode. It also has a hotlink.
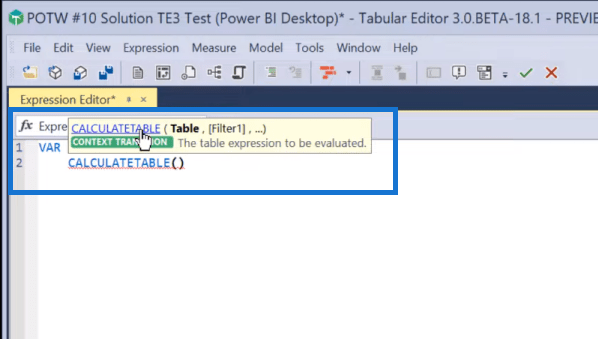
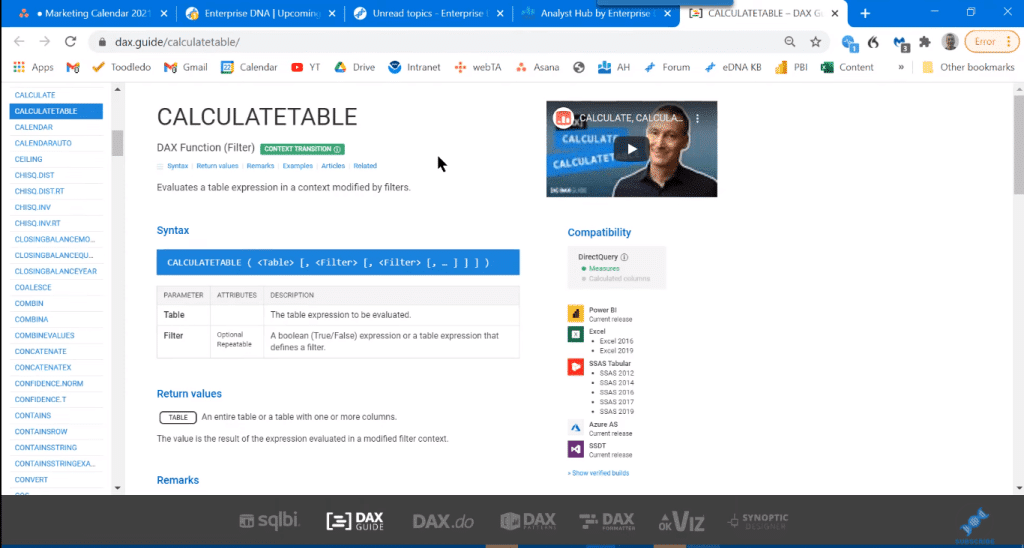
And so you can click on that link, which brings you right to the DAX Guide for additional information about the function.
It has a lot of background capability and knowledge built into it. One of the really clear things that you begin to see right off the bat is, in terms of error messages, the TE3 will pick up all the errors.
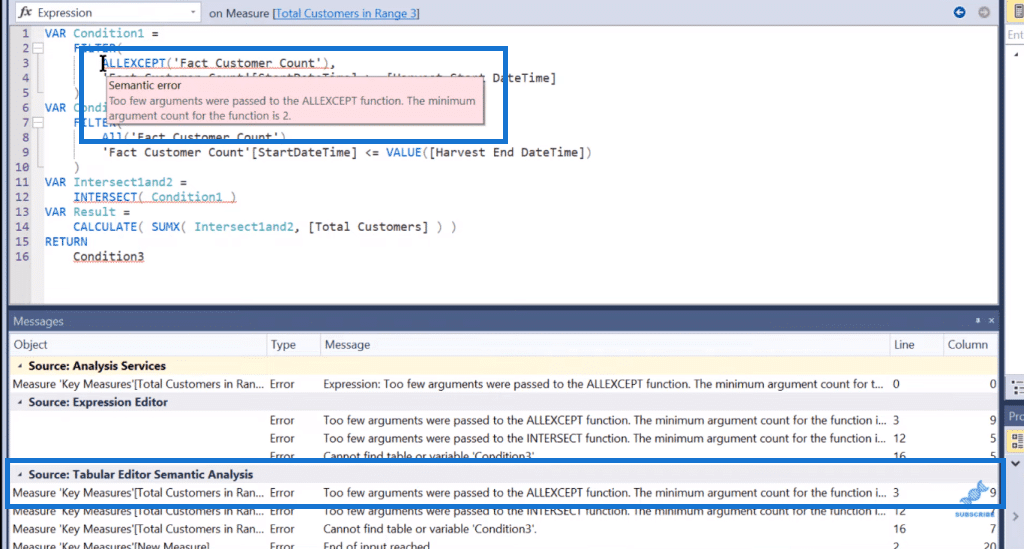
The regular DAX Editor will just pick up just one of these errors, as you can see here under Analysis Services. Tabular Editor 3, on the other hand, has what’s called the Semantic Processor for DAX, and it will pick up all the errors.

This will give you a lot more information about those errors. For example, if you look under Analysis Services (DAX Editor), it’ll tell you that too few arguments were passed to ALLEXCEPT and what the minimum count for the argument is, but it doesn’t know where that error sits.
The Semantic Processor, on the other hand, knows that it’s in line three (3), it’s in column nine (9), and it tells you right where it starts. It gives you a tooltip to explain the error, and it gives you all the errors that it finds in the expression. It really helps you in terms of debugging.
Cold Folding, DAX Debugging, & DAX Scripting
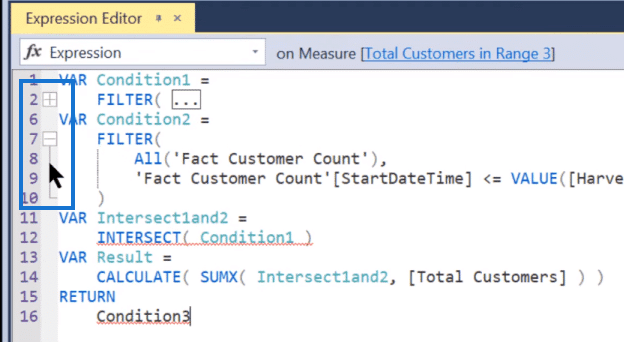
Another really nice feature is this thing called cold folding, where you can collapse your variables down and just get a better picture overall of what your measure looks like. This is really helpful particularly if you’re writing long measures that go beyond the screen.
It also works well for measure branching debugging. For instance, if you look here at say, Total Customers and you right-click on that measure, it’ll say Show Dependencies.
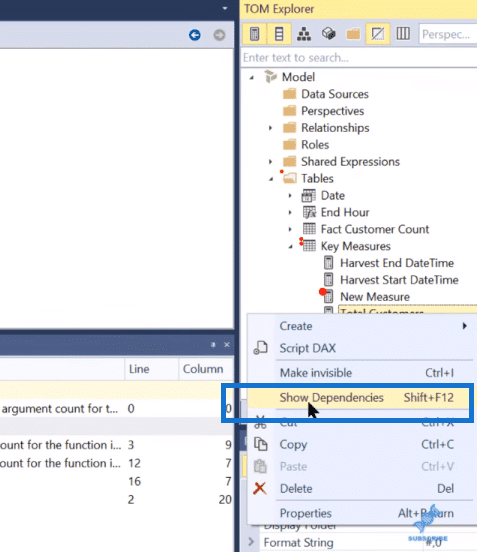
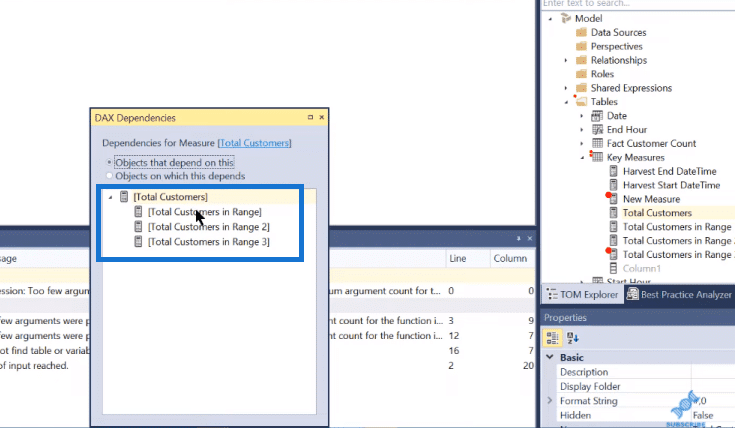
It will show you what objects depend on Total Customers and what objects it depends on. And so, what you can do is something called DAX scripting. This is a really interesting way of looking at our measure branching.
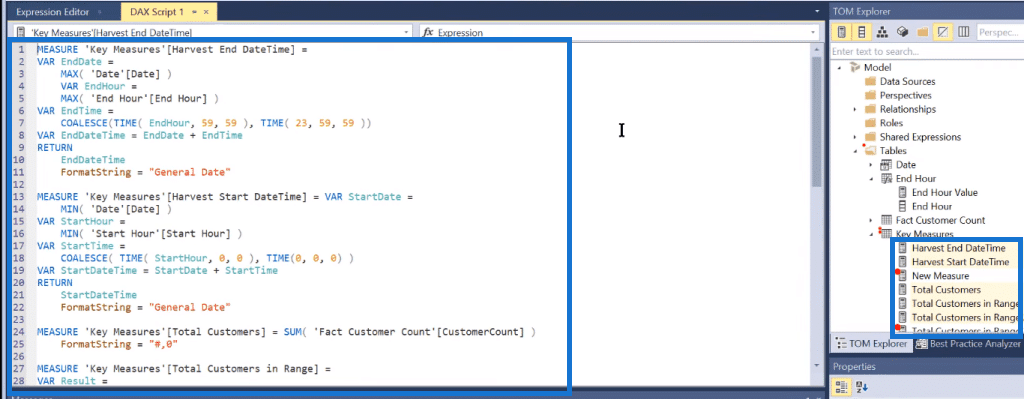
So, for example, let’s take these Slicer Harvest measures and our Total Customers in Range measures. If we click on this grouping, we’ll see an option called Script DAX. We click on that and it creates a script with all our measures in one place. We can edit this. We can look at it in terms of how the measures branch from each other.
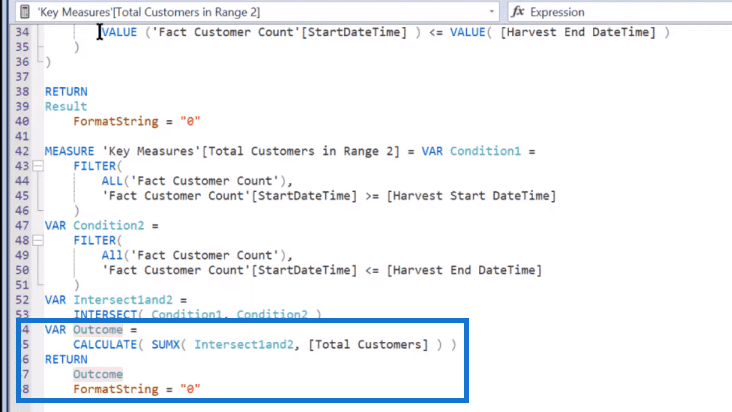
Furthermore, if we want to refactor this result, VAR Result, we can rename it. And what it’ll do is that it will rename in scope.
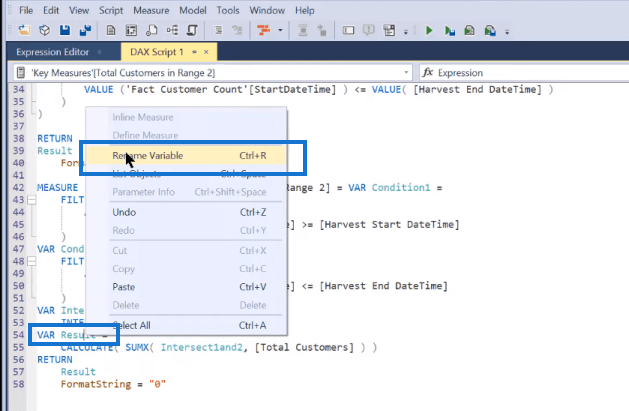
It tags both of these results at the bottom, and we can change them to say Outcome. We’ve now changed that in the code, but in the upper part of the formula, where we had Result as well in a different measure, it knew enough to keep that outside the scope. It’s much smarter than just your average search-and-replace, which would have gone through and changed all those Results.
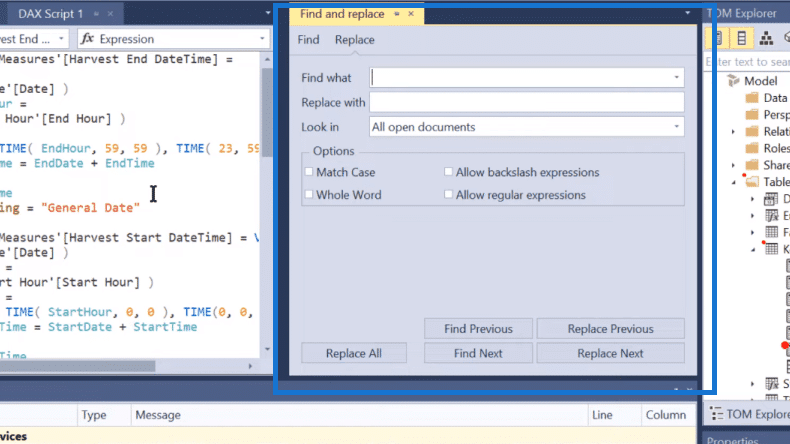
From there, you can then pop open the Find and replace window. Through the workspace functionality, we can create a window for that, and then go through this here and do any sort of case matching or whole word matching, find all, find previous, edit this down, etc., either in the single measure version or the script version. Hit control S and it saves that back to the Power BI model.
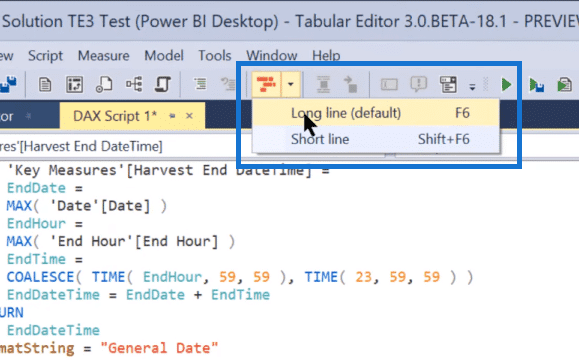
Moreover, we’ve got a built-in formatting for our DAX, so we can format the script as well.
Previews, Pivot Grids, & Data Query
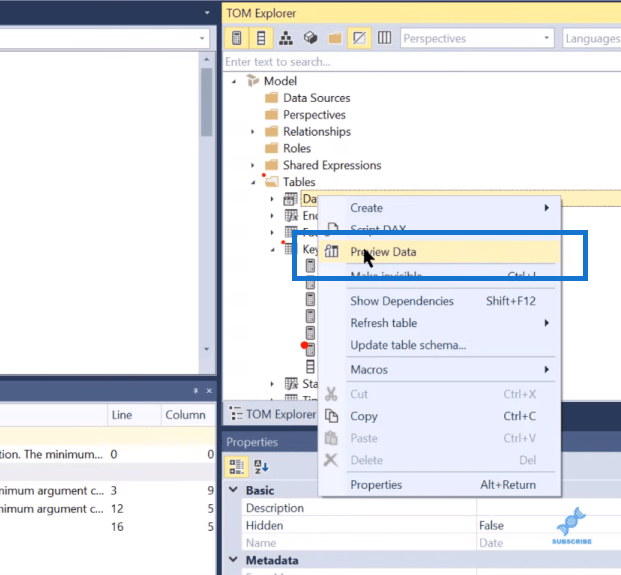
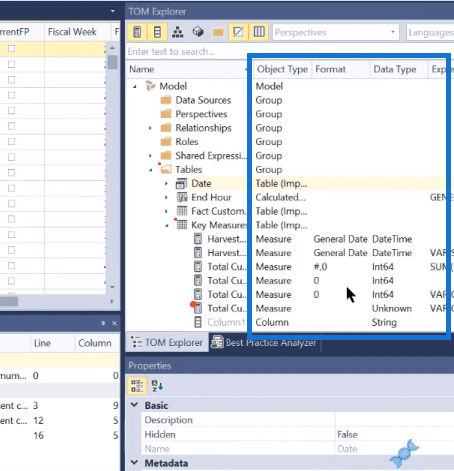
There are a few other things we can do here. If we want to look at our tables, we can do a simple preview, going through and looking at each of the fields in the table.
We can also pop up the information column on the right side for review.
The other thing that we can do is Pivot Grid. That’s basically the equivalent of a pivot table in Excel or a matrix in Power BI. It’s something fairly similar to the matrix visual. Simply drag and drop the variables into the table.
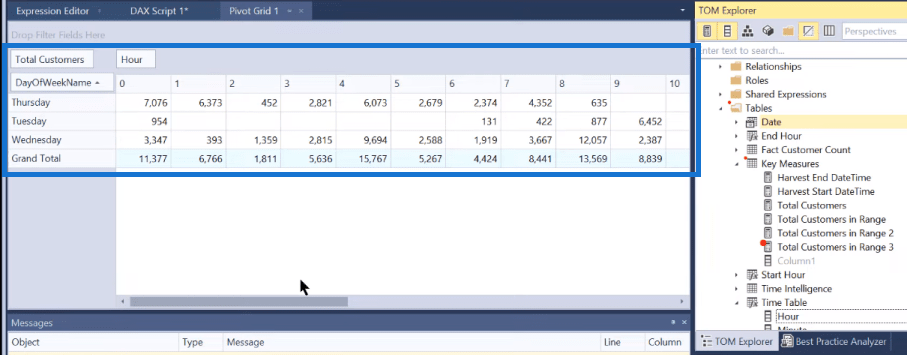
We can use this to do a validation of our results. It’ll run row totals and column totals. It’s a lot easier than creating a bunch of extraneous tables that actually physically reside in the model.
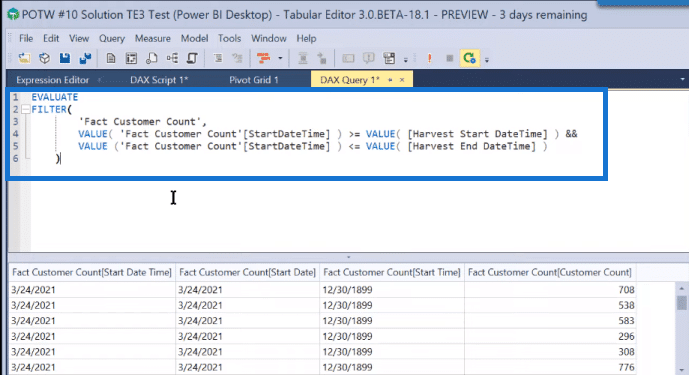
There’s also another huge feature here, which is the DAX Query. If you work in DAX Studio, you’re going to be very familiar with this. Here, we can materialize tables.
Let’s take this FILTER function, for example, and we want to analyze it, we can put it into a query.
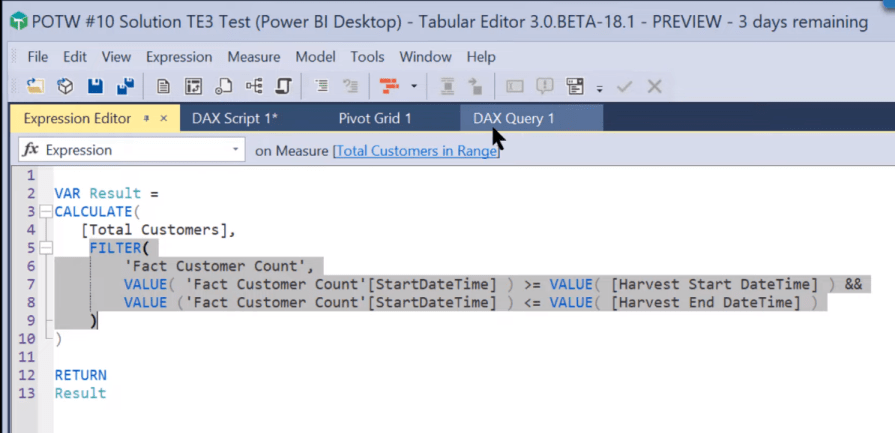
Remember that queries always start with EVALUATE, and then we paste that measure in here. This is a really great function for debugging.
Scripting & Macro Recording
The next thing that I want to cover is scripting. I want to show you the automated scripting feature here in Tabular Editor 3. We can write some basic code here or copy and paste some measures from the Analyst Hub.
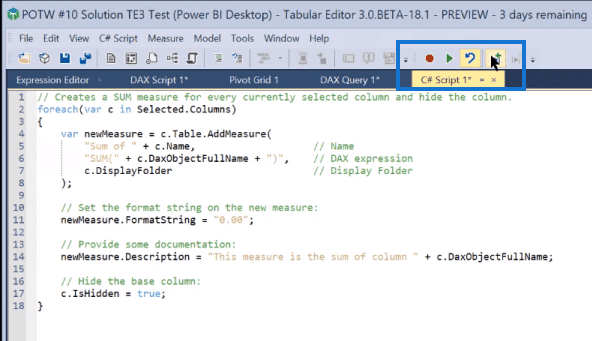
And then, just hit Save as Macro.
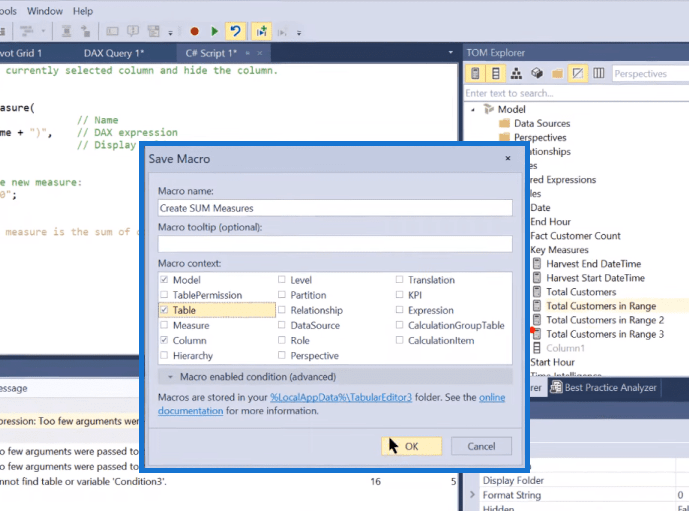
To apply these macros, just go to the proper scope, whether that’s model, table, or column. Then, just right-click and then select Macros; after that, just apply the appropriate script.
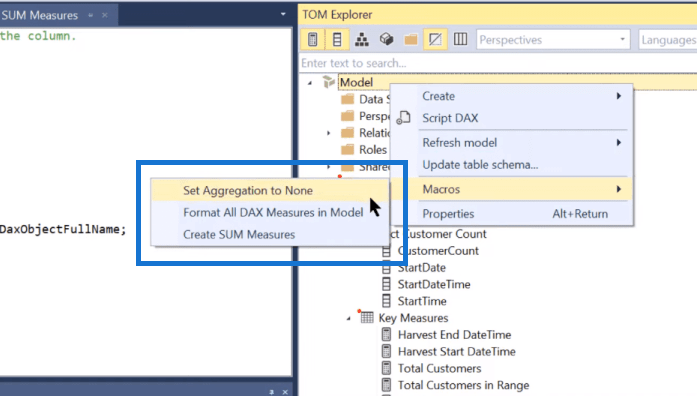
And so, if we go format all DAX, for example, that then formats all of our DAX, using the DAX format or based on whether we’ve chosen long line or short line. We just hit control S to save that back to the Power BI file.
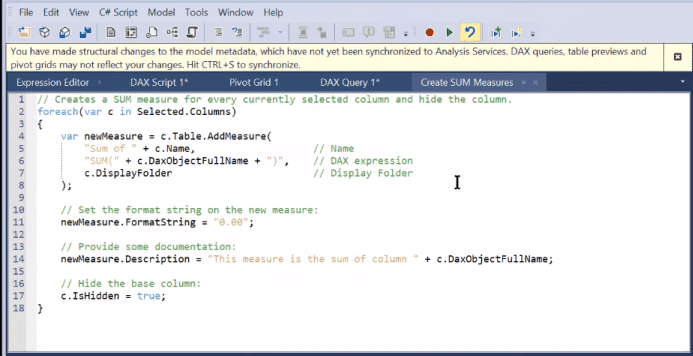
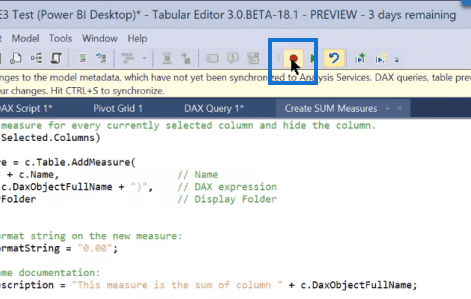
Lastly, the TE3 has Macro Recorder, wherein you can turn that on, perform the function you want to automate, and then use the code it creates to create that script without knowing a lot of coding yourself.
Tabular Editor Power BI Best Practice Analyzer
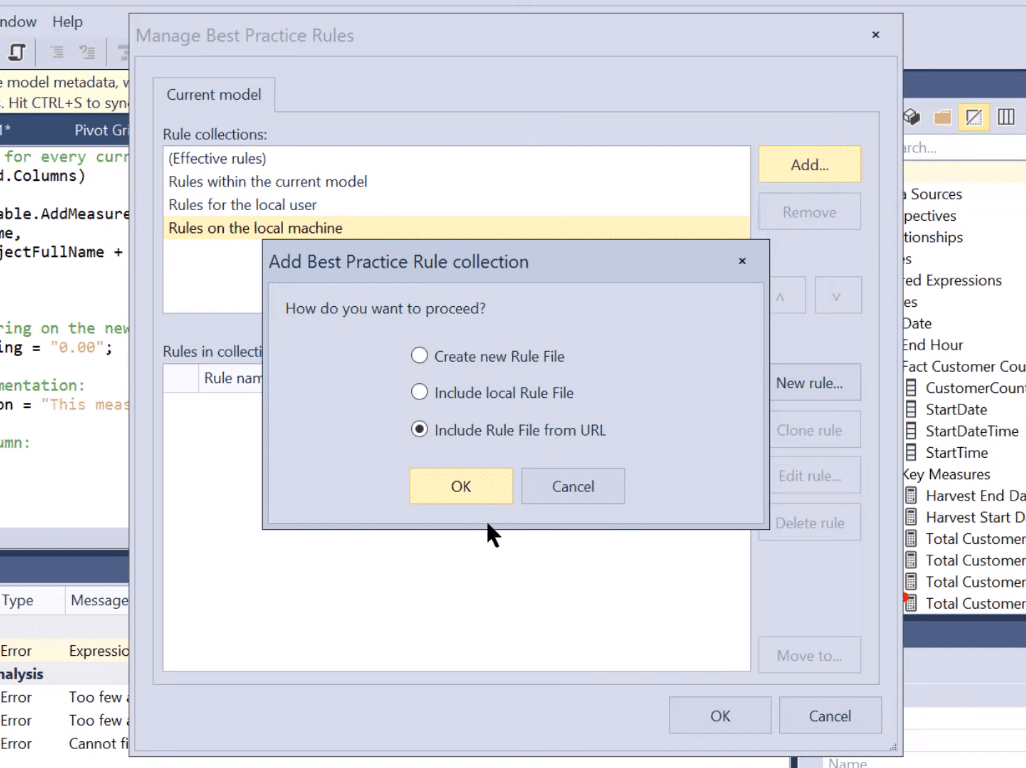
One of the really cool things in TE3 is that it’s got a best practice rule set. And so, let’s open the Best Practice Analyzer. It has rules for Local user, rules for Current model, and rules for Local machine. Let’s add that in, and then we can say Include Rule file from URL. We then paste a URL from the Analyst Hub.
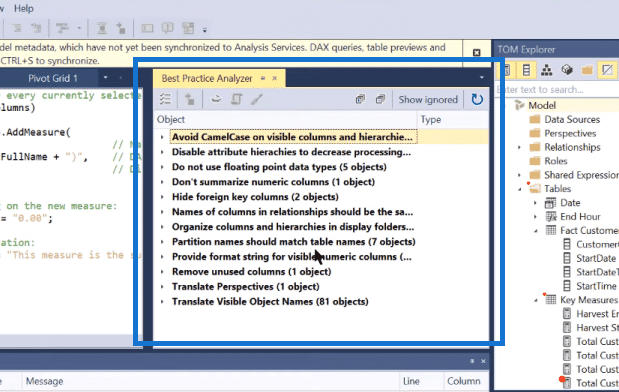
It then pops open a whole series of rules for best practices.
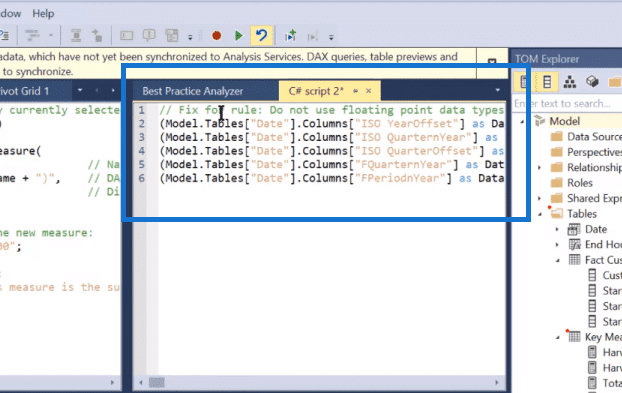
You can then hit run, and it’ll run that script, make the changes to your model, and implement the best practice.
This is an amazing way to improve your data modeling by just having it automatically go through, rule by rule, table by table, and highlight areas where you’re not conforming to the best practices.
***** Related Links *****
Use Tabular Editor To Create Calculation Groups In Power BI
What Is DAX Studio In Power BI Desktop
Level Up Your External Tools Menu In Power BI
Conclusion
This is a very quick tour through the Tabular Editor Power BI version 3. There are many more functions that we haven’t covered. We have some data modeling features, so you can diagram your data models and work with your relationships. There are partitions where you can actually look at your M code, etc.
There’s an amazing array of features here, and we’re just scratching the surface here. But, hopefully, you can really see the way this provides you with expanded functionality and tremendous capability in terms of writing DAX, debugging DAX, and improving your data models. It will also help improve your general understanding of what’s going on within your measures and tables. Thanks to the incredibly talented programmer, Daniel.
I hope this information gives you some courage to test it out. See what you think, and see how it changes the way you use Power BI.
All the best!
Brian


