Power BI virtual table is my personal favorite DAX topic. They’re the key to unlocking the full power of DAX. Virtual tables are the only type of tables within Power BI that are fully dynamic, and there are problems that can only be solved by applying virtual table techniques within your measures. You can watch the full video of this tutorial at the bottom of this blog.
In this tutorial, I’m going to share my top 5 tips and tricks that I’ve accumulated over the years that really have helped me understand and debug what’s happening within Power Bi virtual tables.
The example I’m going to walk through today is from the Enterprise DNA forum, and it comes from a member named Dave C, who works in industrial safety. Dave had a series of safety scores and he wanted to normalize those so that the top score was 10, and then dynamically come up with the Nth in that list.
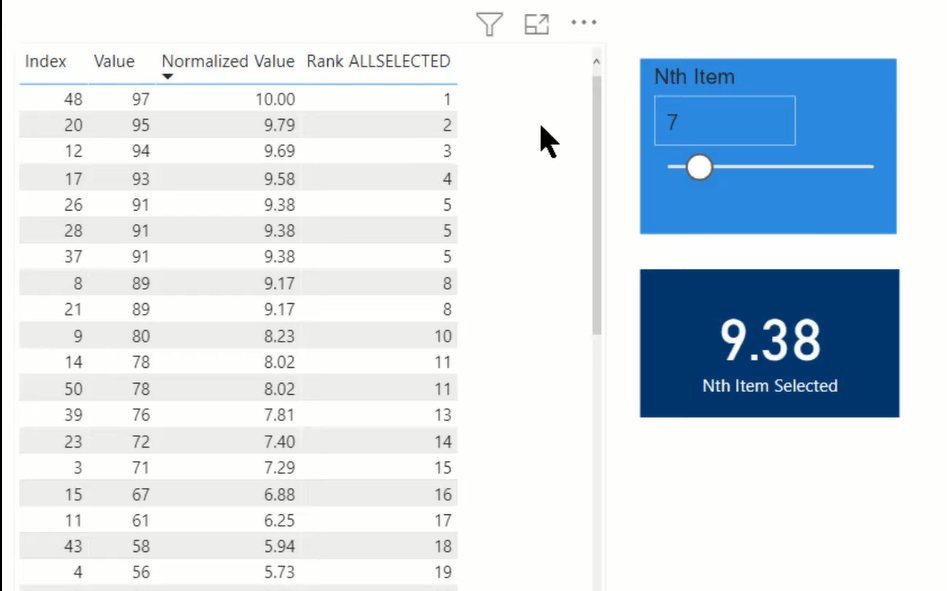
Initially, we thought of doing this through a simple RANKX measure, but we later realized that a lot of his normalized values have ties. For example, if you want the seventh item on the list, there’s not going to be a number seven in a RANKX. There’s no easy way to pull that out of a filter condition. So we decided on a TOPN-based measure so that it would always count down the nth number.
This is akin to when you’re pulling the seventh card from a deck, you count out seven cards, and then you flip over that stack of seven, and the card on the bottom is the one you want. We’re going to do the equivalent of that in a TOPN measure.
Tip #1: Use An External Tool To Visualize Your Power BI Virtual Table
You can use DAX Studio or the Tabular Editor. In this example, I’m using the Tabular Editor 3 (TE3). It’s technically possible to do this using the Modeling – New Table tab, but that’s going to create physical tables within your data model. You’re going to have to manually flip between that and the editor and it’s just a slow and difficult way to do it.
When you see the dynamic way in which it can be done through an external tool, you’ll see the benefit.
So within the TE3, we create a new DAX query. We can take our initial measure and copy this over to our DAX query.
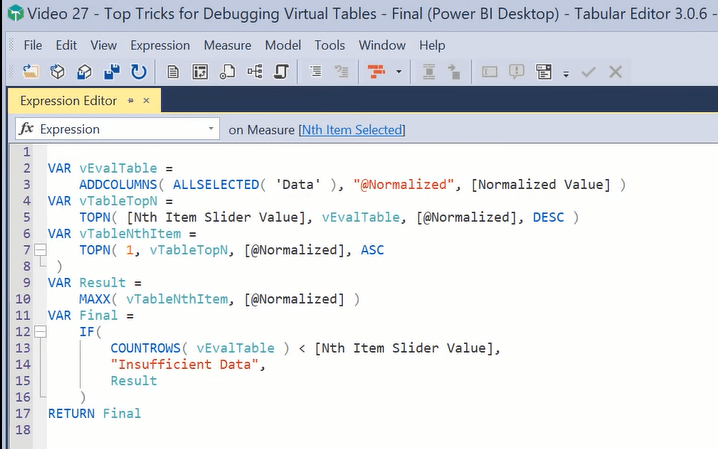
If you remember, DAX queries always start with EVALUATE. We’re going to get an error initially because DAX queries return tables. This was a measure with the last two variables that are scalars. What we can do here is change the return value, which is my next tip.
Tip #2: Debug Your Power BI Virtual Table In Parts Using Variables
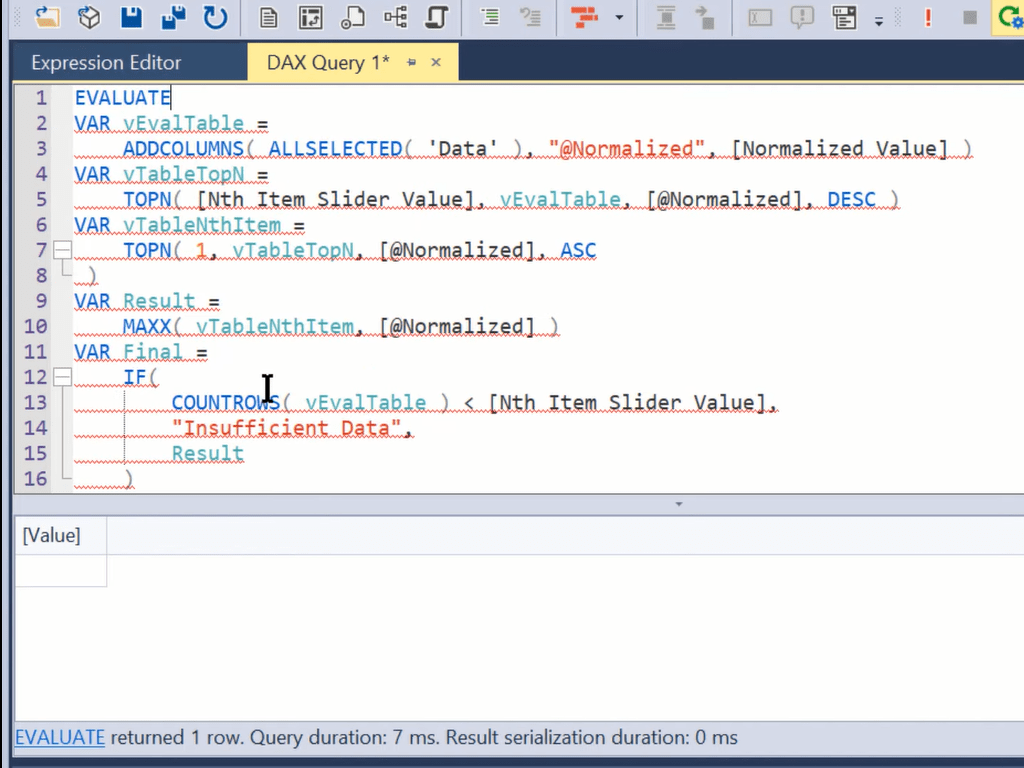
You can debug virtual tables in much the same way as you do with measures – piece by piece, by changing the return value. Let’s start with the first virtual table, the vEvalTable. We simply replace the RETURN value (Final) with our first variable (VAR). And you can see that the error goes away because the DAX query is now getting a table.

In the vEvalTable, we’re taking the original data, which are the safety scores, and we’re normalizing those and adding that Normalized Value column to the virtual table. We’ve got the Index, the Value of the Region, and the Normalized value. We can sort these values up or down and filter the values as well.

This is giving us exactly what we’d expected. It returns 50 rows, which is the full data set. That’s all going well, so let’s go down and explore the next table, which is the vTableTopN. In this table, we’re taking TOPN using the nth item slider value. In this example, we have that seventh value of the virtual table above (vEvalTable), and we’re taking that TOPN based on the normalized value in descending order.
So, when we change our RETURN function into that, it falls off and we don’t get anything. Let’s take a look at why because this is a really important concept for debugging and understanding virtual tables.

If we look at the formula, we have the Nth Item Slider Value as the main suspect here. Back to Power BI, we can see that this is basically just harvesting the number seven. Note that sliders exist within the context of a page.
And so, in this case, when we’re looking at debugging that table out of context, that selected value has no context around it. It doesn’t have anything in terms of being able to pull that number. We were getting a TOPN, but we don’t know what the N is in TOPN because that selected value is returning a blank.
How do we handle that? Let’s look at the selected value measure. Most of the time, we always pay attention to the first parameter in SELECTEDVALUE, but there’s a second parameter, which is an alternate. This brings us to my third tip.
Tip #3: Use The Alternate Parameter In SELECTEDVALUE
What happened here is that it has been pulling the blank as the alternate. But what we want to do (for debugging purposes) is that we want to put a real value in here. So, we put the number 7 and save that.

Now we have some values. It’s returning seven rows, which is exactly what it should because of that TOPN value of seven.

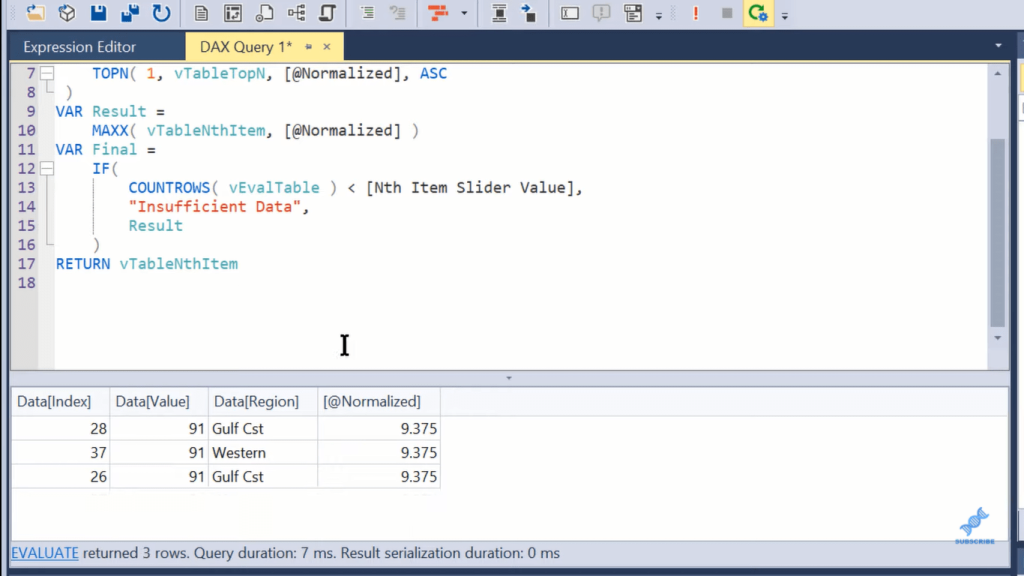
Let’s continue down the line to the next virtual table, which is the vTableNthItem. We’ve got that stack of seven cards, and this table is basically flipping it over. We were in descending order in the previous table, and now we’re in ascending order.
If we take and copy this down to the RETURN section, we get the results. It’s interesting that it’s not returning one row. It’s returning three rows because these three are tied. That’s exactly the reason why we use TOPN rather than RANKX, in this case.
Now let’s go to Result. If we copy the VAR Result down to the RETURN section, this gets to my fourth tip.
Tip #4: Use { } To Turn Scalars Into Tables
Within the formula, we’re taking the max (MAXX) of that vTableNthItem and we’re returning the normalized value. This could be MAX, it could be MIN, it could be AVERAGE. It’s just some aggregator that’s returning that one value in that table. And so, if we copy this down, it’s going to give us an error because this is now a scalar.
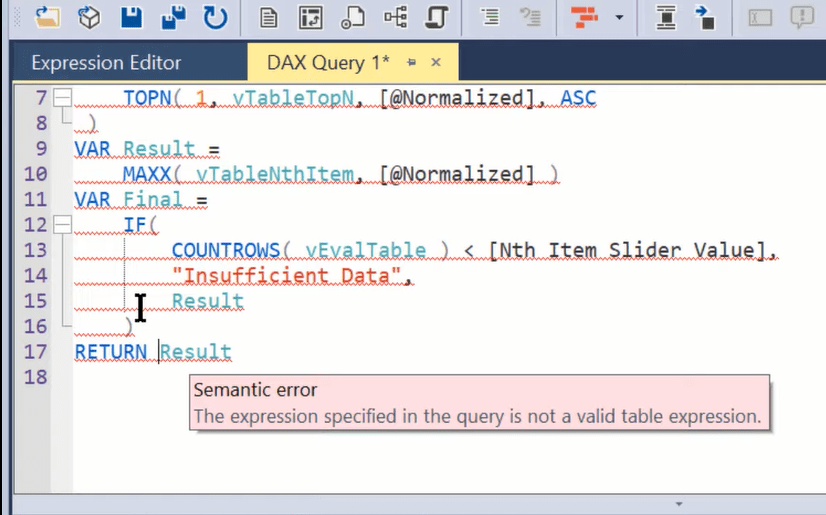
But this is my fourth tip, which is in the context of debugging. What you can do is just add the curly brackets. By doing so, it turns that scalar into a table.

And then, what we’ve got here is just a final error check, which is if it turns out that the evaluation table is smaller than the number of rows, it will return insufficient data. But we know in this case that our data set is big enough. However, we can just test that by typing in Final. Again, because that’s a scaler, we also need the curly brackets, and we get the same value here.

We’ve delved in and debugged this virtual table, and we’ve used the alternate value in the SELECTEDVALUE to keep it from falling over out of context. Now I just want to show you one additional tip that I found really useful.
Tip #5: Use CONCATENATEX/UNICHAR To Turn A Table Into A Scalar
In the context of doing your debugging, you’re going to want to see in Power BI what that table looks like. The general rule is that a measure can only return a scalar, not a table. But, there’s one cheat that I’m going to show you that allows it to quasi return a table.
Let’s take a look at this measure, which is Visualized Virtual Table, and we’ve got here all the virtual tables that we had initially. For example, we want to display, let’s say on the front report page, the vTableTopN.

You can use this CONCATENATEX function. You can actually take that virtual table name (vTableTopN) and take the values in that table and concatenate them. You can create something that basically looks like a virtual table.

If we take this measure, we need to go back to Power BI and drop this into a card measure. Typically, the table gives an error, but through CONCATENATEX, it turned that table into a scaler. You can see that it’s fairly primitive, but it’s returning exactly what we expect and it’s doing so in a dynamic way.

It is a way to push a table into a measure and show that in your report. It’s a really helpful debugging trick. It will provide a good format in a card value that you can use in a report.
***** Related Links *****
Master Virtual Tables In Power BI Using DAX
Virtual Tables Inside Iterating Functions In Power BI – DAX Concepts
Tables In Power BI: Types & Distinctions
Conclusion
Hopefully, this tutorial gives you some food for thought in terms of working with a Power BI virtual table. These are some additional tips and tricks for understanding what’s going on within your virtual tables. I hope you found that helpful.
Visit our website for more Power BI tutorials and check out the links below for more related content.
All the best!
Brian
[youtube https://www.youtube.com/watch?v=hU6uiZTk64E&w=784&h=441]


