In this tutorial, you’ll learn about the Preview Data option in the Tabular Editor. You’ll also learn how to efficiently use it to obtain certain data from large tables and reference it when writing scripts, DAX codes, or measures.
Opening Preview Data In The Tabular Editor
If you want to view the data of a table, right-click on a table in the TOM Explorer and select Preview Data.

These are the data of the StoreLocations table.

With the Preview Data option, you don’t need to open Power BI to check the contents of a given column or row. You can see the data in the Tabular Editor while you are scripting your DAX or writing C# scripts.
Creating Filters For The Tables
You also have the option of playing with the preview data tool. If you click the filter icon on a header, you can filter the table.

In this example, the State column is filtered to show only Alabama, Arizona, and Arkansas.

If you want to remove the filter, click the icon on the header again and select Clear Filter.

You can also pass Text Filters to limit the data you are viewing.

A custom filter can also be created inside the Text Filters option. The table will only show the data based on the parameter set in the filter. In this example, only California appears in the data table.

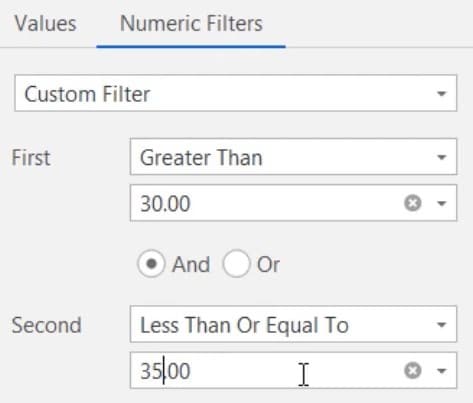
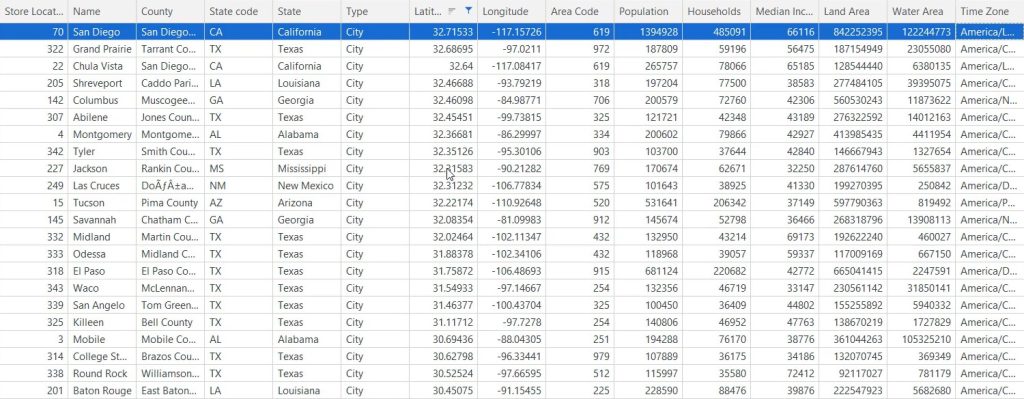
The same filter can also be applied to any numeric column. In this example, the Latitude column is filtered to show all latitudes between 30 and 35.
Sorting Tables In The Tabular Editor
If you right-click the header, you can see options to sort your column. Multiple columns can be also sorted simultaneously. Do this by holding the Shift key and selecting the columns you want to sort.

The Best Fit sort option adjusts the width of a column depending on the size of its value. In the Time Zone column, you can see that the values inside each cell are incomplete.

With Best Fit, you can now see the whole value or text inside the cell.

The Show Find Panel lets you search any value in the table by typing a text or keyword. In this example, the keyword used in the panel is Florida. The editor then shows and highlights all values containing the keyword Florida.

To remove the filter, just click the clear icon in the panel.

Viewing Multiple Tables
The Preview Data option also allows you to open and view multiple tables. This makes data development convenient because it saves you time from individually opening and checking tables in Power BI.
Small delays sometimes occur when switching between different tables in Power BI especially if your model contains a lot of rows and measures. Delays also occur when there are a lot of visuals imported from the marketplace. Eventually, these delays refresh the analysis services and make them slow.
The Preview Data option will not slow down the process. Using this tool, you can easily switch between tables in the tab.

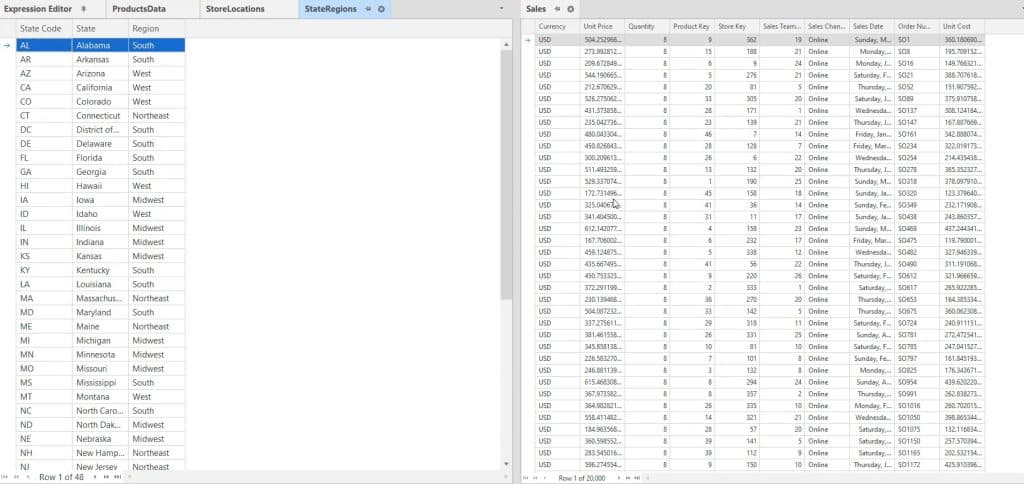
If you want to perform a data analysis between StateRegions and Sales columns, you can identify a particular column in both tables that can be used in creating a relationship. Then, you can filter and group them by different fields within the two tables.
Opening a table on a different window is also possible. If you have a dual monitor setup, you can drag and place a table on your second screen and open another in your main screen. This way, you can look and compare the values of both tables side-by-side.
However, if you only have one monitor and you want to compare tables side-by-side, you can place them adjacent to each other. Do this by dragging and dropping the tables to each side of the editor.
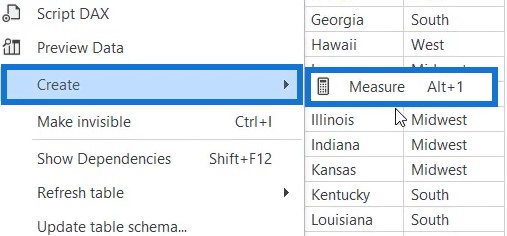
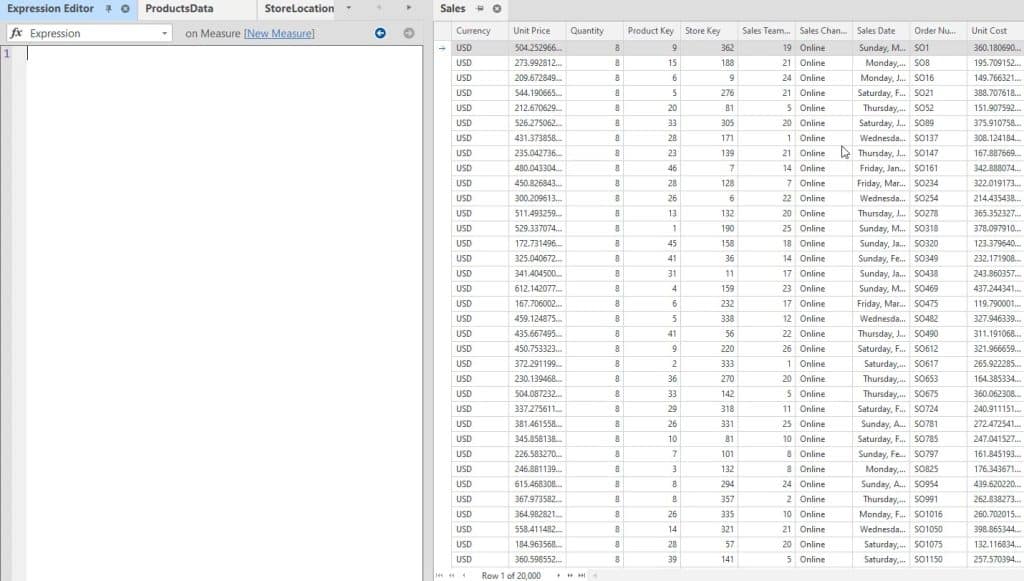
Once you identify the fields that you’re going to use, you can start creating measures. Right-click on a table in the TOM Explorer. Then, select Create and click Measure.
Afterwards, you can now conveniently create your DAX script while looking at the other table as your guide.
***** Related Links *****
Use Tabular Editor To Create Calculation Groups In Power BI
Tabular Editor Power BI: Version 3 Review & Tutorial
Use Tabular Editor To Create Calculation Groups In Power BI
Conclusion
Through this tutorial, you learned how to use the Preview Data Option in the Tabular Editor. To summarize, the Preview Data option allows you to modify your working space to help you be comfortable when doing data development.
You can use and maximize the available settings in the preview option to view multiple data, tables, and other specific information.
Enterprise DNA Experts


