
In this blog post, you’ll learn how to show data from specific time frames as filtered by a date slicer without affecting the overall Cumulative Totals. This is based on a query on the Enterprise DNA Members-Only Support Forum. For sure, you’ll find this quite useful when facing a scenario similar to the example that will be given below. You may watch the full video of this tutorial at the bottom of this blog.
I have answered this query in the support forum, but I want to show you how I was able to put it all together.

The Scenario: Actuals Vs Budget
Basically, the member who posted the query has data comparing Actuals versus Budgets.
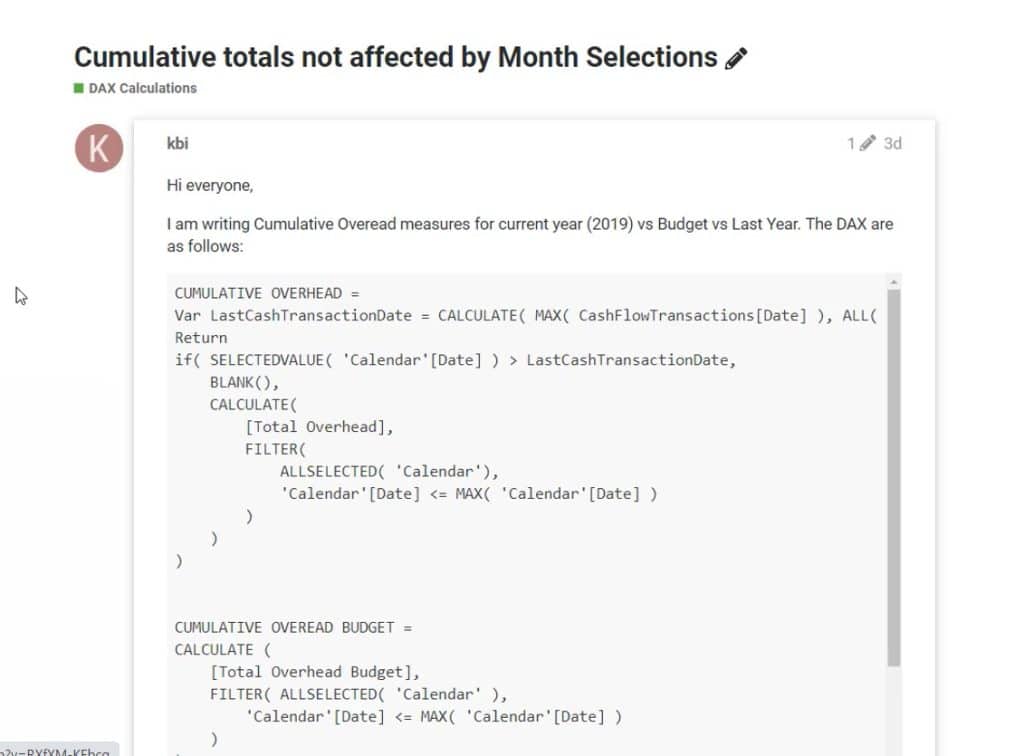
What this member wants to do is to show only the Cumulative Total for a specific time period without affecting any of the original results.
So let’s say the member only wants to show the totals for January, February and March.
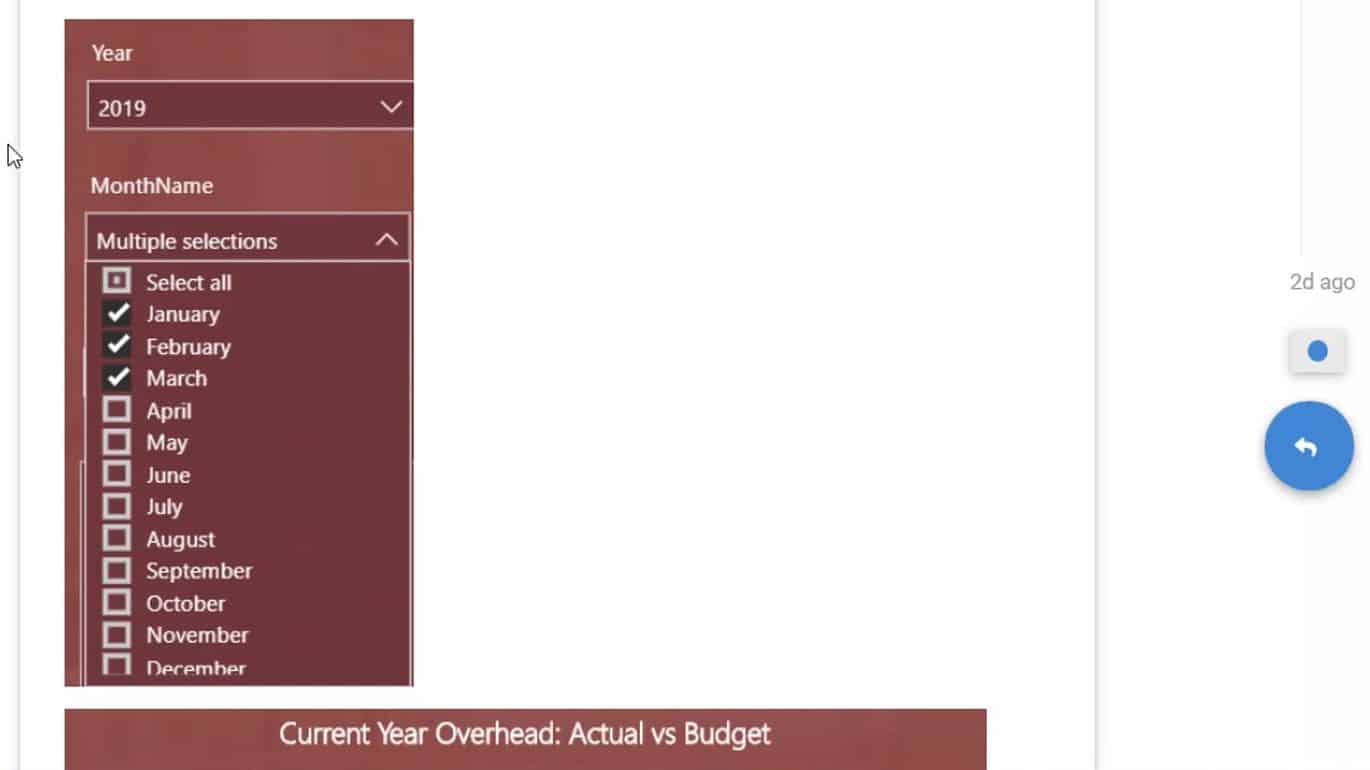
We’re hoping that the Cumulative Total for those specific months will be shown while the Cumulative Total for the rest of the year remains on the visualization as well.
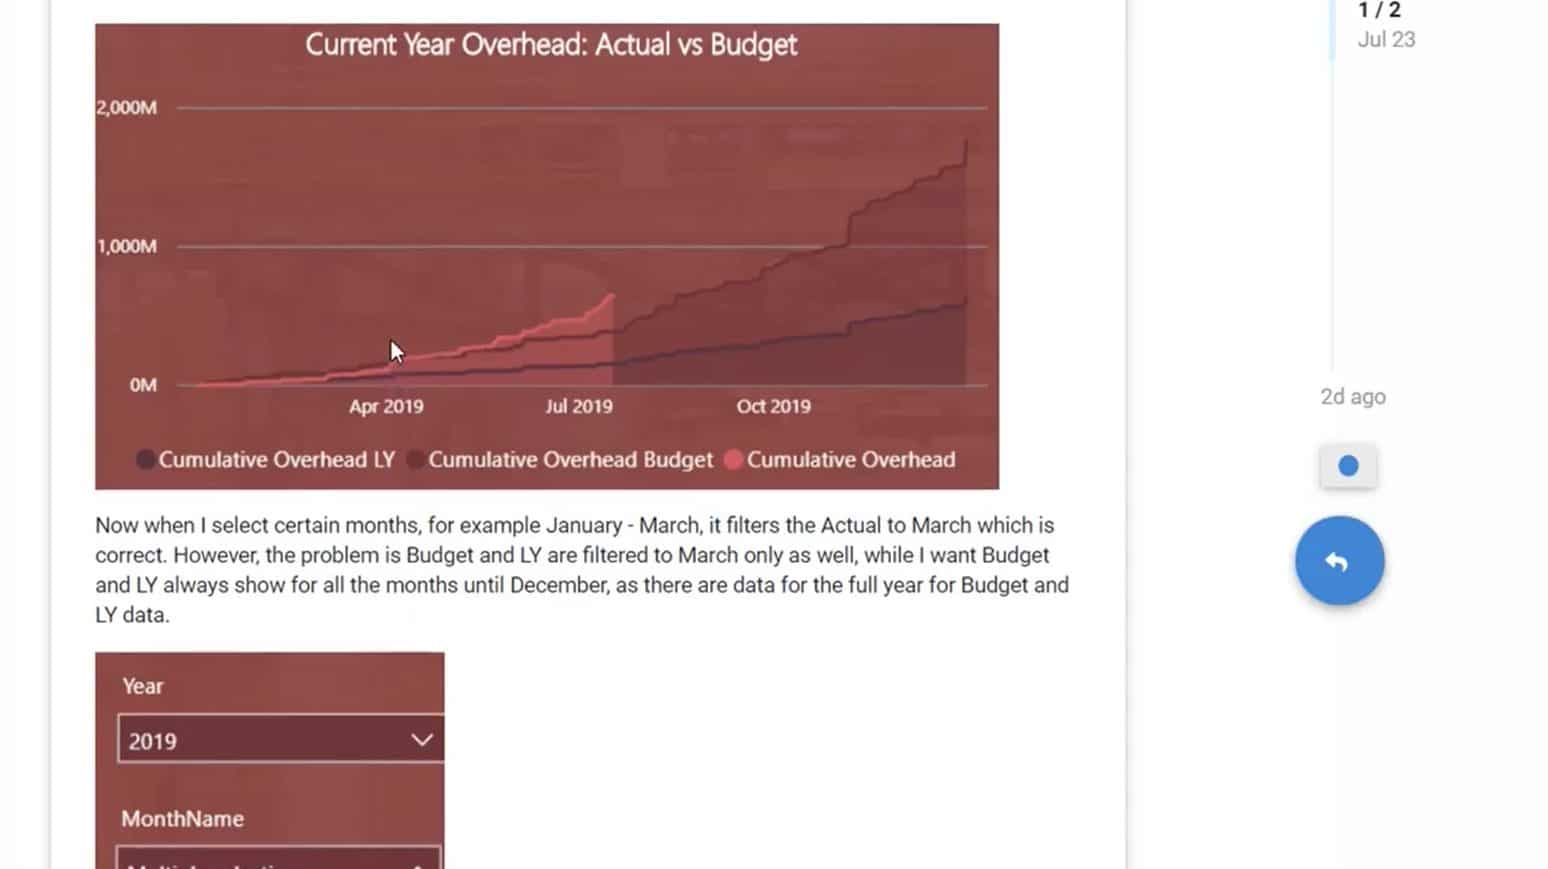
Of course, without the right logic, every time the date slicer is moved, the entire report page shifts as well. That’s the problem that I’m going to solve here.
Creating A New Date Table
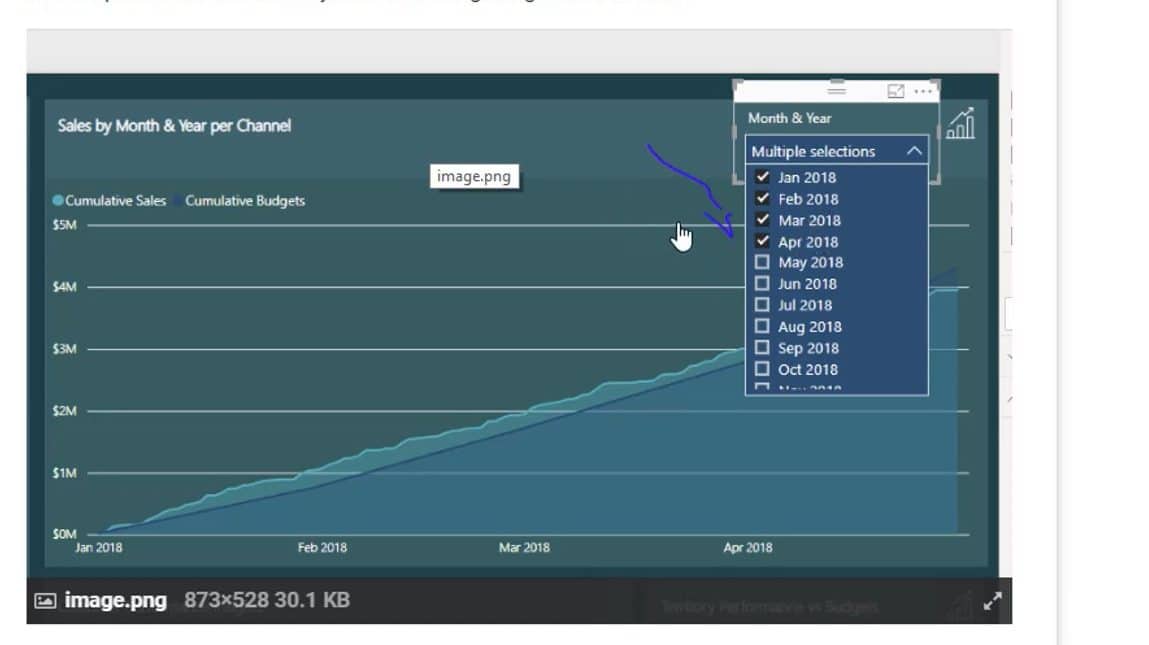
To start off, I set up a similar scenario. As expected, everything in my visualization changed when I selected four months on my date slicer.
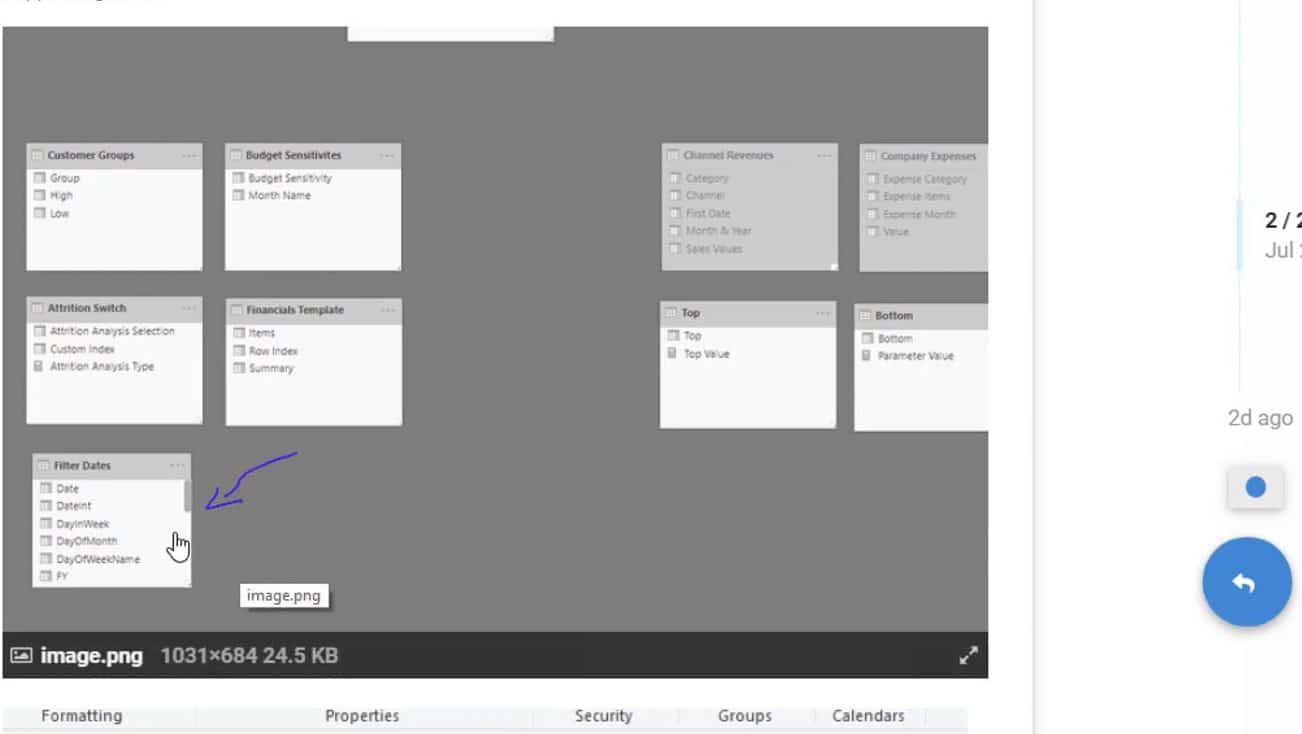
Since I only want to change a specific part of the visualization, I would need to create a brand new date table. This table is going to dictate the individual result that I need. I called the new table Filter Dates, which is an exact replica of the original Dates table.

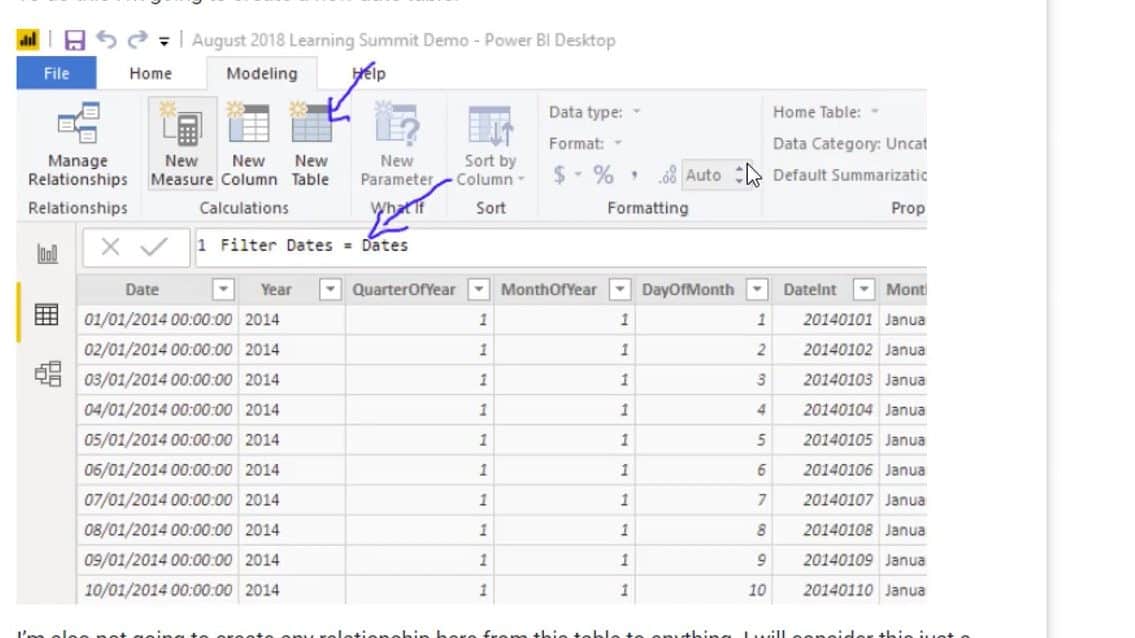
I did not build any relationships between the new date table and the other core tables in the model. That’s because we’re only trying to filter a single result in this scenario.
Also, note that we don’t want all the other data to be affected by any changes to the date slicer. A relationship here would make our attempt ineffective.
To make sure I don’t confuse the new date table with the original one, I named this Filter MonthYear.
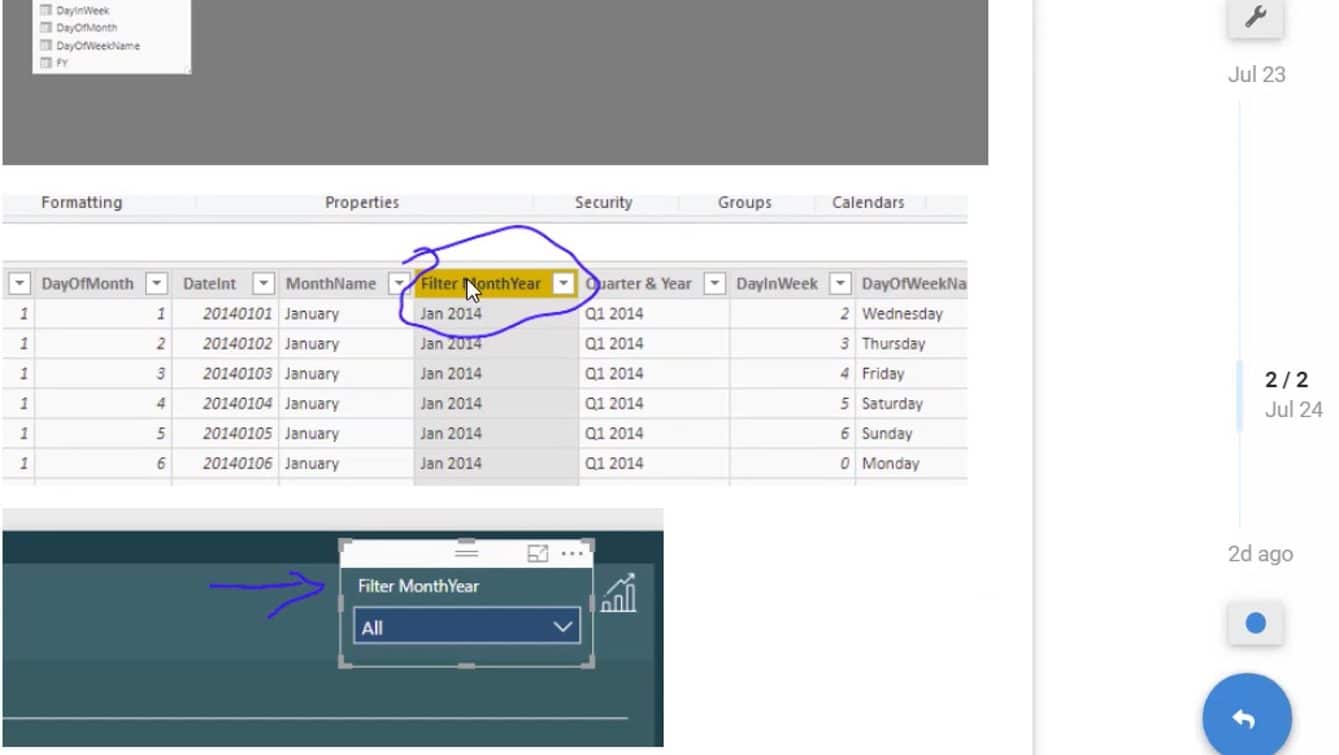
Now that there’s a new date table, I’m going to change the slicer on my report page. Again, this is the filter that has no connection to the rest of my model.
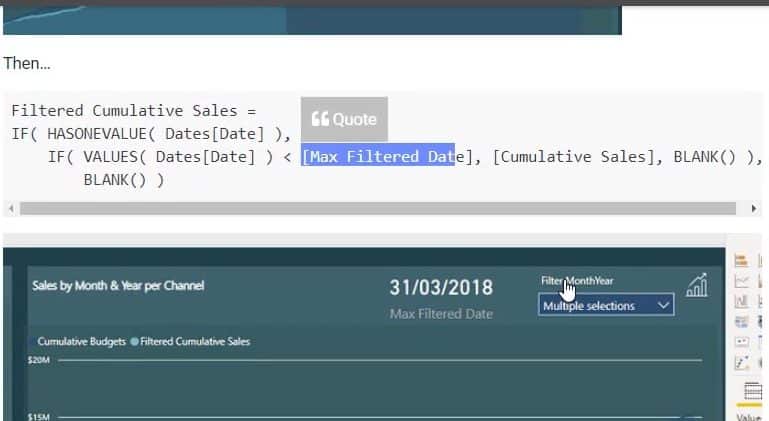
Note that you also have to set a Max Filtered Date in the particular selection that you’re making.
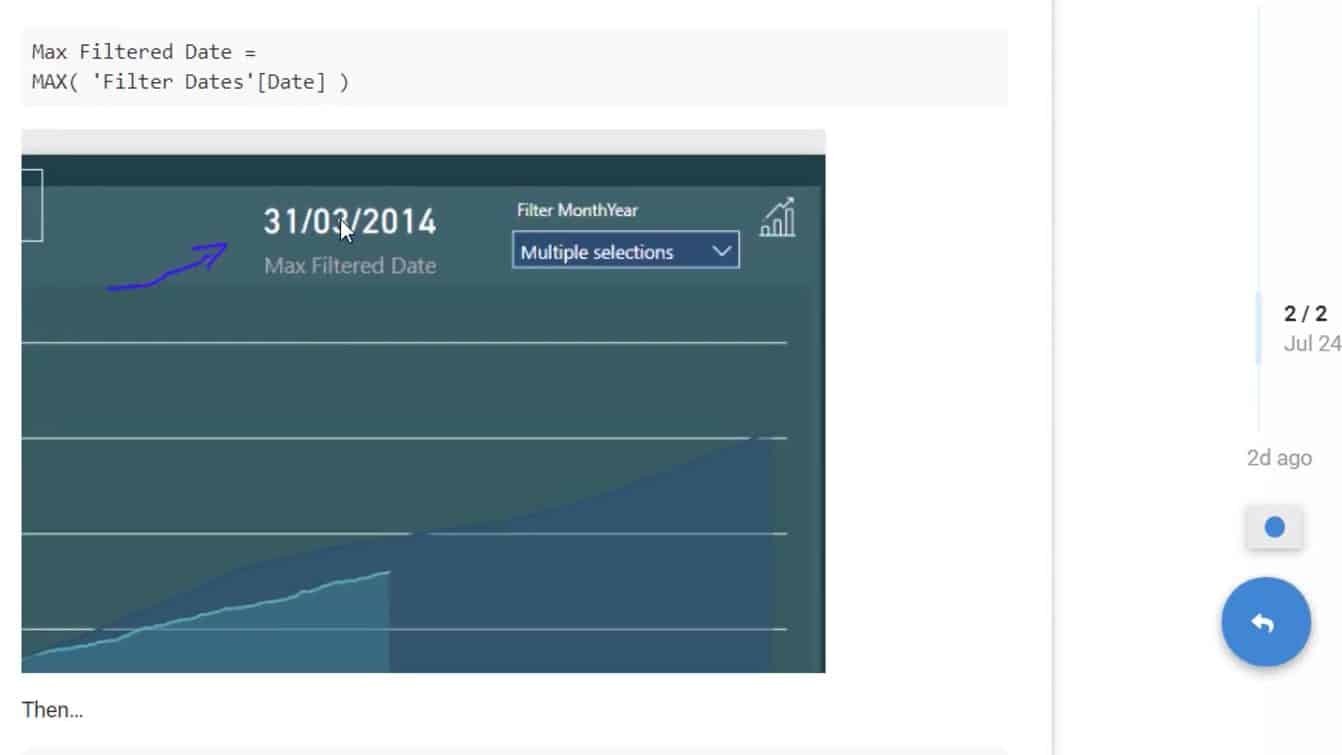
A Max Filtered Date makes the formula work. So if the Date you entered into the date slicer is less than or equal to the Max Filtered Date, you would get the Cumulative Total you’re looking for. If not, you get a BLANK.
When you look at the visualization, you’ll see that I now have an entire area here where there are no results. This reflects the data that turned out BLANK.
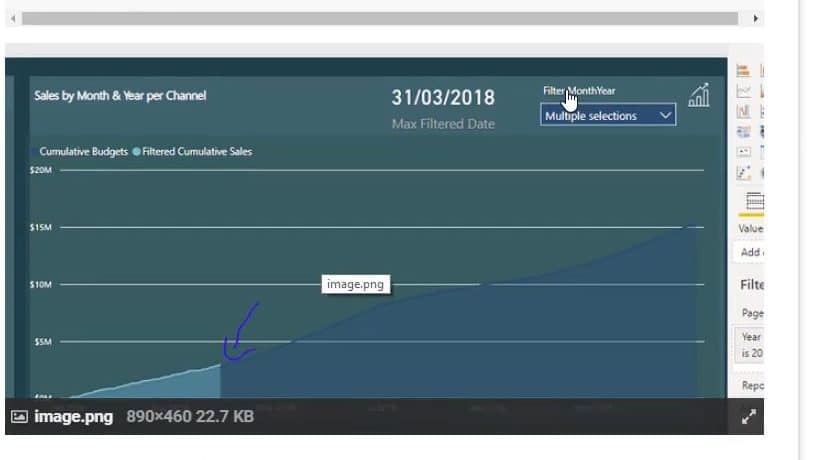
Now, we can retain the year’s totals from a budgeting perspective. But at the same time, we can also manipulate the time frame that we want in our individual results.
***** Related Links *****
How To Harvest Power BI Slicer Selections To Use Within Other Measures
Filtering Data By Custom Fiscal Years And Quarters Using Calculated Columns In Power BI
Cumulative Totals Based On Monthly Average Results In Power BI
Conclusion
Hopefully, you find some value in the technique I showed for similar scenarios you’ll be facing. Just remember that the key thing here is to solve all this right inside the model. Otherwise, you’ll create issues on other parts of your report pages.
Always look at the logic you’re adding into your formula. This way, you can pinpoint which part of your model you’re making an impact to. In this case, we’ve succeeded in making the Cumulative Totals dynamic based on the new date slicer we created.
All the best,
Sam


