
Today, I wanted to cover a unique technique around cumulative totals based on monthly average results in Power BI. You may watch the full video of this tutorial at the bottom of this blog.
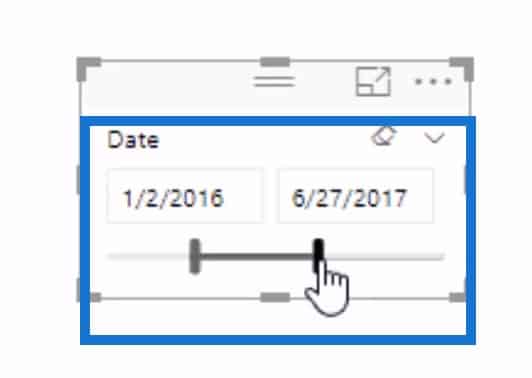
To set the date range for the calculation of monthly average results, we will be using a date slicer.
A Power BI slicer is an alternative for filtering which narrows the portion of the dataset shown in the other visualizations of a report. A date slicer or filter is simply used to constrain relative date ranges in Power BI.

The Cumulative total, on the other hand, is used to display the total sum of data as it grows with time or any other series or progression.
Commonly, when we are reviewing Cumulative Totals, we are analyzing them over a certain date, or over months and year. In this article, we are going to calculate Cumulative Totals over merely the months.
The interesting thing about this particular technique is that when you have a context of just the month, you need to account for the different years being selected. This could occur via a Power BI date slicer selection or a page level filter.
This particular example stems from a very interesting topic at the Enterprise DNA Support Forum. Check this out if you want to review more.
Evaluating The Problem
Someone wanted to show the Cumulative Sales based on the month name, instead of by month and year.
Now, the problem with this is if the date selection you have eventually goes over an entire year.
So, we need to analyze how we can most probably just continue to get a cumulative total, just like it was one selected particular year.

For instance, if you have January to September next year in your date table, you’d most probably have a total of 20 months in there. In this case, the standard Cumulative Total pattern won’t work, so we’ll have to revise it.

This is definitely an interesting scenario and a really good learning opportunity around advanced DAX for everyone.
First, let’s take a quick look at how the standard Cumulative Total pattern actually works.
Reviewing The Cumulative Total Pattern
In this sample, we’ll be looking at a very generic Sales.

This formula is set to calculate sales within the range that is selected. The ALLSELECTED function here primarily displays the values based on whatever date range is selected within this particular report.

And as you can see here in this Power BI date slicer, we are currently between the 2nd of February and the 20th of September.

Now, in this current context table, we can validate that the formula for the Cumulative Sales works totally fine. This is because it still calculates the accumulation of Total Sales from January to September.

Conflict In Using Cumulative Total Pattern For Monthly Average Results
Though the Cumulative Total formula currently works fine, there can be issues when deriving the calculation based on a date slicer.
As shown in the image, I just slowly extended the date range further and dragged it out into the next year.

This formula accumulates the monthly Total Sales, but it also starts bringing the accumulation into the new months. So, this results in an odd value for January, which is really just a continuation of all the proceeding months.
In other words, it’s properly calculating, but it’s not actually giving us the result that we particularly want.
What it currently does here is it starts from the value for January going all the way to December; and then jumps back to January again, accumulating from December, and so on.
If I just drag the date out again, you’ll see that the Cumulative Sales value extends down even lower as we go.

And then, when you actually drag it out quite far, you’ll notice that the Cumulative Sales from the months of January to May all became 23 million, which is basically the total. It’s just sort of going in a cycle for every single month of every single year.

What we may actually want here is to get an updated Cumulative Total based on monthly average results; wherein it should start with the Total Sales of January, and then accumulate from there.

To solve this takes a technique that is slightly different to what you may think. We also need to make sure that the totals are correct, and that they dynamically adjust for different selections in the date slicer, which may be coming from the users.
The Cumulative Monthly Sales Column
I’m going to bring in the result of my formula for this particular problem and show why it actually works.

Apparently, you’ll see here that it is always accumulating the monthly Total Sales.

But check out what happens when I try to extend this.
It always accumulates from January. It doesn’t do the weird calculation that the Cumulative Sales pattern does.
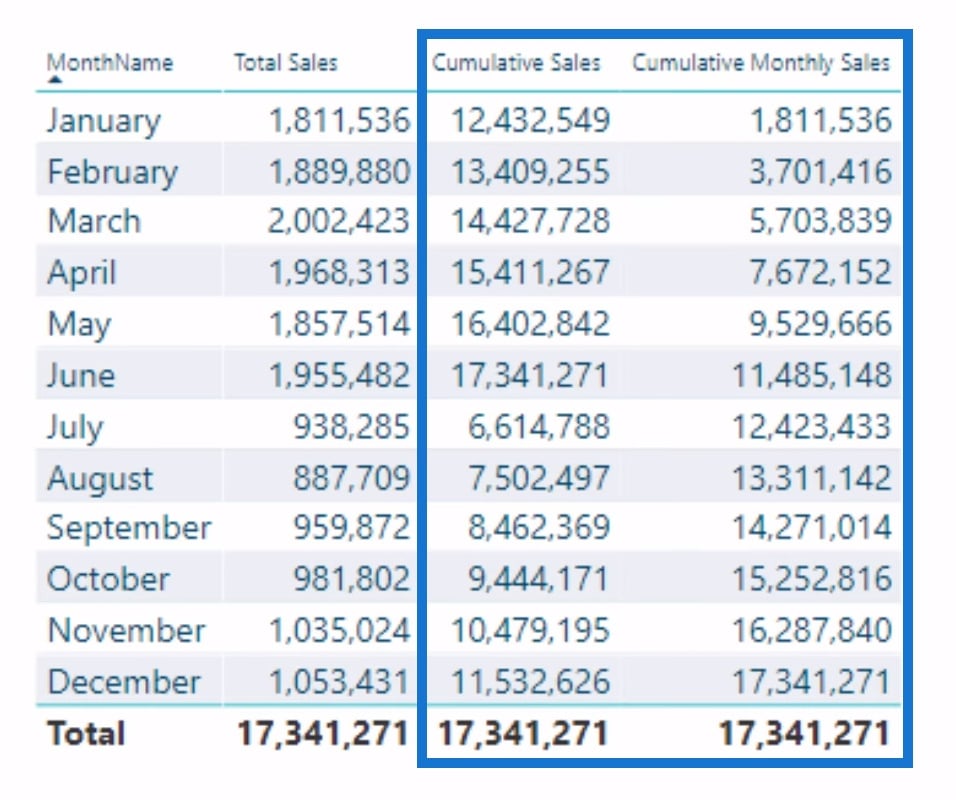
Clearly, the Cumulative Monthly Sales column produces a more logical result.
On the other hand, the Cumulative Sales result doesn’t really make much sense from a visualization point of view.
What I did in my solution is I recreated a new pattern that gave us the answer that we needed for this particular scenario.

Let’s now discuss how we were able to work out on the provided solution.
Creating The Date Range
Creating the date range is the first thing that we need to establish the formula.
To create this, we initialized a minimum date, which was represented by the MinDate variable; and a maximum date, which was represented by the MaxDate variable. Then, we made the calculation for each variable by using the ALLSELECTED, MIN and MAX functions.

The ALLSELECTED function gets the context that represents all rows and columns in the query, while keeping explicit filters and contexts other than row and column filters. This function can be used to obtain visual totals in queries.
Meanwhile, the MIN function returns the smallest value in a column, or between two scalar expressions and the MAX function returns the largest value.
After initializing the minimum and maximum date, we were able to create the date range in a slightly different way than what we did in the Cumulative Total pattern.

I needed to recreate this part of the table where I had the month name and the total sales. This is because we only wanted to calculate it within this particular date range.

So, using the SUMMARIZE function, I was then able to narrow the date range.

Adding The MonthName And MonthNumber Columns
As you can see, we have included the MonthName column from the Dates table, and the Sales column which is basically the Total Sales.

Now, the first part of the formula is currently quite different from the Cumulative Sales pattern.
Moreover, we have added the MonthNumber to the logic pattern. This was acquired from the Dates table. This will serve as a virtual or imaginary column that will set a value from 1 down to 12 for the months of January to December.

From the values of the MonthNumber column, I was able to calculate the Cumulative Total based on the number of months.

Calculating The Cumulative Total Based On The Number Of Months
To be more specific, the succeeding parts of the formula iterates through every single row in the specified table.
Then, the MonthNumber column will be evaluated if it is less than or equal to the maximum month of the year.

This part is calculating what the current month number is.
For instance, if we are in the month of May, the value of the MonthNumber will be 5. Then, this particular logic pattern inside the FILTER function iterates through this table for every single row.

At that point, it will evaluate whether there are any of the numbers that are less than or equal to 5. If there are, it will include those to the calculation and maintain that column from the table.

Lastly, we’ll count up the amount of Sales.

And that’s how we get to the 11th row here which is November.

This part evaluated November as 11.

We iterated through the entire table and evaluated whether the 11th of the month is less than or equal to the current month in the context, which is 11.

Then, we will go and count up the Sales, which is being represented by this particular column here inside the SUMMARIZE function.

***** Related Links*****
Cumulative Totals In Power BI Without Any Dates – Advanced DAX
Running Totals in Power BI: How To Calculate Using DAX Formula
Compare Cumulative Information Over Different Months In Power BI
Conclusion
In my proposed solution, I used a combination of DAX formulas including SUMX and SUMMARIZE. But what you also need to do is make sure that you wrap these particular functions with a FILTER statement.
That filter statement will enable you to ultimately get the correct Cumulative Total based on a dynamic date logic.
There’s a bit to learn in this particular tutorial, but it’s really an interesting content. Hopefully, you can implement some of these techniques into your own models.
When you learn how to combine a lot of DAX functions together inside of Power BI, solving these unique scenarios becomes absolutely achievable.
Good luck diving into this one.
Sam


