
Sometimes calculating running totals in Power BI is a far better away to analyse trends than just looking at actual results on a daily basis. You may watch the full video of this tutorial at the bottom of this blog.
That’s why I’m going to show you in this example how you can implement a running total calculation which is dynamic, and flows and integrates well with the rest of your model.
And I’m going to show you how you can do it very effectively and easily by combining a few DAX measures inside of Power BI.

Calculating Running Totals In Power BI From Scratch
In this blog post, I am going to show you how to calculate running totals inside of Power BI. There’s actually a couple of ways on how to do it, and I’m going to show you both ways.
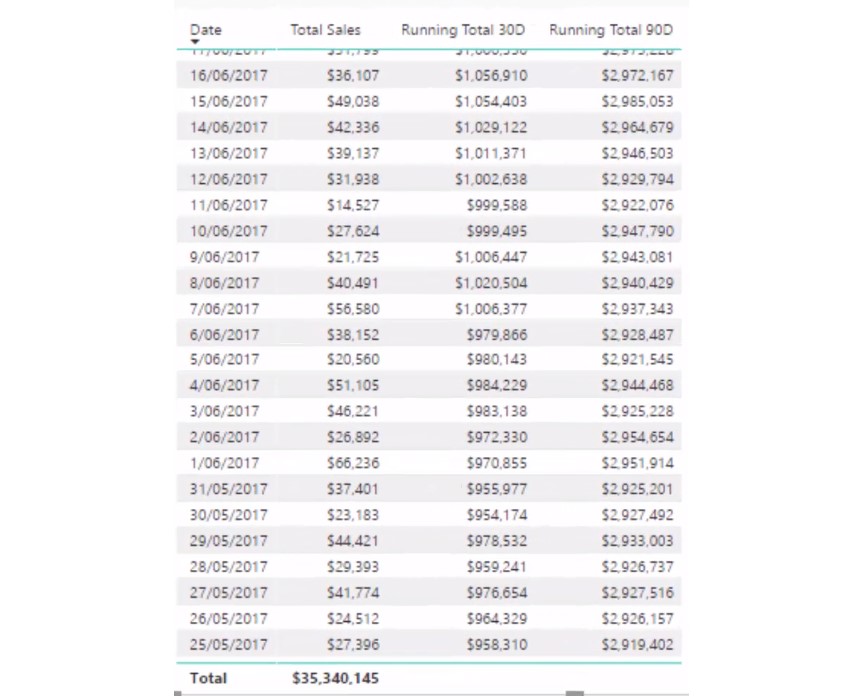
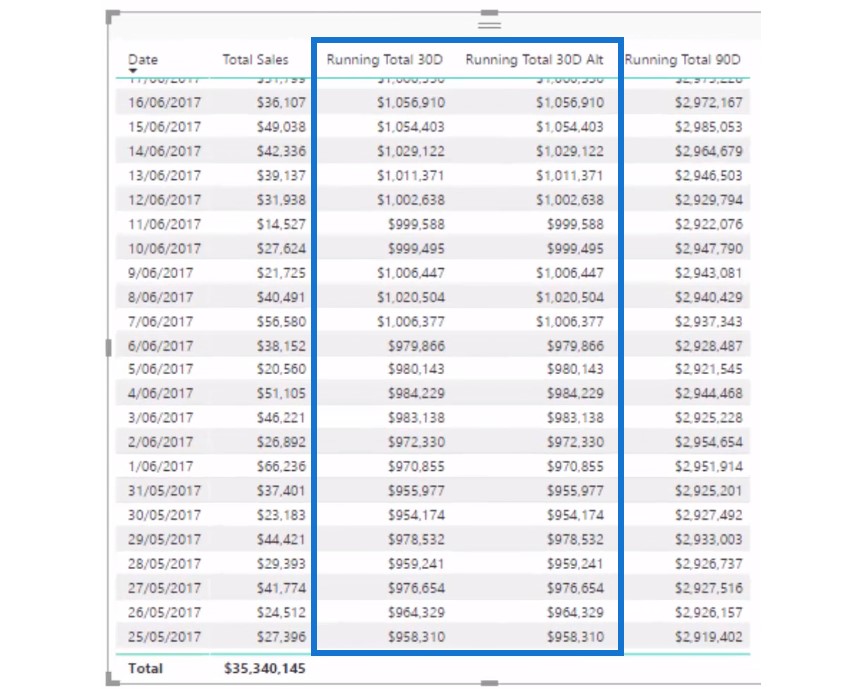
This is ultimately what we want to achieve as a result. We have our Date and Sales columns, as well as a 30-day running total and a 90-day running total (left side).
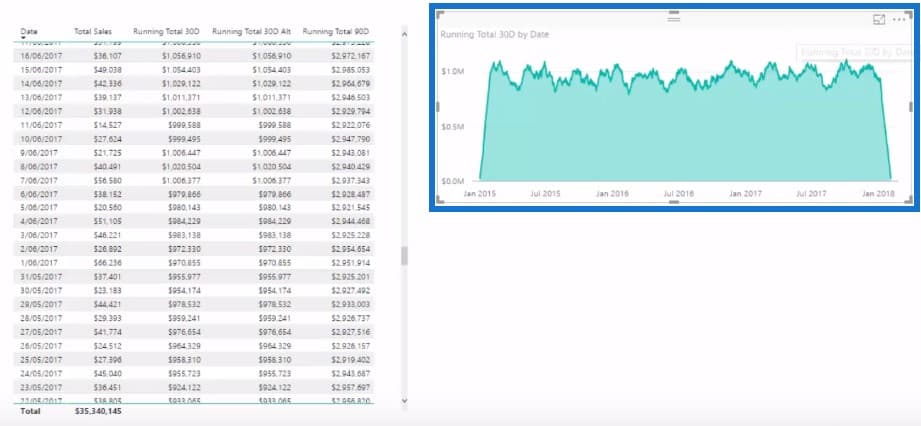
We also put them into visualizations to make the numbers more interesting, and to make trends and outliers easier to spot (right side).

We can also change the time frame and see our running totals change in real time. Quite a compelling insight, right?

So if you’re looking at things like inventory or accounts receivable, this is a really good piece of analysis that you can run on top of the data.
You can then branch out into more advanced things like comparing your running totals from one period to another period.

There are many amazing things you can do and I’m going to show you how you can achieve this from scratch.
Running Totals In 30 Days
As always, we start with a blank report where all we’ve got is our Total Sales. Let’s write a measure that will give us a 30-day running total. This means we want to look back from today to 30 days, and sum up all the sales within that time period.
Let’s create a measure and call it Running Total 30D.
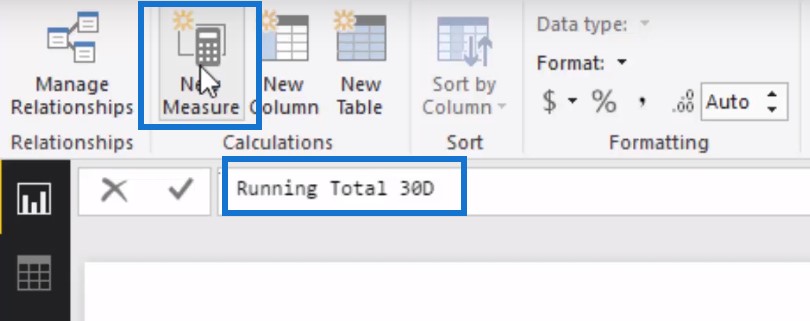
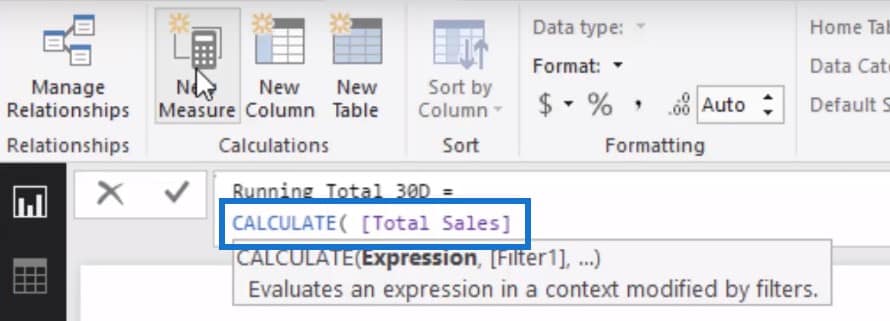
Then we will jump in to another line to write a bit of logic and input the Total Sales.
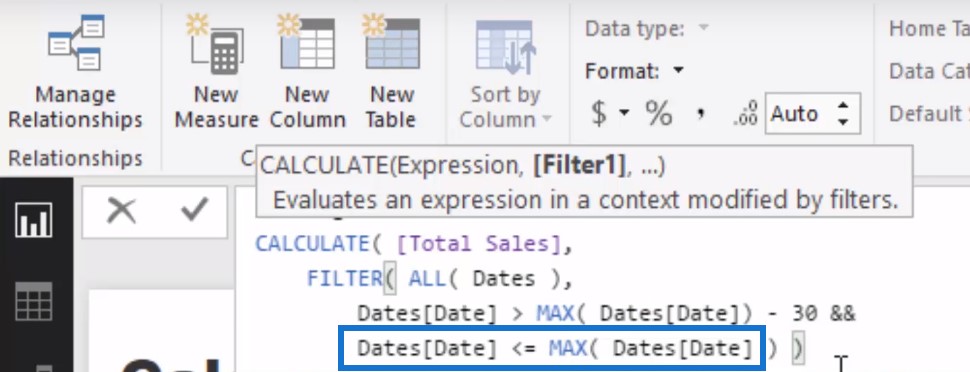
The third step is to use the FILTER function. The FILTER function is an iterating function that iterates the date table and captures the 30 days for the running total.
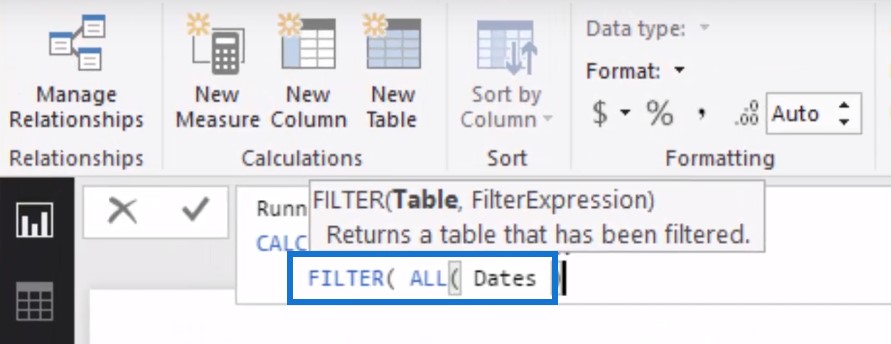
We are going to remove any filter or any context coming from the DATE column. So ALL gets rid of that context and gets rid of that filter.
Then we are going to iterate through the entire DATE table and see if the date is greater than MAX (Date – 30), which is going to give us the first day of the 30 days.
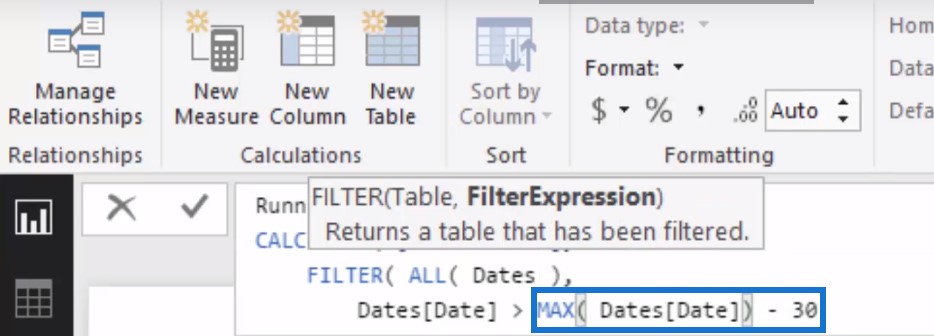
And then we will write if the date is less than equal to the MAX date.
Let’s press enter and drag the information to the table. We can see that this will evaluate to a running total now.
Running Totals In 90 Days
Let’s say we want to get the sales from a different time frame. We can use the same measure and then change the number from 30 days to our preferred number, which in this case is 90.
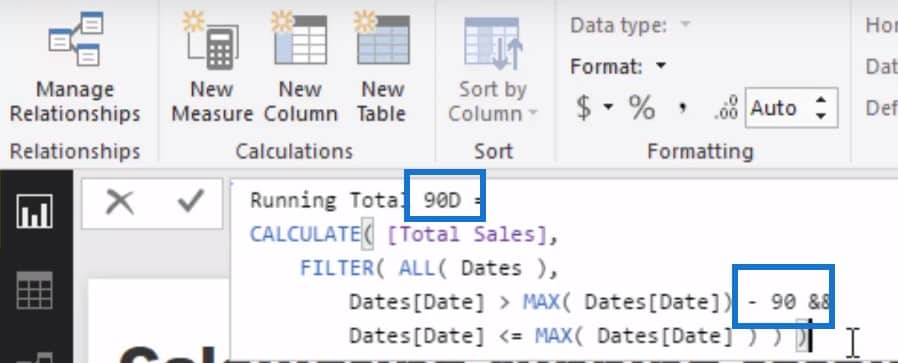
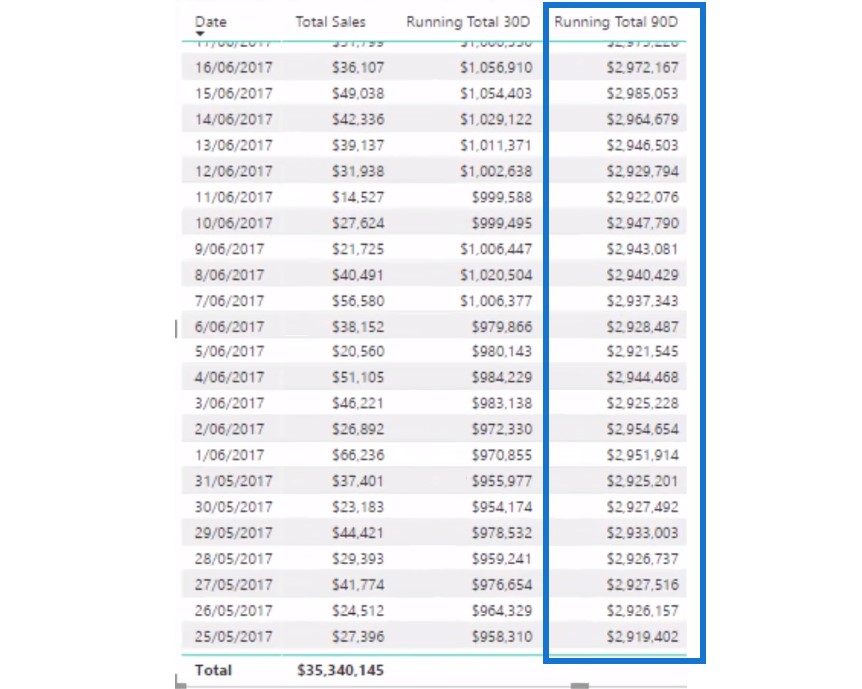
And just like that, we’ve got a running total for 90 days. This is going to evaluate something that is slightly different because we’re looking at our sales for a much longer time frame.
Remember that you can always substitute a different measure here; you can use this technique to arrive at data about your profits, transactions, or customers. There are simply lots of things you can implement using this running total formula.
There are many things that you can actually branch into as well. Not only can you look at running totals at any point in time, you can actually compare your running totals versus last month, last quarter, or last year as well.
Using DATESINPERIOD
I’m going to show you another formula you can write to achieve the exact same thing; however, it uses a different filtering logic inside of the calculate statement.
We’re going to call this measure the Running Total 30D Alternative. Again, we’ll calculate the total sales but instead of FILTER, we’re going to use the function called DATESINPERIOD.

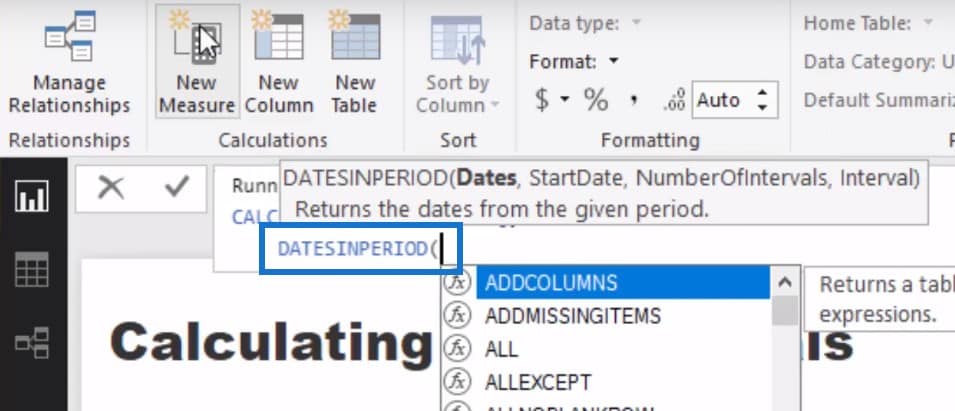
Then we’ll jump to another row and put some Dates. This is what DATESINPERIOD does; it is a specific time intelligence function which allows us to create or open up any time period. All we have to do is put in our parameters.
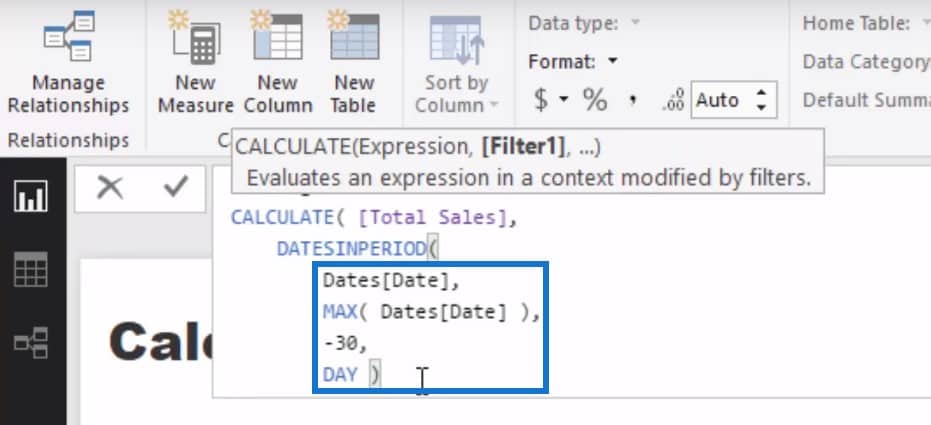
So basically it does what the FILTER function does, in a different way. This is a slightly easier way that offers a lot more flexibility.
And if we put it next to our other 30-day table, we will see it is exactly the same as the one that we used in FILTER. So this is just another way of achieving a similar result.
Now all that is left to do here is to turn it into a visualization, which doesn’t take long. Then we can see the running total in a visual way.
We can also add different filters. Let’s say for instance we want to look at a particular year like 2017.

The running total will automatically adjust at whatever additional context we want to add in our report page.
This is how we do the running total. You can use it in a lot of applications. The same technique can be used again and again in different scenarios.
***** Related Links *****
Fixing Incorrect Totals Using DAX Formula Techniques In Power BI
Create Dynamic Cumulative Totals Using DAX In Power BI
Calculate Rolling Totals in Power BI Using DAX
Conclusion
I think that running totals are a much better way of looking at averages over time. Sometimes it’s too granular to look at a daily level. However, running totals allows you to not get caught up in any one individual result, but at an accumulation of results that actually provide much better insights.
There are lots of different ways that you can utilize this in Power BI, and you’ll get a much better idea of how I personally implement it via the video below.
I go into quite a bit of detail around the specific formula, but then you can branch out from it for other insights that you might ultimately want to create.
So good luck implementing this one. Lots to learn and lots to replicate in your own models.
[youtube https://www.youtube.com/watch?v=RYU1O-incoI&w=784&h=441]


