
RANKX is the most commonly used DAX function for ranking insights in Power BI. It is a simple function, yet can be frustratingly confusing to newbies. However, it is a very powerful function that could yield valuable insights for your reports.
In this article, you will know the ins and outs of the RANKX DAX function. You will learn when and how to use it and you will see how useful this function is as we explore some scenarios and examples.

DAX RANKX Function Definition And Syntax
The RANKX Power BI DAX function returns the ranking of a certain number in a list of numbers for each row in the table argument. It can be used in calculations both for calculated columns and calculated measures. Below is the RANKX formula syntax.
RANKX(
<table>, <expression>, <value>, <order>, <ties>
)
For the table parameter, you can input a standard table imported in Power BI or a calculated table through DAX. RANKX, as an iterating function, then iterates through that table and ranks a specific number. This depends on the number of values within the table. For example, if the table has 20 values, then RANKX will have a ranking result from 1 to 20.
One key to understanding the RANKX function is that it returns a scalar value. Within the expression parameter, we need a DAX expression that returns a scalar value. This expression loops and iterates through each row within the table, giving you the ranking values accordingly.
The value and order parameters are optional, while the ties parameter helps you determine the ranking when there are ties in your values.
RANKX And Power BI DAX Formula Concepts
There are a number of concepts to understand well to make sure the ranking results you expect are created. I’ll discuss the most important concept when running a DAX calculation, which is ‘context‘. Once you nail this, then you can really understand how to use the RANKX function effectively.
RANKX is a very unique DAX function that requires a deeper level of thinking around its logic and how it actually works when running a calculation in a particular context (for example a table or chart inside Power BI).

Each different parameter within the DAX RANKX function can change the way in which it calculates a result. There are multiple parameters that you can input into this DAX function to understand how each one can determine the underlying result, which is deemed important.
That is why understanding the key elements and concepts of how RANKX works in a variety of contexts is essential. This will enable you to be sure that your calculations are correct and that your consumers are viewing insights that actually make sense.
Basic RANKX DAX Scenario
First, let’s take a look at a simple RANKX calculation. In this example, we’re trying to identify the ranking of these products based on Sales (this could also be based on any measure) across all the different products that we sell.
Primarily, we need to create a table inside RANKX to evaluate every single product based on the measure that we specified. The ALL function can be used to remove any filter from the Products table and to evaluate every single product.

But, if we remove the filter (in this case, the ALL function), and just use “Products”, it will show a different result. This is why we need to use the ALL function to get the correct result. This is how you can solve simple RANKX calculations.
But what if it gets more complex? What if you’ll need ranking results that are not just based on Total Sales? Well, that’s where we need to understand the current context of this calculation. We need to know how we can manipulate the context to get the result that we want.
Complex RANKX DAX Scenario
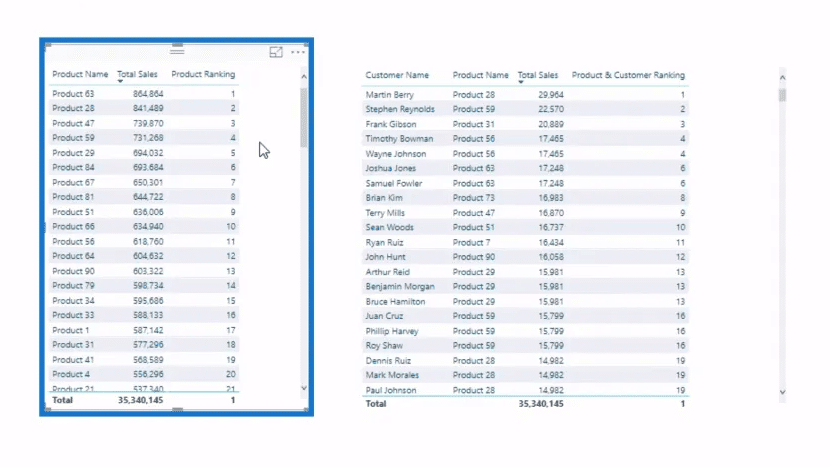
Let’s try to bring in the exact similar formula (Product Ranking measure) into the table on the right side.
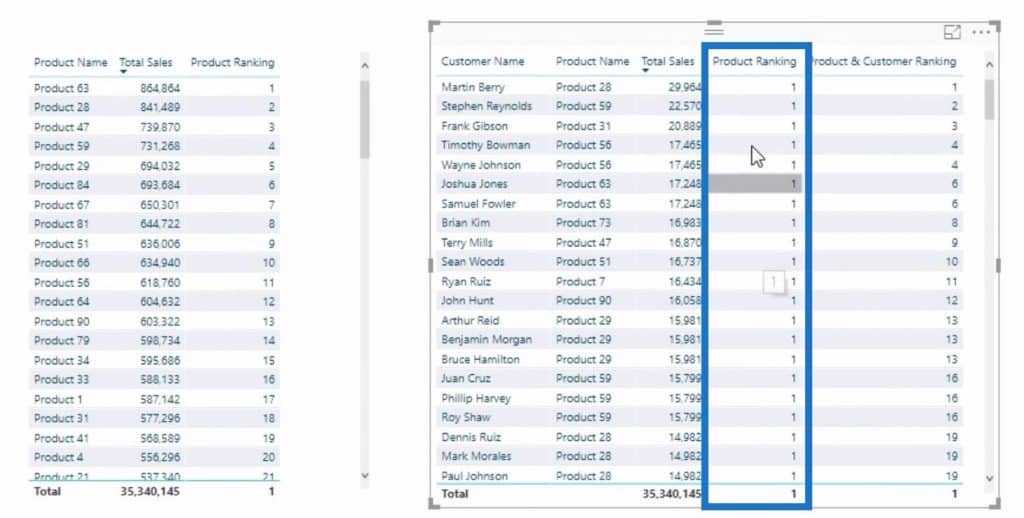
As you can see, it has given us another erroneous result. The reason behind this is that we also have a Customer Name column here. If we look at the formula again, you’ll see that it is not breaking out each individual customer. We are only evaluating the products for each specific customer.
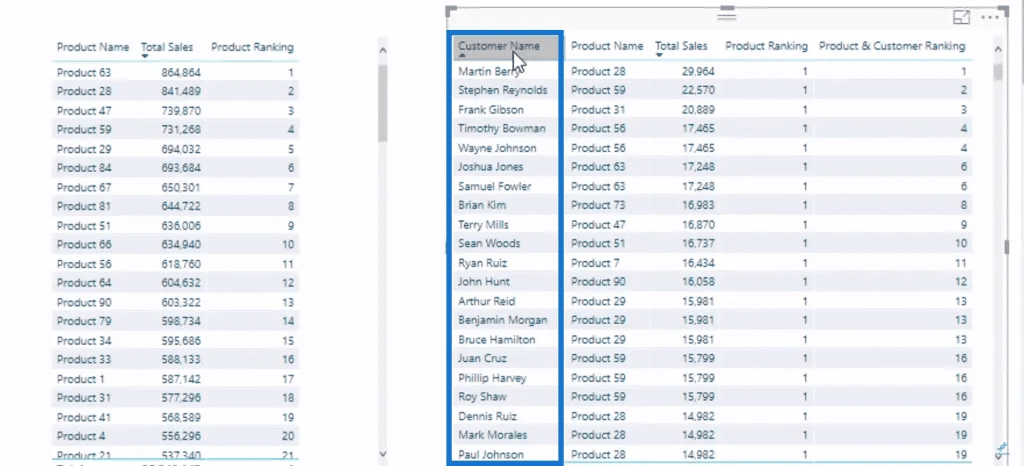
Let’s try to sort out the Customer Name column.
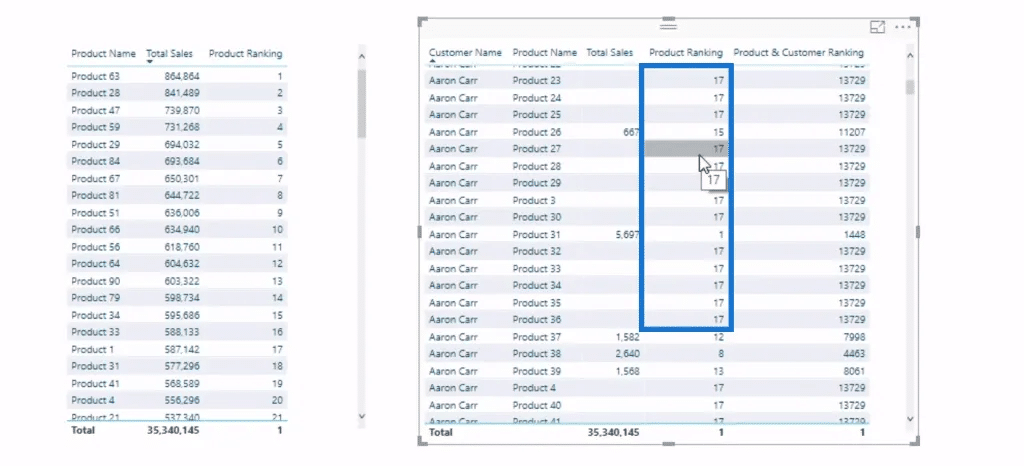
Even if we sort out the Customer Name column, the Product Ranking will still change based on the ranking of the product that they bought. There are lots of numbers that are the same. One example is rank 17. In this case, it may be because this particular customer has only bought 17 products.
That’s maybe what you need in this scenario. But what if you’ll be needing something a bit more complex than that? What if you’ll need the rank from 1 to an indefinite value of the Customer Name and Product contexts?
As I’ve emphasized, it is important to understand the context and how we manipulate the context to get the result we want.
In our example, we have two dimensions that are from two totally different tables. We have the Customer Name column from the Customers table and the Product Name column from the Products table.
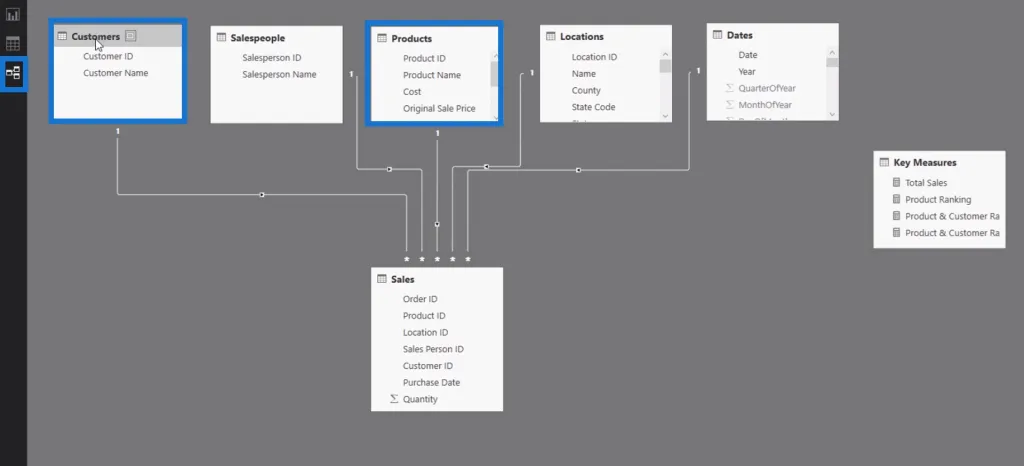
We need to somehow remove filters on this virtual table inside the RANKX logic from both two tables. We need to do what we did in the first table (left side), but we need to do it across both the Customer Name and Product Name columns in both particular tables.
Then eventually, we’ll get the correct ranking via Total Sales of Customer Name and Product Name. Here is the formula that we can use for this distinct scenario.


The CROSSJOIN function allows us to join two columns together, or it could also be two tables. However, in this case, we’ll just join columns.
We are removing all the filters from both Customers and Products tables. Then, we’ll be iterating through every single row in this virtual table and evaluating or identifying where the particular rank for this particular Customer Name and Product Name subset.
Advanced RANKX DAX Example
As you can see in the previous examples, the RANKX function gives you valuable insights when you use it for a range of different contexts on your report page. However, it can also be one of the most confusing functions to use in Power BI. It can give you different results that seem to be correct, when in fact, they’re wrong. If you’re not careful, you’ll end up having to rework the entire report.
You need a solid understanding of context and then learn how to use RANKX within that context.
I’ll be diving into how complex RANKX can be sometimes. I’ll work through an example so you can understand the many nuances of working with this function.
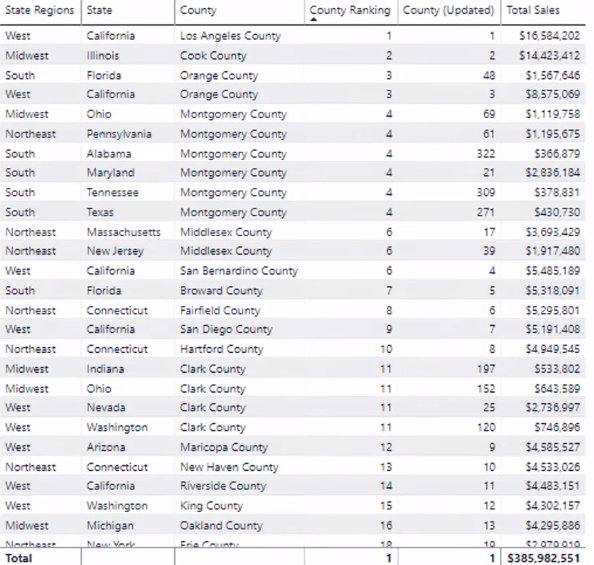
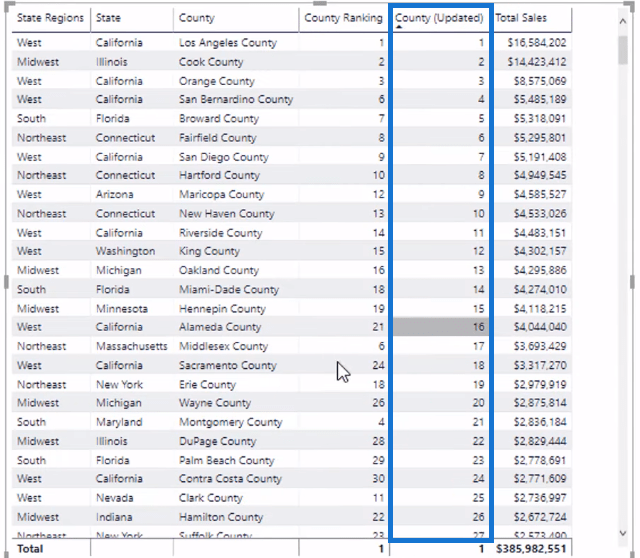
In the visualization below, we have the County Ranking, States Ranking, and State Regions Ranking.
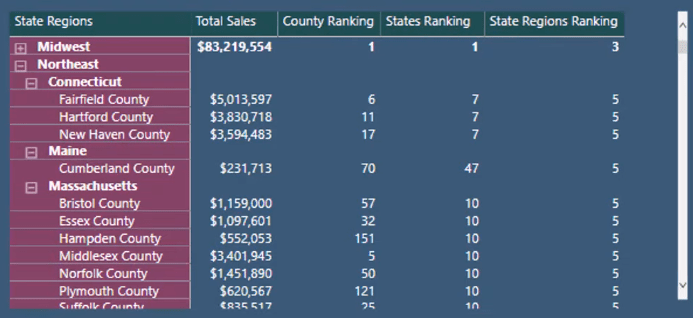
Managing the context of the calculation can be difficult if you want to see them all in one matrix. Let’s look at the table. You can see that it has information on the State Regions, State, and County.
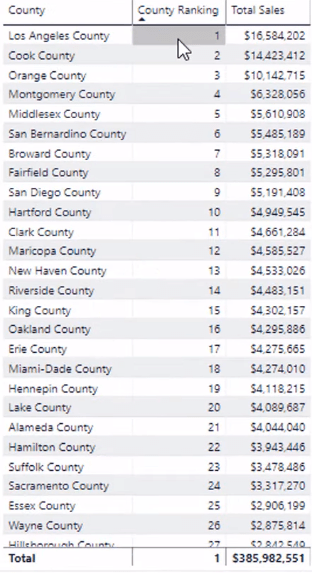
For this example, you need to work out the ranking of the Counties. If you just have the County, County Ranking, and Total Sales in the table, you get the correct ranking results:
But once you start to layer the other contexts in the table, the ranking result starts to accumulate for each County that is in different States and State Regions.
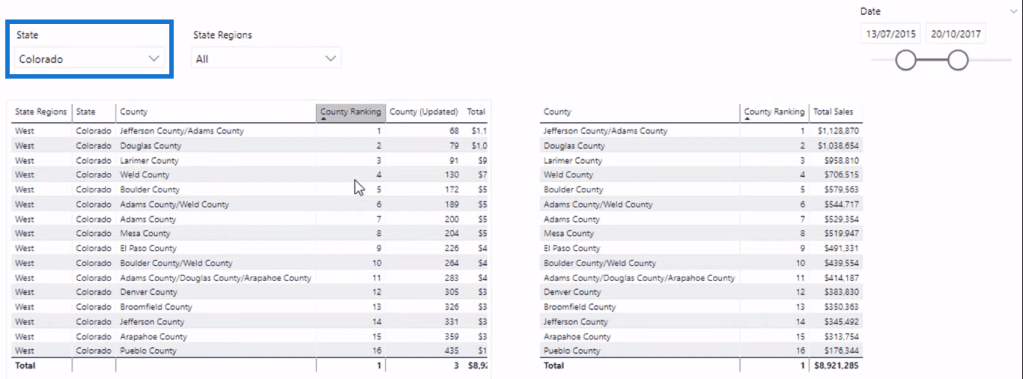
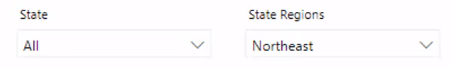
So, you need to identify and change the context of the calculation to make sure you get the correct overall rank for each County regardless of what’s selected on the report page. Whenever you select a State like Colorado, the formula updates too.
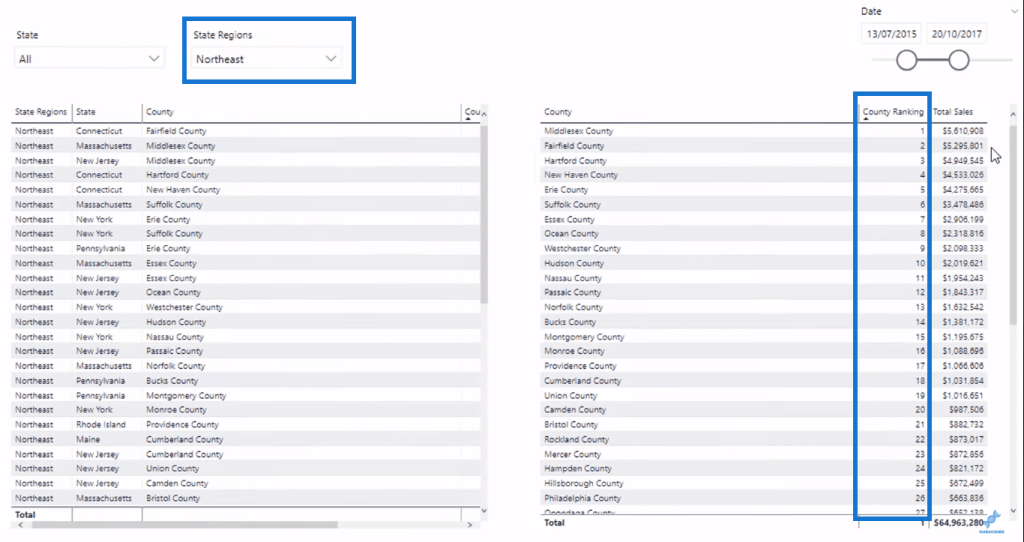
You can also make a selection using State Regions. If you select Northeast, it shows the proper ranking.
In this example, two formulas are used to get the County Ranking. This will help you understand the difference in the results generated by using different DAX functions along with RANKX:
Formula #1: RANKX With ALL And ALLSELECTED
The ALL function is the key part of this formula for County Rank:

It manipulates the context within the RANKX formula. It then iterates through the Regions table and creates the ranking result. In this case, the ALL function is virtually working through every single County regardless of the initial context.
This problem becomes complicated when you start to layer on slicer contexts. By using ALLSELECTED, the ranking will automatically update depending on the selection in the slicer. You also need to utilize CALCULATE to place additional context on a result or to change the context of the calculation.
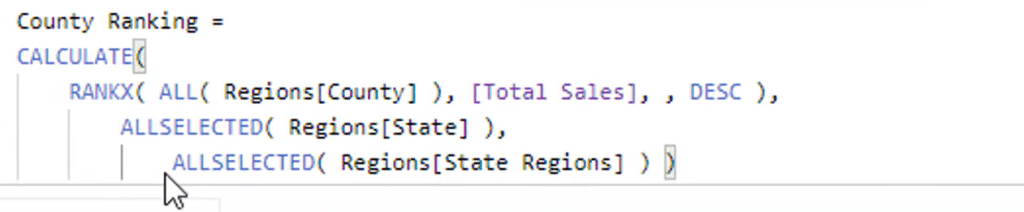
The context is adjusted based on the filters within the CALCULATE function. With this, the ranking will adjust based on the context coming from the State and State Region slicers.
Formula #2: RANKX With ALL And VALUES
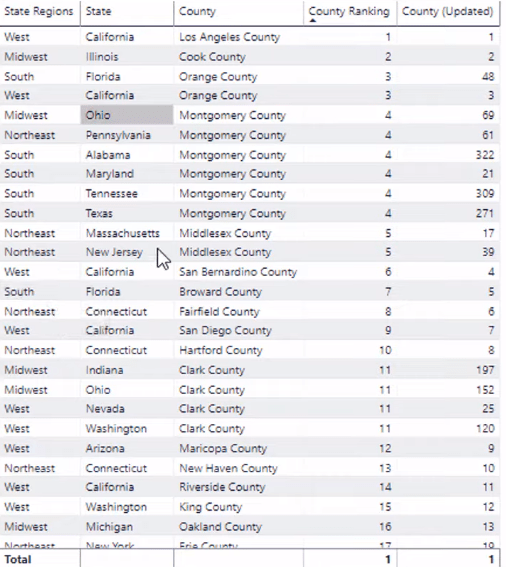
Let’s now look at the County (Updated) column.
You want to make sure that this column will continue to show the overall rank regardless of what’s selected in the slicers. Every County should have a unique number.
This is the formula used:
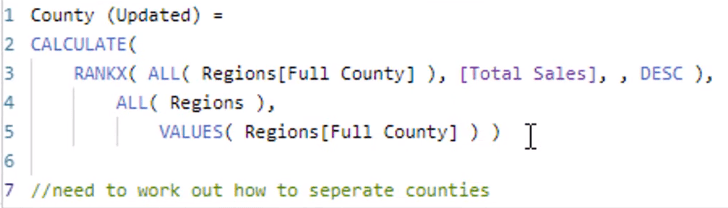
For this example, there wasn’t a way to decipher a unique County, so another column was created. The Full County column includes the County, State, and Region.
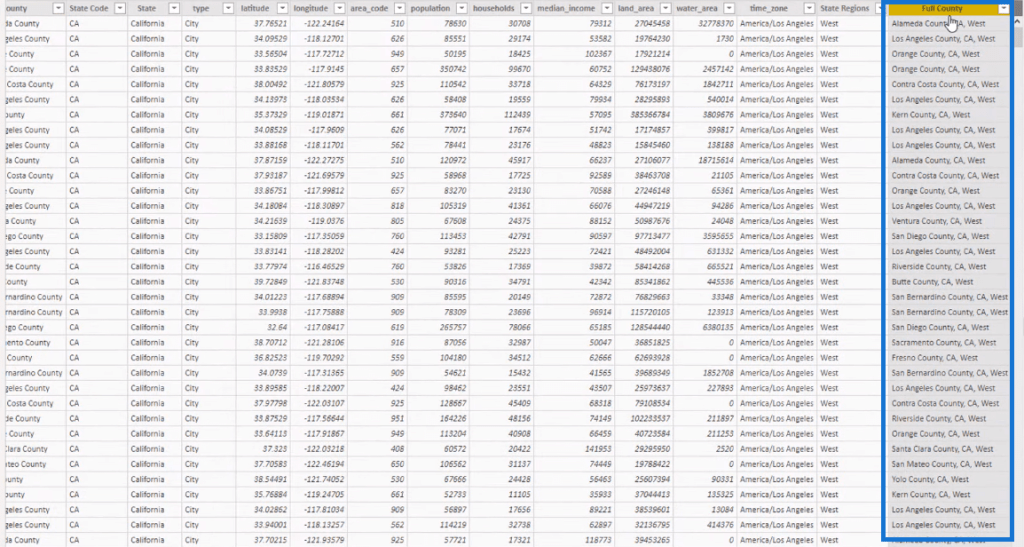
This gives you a good distinction between Counties. This way, you can now work a virtual table of the Counties that are in the data. Before doing this, you need to remove the ALL context from the Regions table.

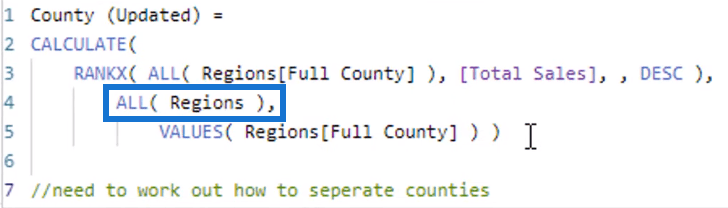
So, any context coming from the Region’s table doesn’t exist at this point in time. With the VALUES function, you can add back the context of the Full County column.
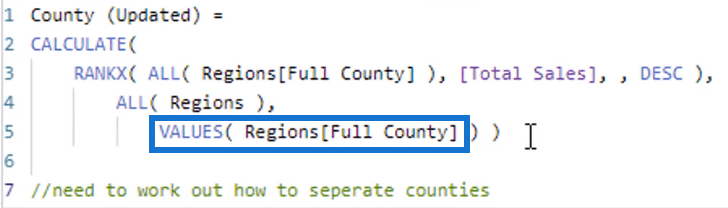
One option is to reference every column using the ALL function, but the better alternative is to get rid of all the context from Regions and only bring back the Full County. Once the context has been manipulated inside CALCULATE, the RANKX function starts its work from there.
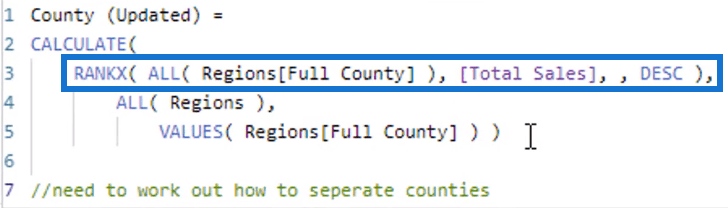
RANKX works through every single County at every row along with their Total Sales and then ranks them. That’s how you get the values of 1 to X under the County (Updated) row. As a result, filters and slicers won’t matter and won’t affect the ranking because the formula has been set to ignore them.
Other Practical RANKX Measure Power BI Examples
Now that you have learned the basics of RANKX and Power BI DAX concepts, let’s explore more examples of how RANKX is used. First, go through an example where RANKX is used to find the top and bottom values. The next example showcases RANKX as a way to segment or group results.
Finding Top And Bottom Values Using RANKX
A common usage of RANKX is when you want to find out your top or bottom values. For example, if you want to find your top customers or your bottom products, you can use RANKX together with other DAX functions.
In this first example, I’ll show you how to combine RANKX with CALCULATE and FILTER functions to see who our top customers are, not only for a static period of time but also through time. Then, we will showcase it in a sales matrix of our top 10 customers.
When we put the Quarter & Year and the Total Sales measures into a matrix, we get all of the results. This is great, but it can be very hard to see any insight and spot trends.
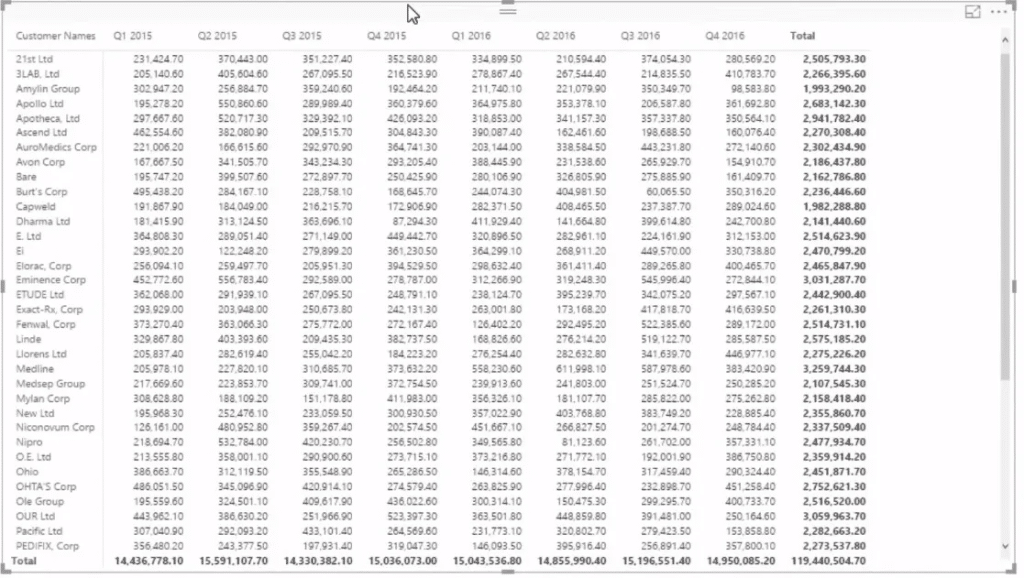
We want to see trends and determine who our top 10 customers are for this period. For example, did we have a customer who for a period of time was one of our top customers but has totally fallen away? These are the kind of insights we’re looking for.
We can do this using one formula. Here’s the measure that I created using the CALCULATE function to calculate our Total Sales for the customers who sit within the Top 10.
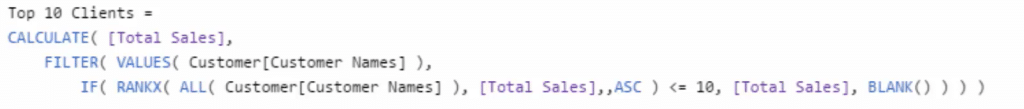
We have to use ranking logic to create a ranking logic indicator that will say that if this customer is in the Top 10, then return this Total Sales value. Aside from using RANKX in Power BI, we’re also going to use the FILTER function and then use VALUES, which is going to create an internal table for every single customer.
Then we need to think about what logic to write here, something that says “if the current rank is less than or equal to 10 equal to total sales if not, equal blank.” What’s really cool about filter statements like this is that you can write this type of logic inside.
So, we are going to use the RANKX function and ALL Customer Names because we are going to rank each customer in any particular context. The ALL gets rid of any filter on Customer Names so that we can complete this ranking.
We will then rank by Total Sales and rank in descending order, and then we will go less than or equal to 10. IF it does, we want it to equal to Total Sales, and if not, to go blank.
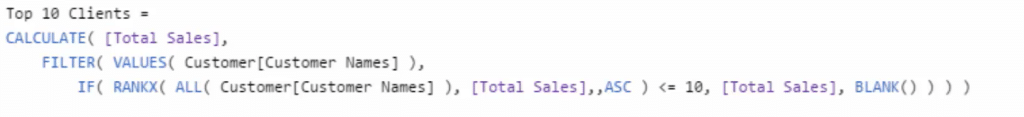
Lastly, we’ll substitute our Total Sales for our Top 10 Clients. We can see the Top 10 Clients for every single time period and implement conditional formatting to make it visually better. We can also use conditional formatting to have more compelling insights.

If you are selling to clients plenty of times, you will want to shorten the timeframe; but if it’s only you selling to customers 2 or 3 times a year, then you’ll want to analyze things from a longer-term time frame.
There’s another DAX function, called TOPN, which is also used for ranking insights. However, there’s still a big difference between TOPN and RANKX. Keep in mind that TOPN is a table function while RANKX returns a scalar value. The key is to understand the context that you put these functions into.
Combining Dynamic Grouping Using Power BI RANKX
Another great way to use RANKX is for segmenting or grouping results rather than just showing results by themselves without any context.
In this example, instead of just showing a generic sales result, I want to see if a customer was in the top-ranked results and then see if it changes over time. I want to understand how much of our sales are coming from our Top 5 clients, Top 5 to 20, and then the rest of our clients.
To see if there is a trend happening, we need to create dynamic groups and evaluate them over time. This is very difficult to do, especially if you’re working from Excel. But if you understand DAX really well, you can write a formula that does not take you long to write at all, and then it becomes a pattern that you can use over and over.
Here’s the measure that I created for this scenario:
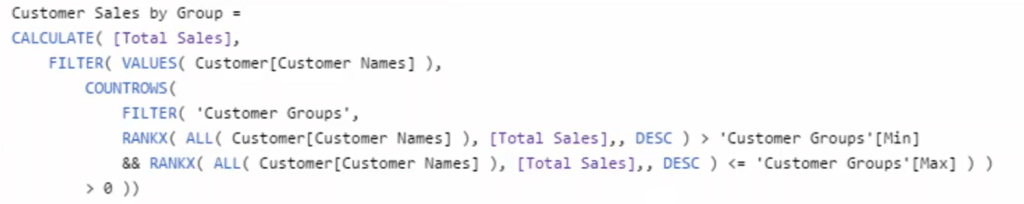
We start with the CALCULATE function because nothing happens without CALCULATE. Then, we add Total Sales because that is what we are summing up.
Next, we need to filter over a table of Customer Names that will iterate through every single customer, evaluate what their ranking is, and then see if their ranking is above or below the MIN and MAX that we just created.
The next step is to use the COUNTROWS function and the FILTER function again. Then choose Customer Groups, which is the table I created.
Then, we are going to iterate through this table using RANKX. We are calculating Total Sales at the top but the Customer Groups table is actually the ranking. We need to get the ranking of each of these individual customers and then see if they are within any of the groups that are in the Customer Groups table.
We will then rank them by Total Sales, and then choose DESC to rank them as 1 for the highest and 200 for the lowest. We will then close it off with a greater than the MIN for the highest-ranked customers. Lastly, we will use RANKX with the similar logic we used above, but then with less than or equal to MAX.
You can use this DAX pattern over and over in so many applicable scenarios. RANKX enables you to create dynamic ranking tables, giving you incredible ranking insights.
Conclusion
RANKX is simple function, but not easy function to use. The key is to focus on its nuances to be able to understand the function better. There are so many ways to the RANKX function in DAX calculations, especially when combined with different functions. You’ll be amazed at how flexible this function can be inside Power BI.
The examples that I’ve shown you in this blog are definitely the best ways to demonstrate RANKX, especially when it comes to its versatility in calculating any ranking type analysis. It can be used in a number of different scenarios.
The key takeaway here is that you really need to understand the context of where your RANKX function is being placed into.
I hope you find this content helpful and utilize this in your own work environment.
Cheers!
Sam


