In this tutorial, we’re going to cover how to calculate quarter on quarter sales differences using time intelligence in Power BI. You may watch the full video of this tutorial at the bottom of this blog.
We’re not just going to do it at a granular level- we are going to try and analyze trends based on quarter on quarter sales.
Sometimes when you are looking at something from a very granular level, your visualizations on a whole will become very busy.
If you can smooth out the results that you’re looking at, it enables you to produce a much more compelling visualization which shows something more meaningful than a busy chart, which shows every adjustment or change in your result through time.
It’s a two-fold example that I will run through here. Not only are we going to run through how to visualize time calculations around different time periods, one quarter versus another quarter, we’ll also be analyzing the difference.
Calculating Quarter on Quarter Sales
I want to show you how to create Quarter on Quarter Sales or how you can compare one quarter’s results to another quarter.
Then I will also show how to keep it dynamic, and how you can utilize the data model to discover the difference between the two quarters.
This is an example from a recent workshop that I ran by way of the Enterprise DNA webinar series. What we’re trying to do here is to analyze how our sales have fared on any one quarter and then compare it to a prior period.

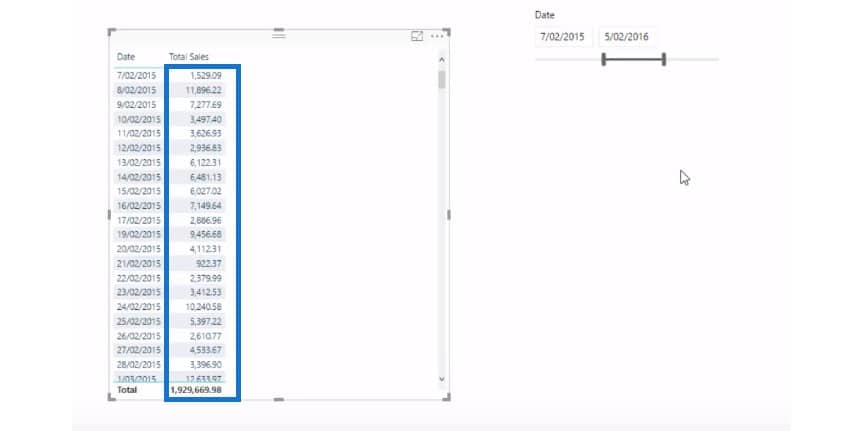
To come up with these insights, I first grabbed my Dates field and turned it into a filter (right), and then grabbed the Date column and turned it into a table (left).

Calculating Total Sales
If we calculate the total of anything (e.g. Total Sales, Total Profits, Total Costs, etc.), these are what I call core calculations. These calculations are very easy to do because they are just simple sums or simple aggregations.

Using The DATEADD Function
First, I’m going to drag the Total Sales into the table.
Now, if we want to compare on a quarter to quarter basis, we need to use time intelligence calculations. My favorite time intelligence calculation is the DATEADD function so I highly recommend familiarizing yourself with how to use the DATEADD function inside the CALCULATE function as you can see in this formula:

In this calculation, we referenced the initial core calculation, which is our Total Sales. We used the DATEADD function so we can jump back to any time period.
Since we wanted to do a quarter-on-quarter sales, all we had to do inside of DATEADD is to specify that we want to jump back one quarter.
This is my favorite function to use when it comes to time intelligence in Power BI because of all the variability and flexibility that you can put in this formula.
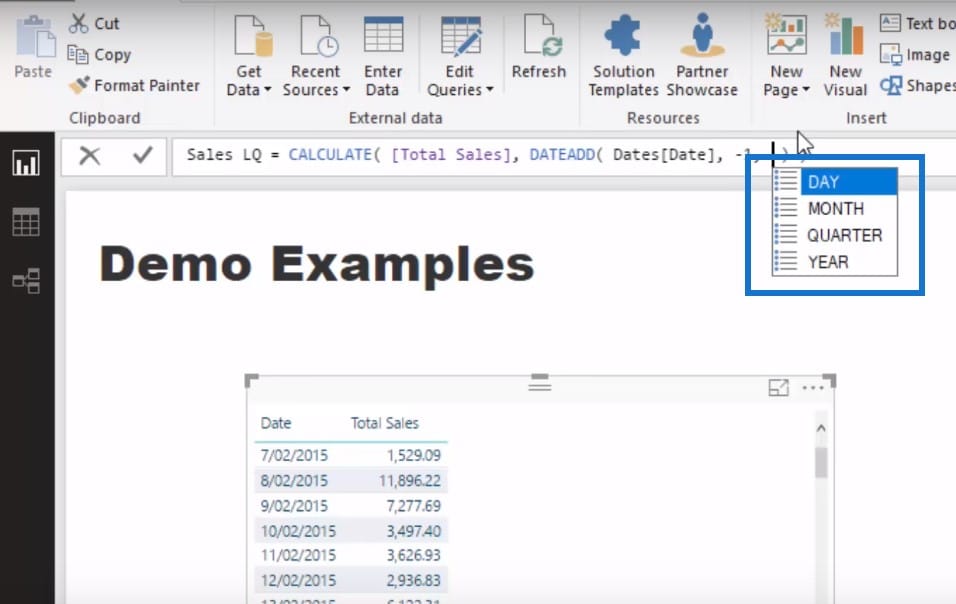
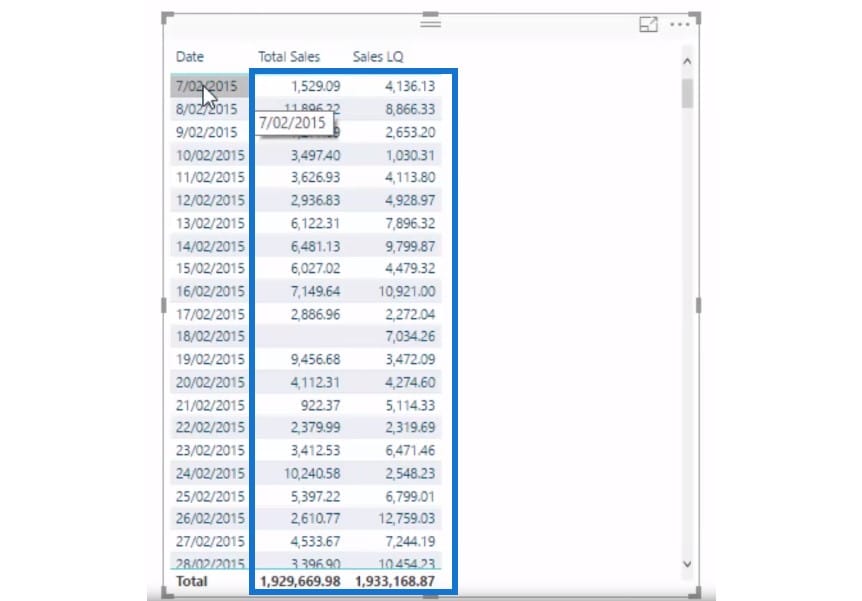
In this case, we’re just going to look at it from a quarterly perspective. Once I finish writing down this formula, I’ll drag it into the table.
You can see the Total Sales is being calculated from the current context, which means we’re calculating for whatever the particular day is.
However, the Sales LQ is calculating 1 quarter or 3 months ago from this day.
What’s so great about this calculation is how reusable it is. I’ll copy and paste the table I just made, grab my Quarter & Year measure, and drag it into the second table I have created.
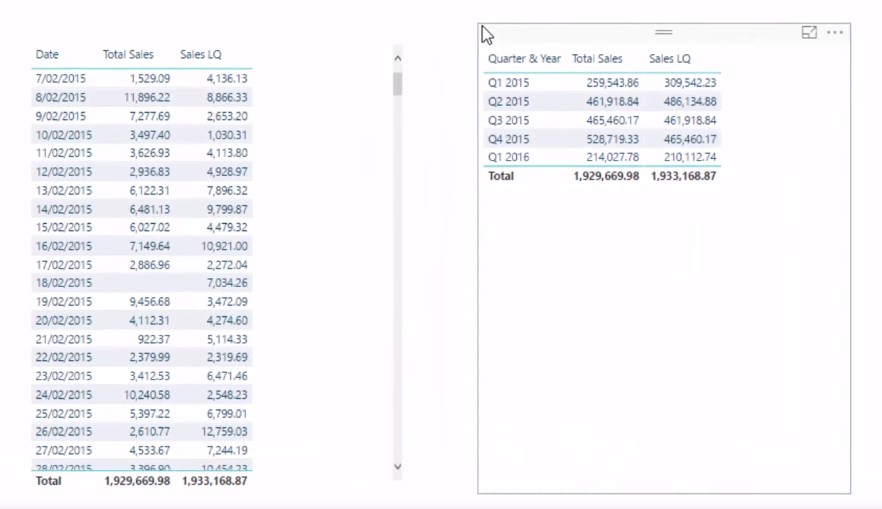
Now, we are getting the true Quarter on Quarter calculations, and the timeframe or window we’re looking at is being determined by the filter we have in place.
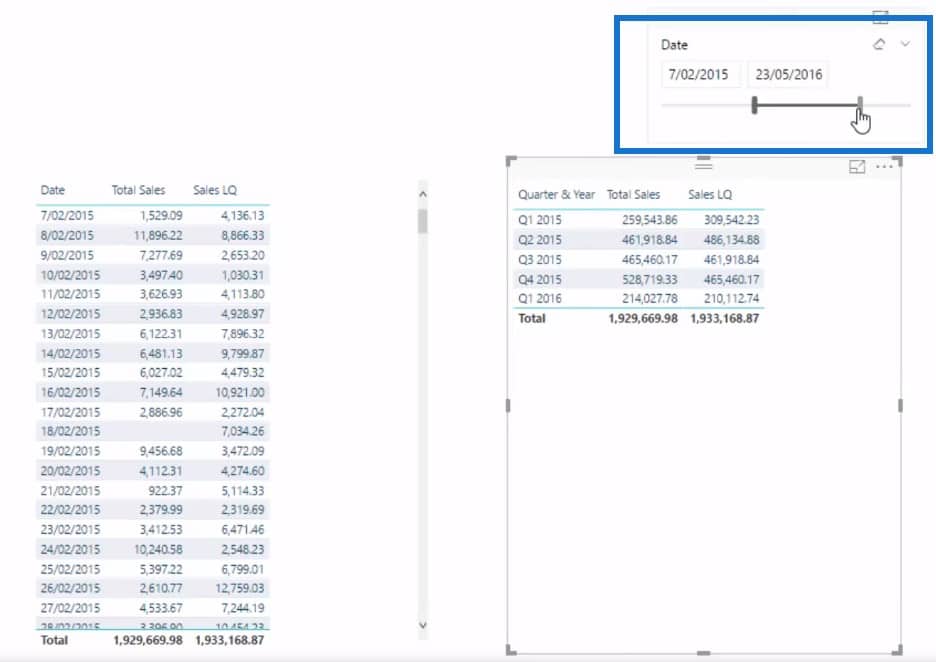
We can drill into any grouping of quarters and make a comparison of our Total Sales and our Sales Last Quarter.
Determining The Sales Change
We can also work out what the changes are by creating a new measure. The formula I’ve used is to deduct the Sales LQ from the Total Sales.

I’ve subtracted the time intelligence calculation we created using DATEADD from our initial core calculation. This gave me the absolute Quarter on Quarter Sales Change.
***** Related Links *****
How To Create Unique Financial Year Quarters Using A Calculated Column
Sorting Dates By Financial Year In Power BI
Filter Your Data By Unique Financial Years & Quarters – Power BI Modeling Technique
Conclusion
There’s so many different ways that you can you can utilize these techniques. We’ve honed in on quarter on quarter here, but you can do your calculations for month on month or year on year.
If you’re just starting out with time intelligence in Power BI, this is a really good technique to practice and get you going. You’ll understand how context and measure branching works, and how to use time intelligence calculations. Once you implement them well, you can ultimately create Power BI reports that look compelling and showcase really good insight.
For many more time related insights that you can discover and illustrate with Power BI, check out this detailed course module at Enterprise DNA Online.
Time Intelligence Calculations
I hope you enjoy this tutorial as much as I have.
Sam
***** Learning Power BI? *****
FREE COURSE – Ultimate Beginners Guide To Power BI
FREE COURSE – Ultimate Beginners Guide To DAX
FREE – 60 Page DAX Reference Guide Download
FREE – Power BI Resources
Enterprise DNA Membership
Enterprise DNA Online
Enterprise DNA Events


