This tutorial will discuss about Power Query tools and ribbons. You’ll learn how to be efficient in data modeling and will know your way around the editor. You’ll also learn about the different tabs, ribbons, and context menus and how they can help you achieve the perfect Power BI data report.
Power Query Tools And Layout
The Query Editor is designed to help users apply most of the common transformations by interacting with a set of ribbons and menus. To check the Power Query Editor options, open Power BI desktop and go to the File tab.
Next, Click Options and settings and select Options.

Select Power Query Editor under Global. You’ll then see the options for the editor.

It is recommended to display both the Formula Bar and Query Settings pane, allow parameters, and enable M Intellisense.

Power Query Tools And Ribbons
Power BI Desktop offers two ways to open the Query Editor. In the Queries section on the Home tab, you’ll see a Transform data button that is divided into two parts. The top half brings you straight to the Query Editor while the bottom half shows a menu that you can choose from.

The first option on the bottom half menu is Transform Data which brings you directly to the Query Editor. The other options are for the parameters and data source settings.

If you click Transform data, the editor will open in a separate window. In the editor, you can see ribbons that are organized in several tabs. The Home tab contains a collection of the most used query, table, and column level actions.

Save d

Power Query Tools In The Transform Tab
The Transform tab contains a collection of table and column level actions. Each function or button inside the tab transforms the contents of the table or the column.

This is a sample data used in this tutorial.
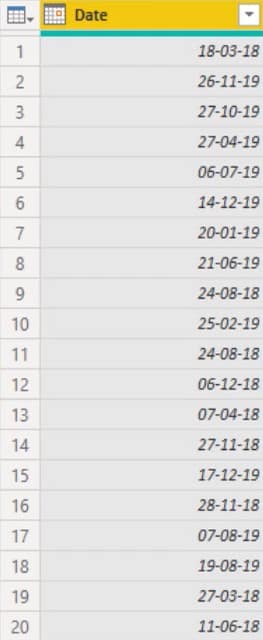
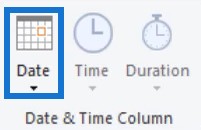
If you want to extract the year from the Date column of this sample data, click the Date column and then click the Date button in the Transform tab.
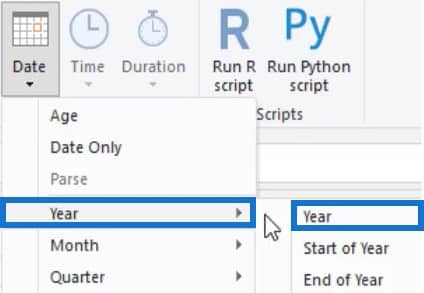
Next, click Year and select Year.
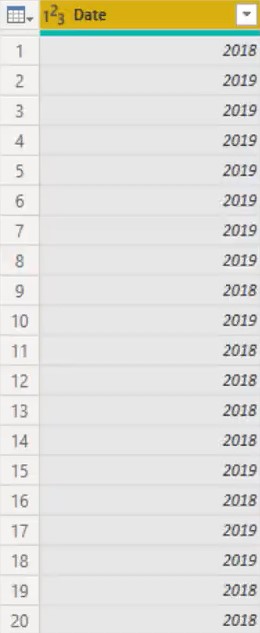
You can then see the year in the Date table.
Power Query Tools In The Add Column Tab
The Add Column contains a collection of column-level actions. Some actions inside this tab can also be seen in the Transform tab. The difference is that instead of transforming the contents of a column, it adds a new column for the selected transformation.

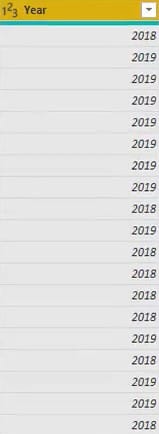
Using the same sample data, extract the year from the Date column. Next, click the Date column and select the Date button in the Add Column tab. Then, click Year and select Year.
After that, you’ll see a new column with the year.
Power Query Tools In The View Tab
The View tab contains options to enable or disable the visibility of the formula bar and the Query Settings pane.

The Tools tab contains all query diagnostic options. Query diagnostics offer insights into what the Power Query Engine is doing. Optional Tool tabs can be available depending on the return type of the query you selected.

For example, if you select Query in the Queries pane, an optional Text Tools ribbon appears. The same thing happens if you select other entities inside the Queries pane.
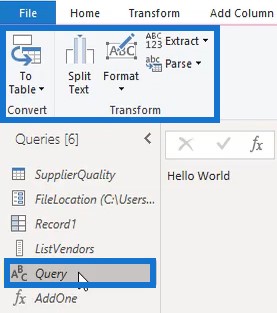
There are many ways to minimize and expand the ribbon. In the top right corner, you’ll find a toggle to minimize or expand the ribbon.
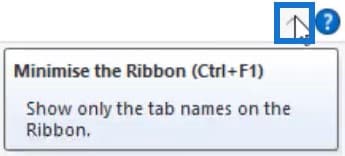
You can also right-click in the tabs area and select the Minimize the Ribbon option.

Another option is to use the Quick Access Toolbar at the top left of the editor.
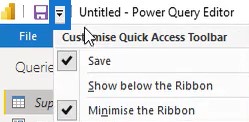
Lastly, you can also Hold Ctrl + F1 key to minimize and maximize the ribbon. If you prefer shortcuts to navigate the Quick Access Toolbar, press the Alt key to see the numbers or letters that they represent.

Formula Bar User Interface
Below the ribbon, you’ll find and see the formula bar. Having that visible means that you can see the M code that’s generated by the user interface. It is exposing you to the flow and syntax which will help you learn about M and allow you to quickly access and make changes to the M code.

You can add a manual step by pressing f(x) in the formal bar.

Query Pane
On the left side of the formula bar, you’ll find the Query pane. It contains a list of all the queries in the current file. The icon beside the query name shows its type.
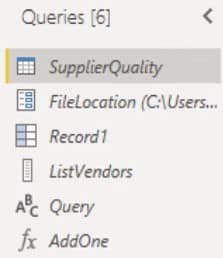
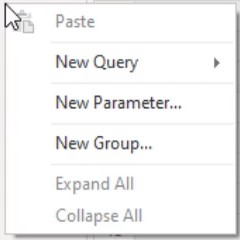
If you click on the blank space in the Query pane, a context menu will appear where you can create new queries, parameters, and groups.
To manage any of the existing queries, right-click the query name. You’ll see all of the different options that you can do with the selected query.
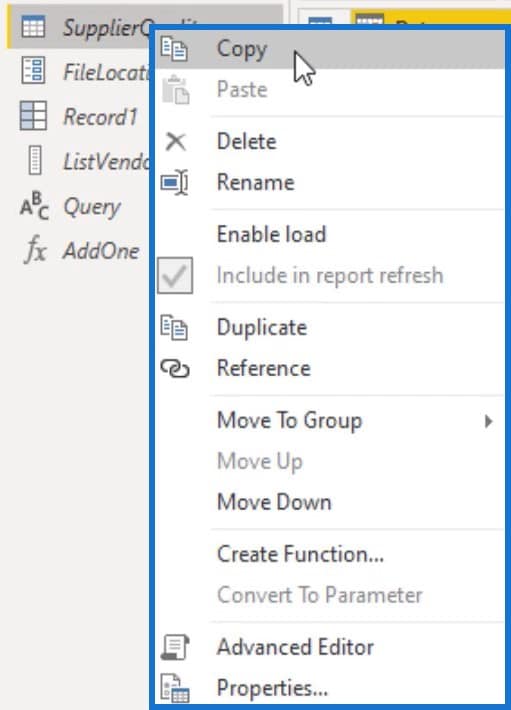
The Copy option is not only limited to the selected query but also to other relevant reference queries. The Enable Load option lets you load the query to the data model when Close and Apply is selected. The Include In Report Refresh option refreshes the query when a refresh action is triggered.
Duplicate copies the full M script of the selected query and is added to the query list. Reference returns the output of the selected query which is also added to the list. Below that option, you’ll find other options for grouping and organizing your queries.
You can open the advanced editor window by clicking Advanced Editor. You can also rename or add a description in the property dialogue box by clicking Properties.
Query Settings Pane
On the right side of the editor, you’ll find the Query Settings pane with the Applied Steps. This is where you rename your query and get access to the property dialog box. The Applied Steps pane contains a list of all the transformation steps made in the query.
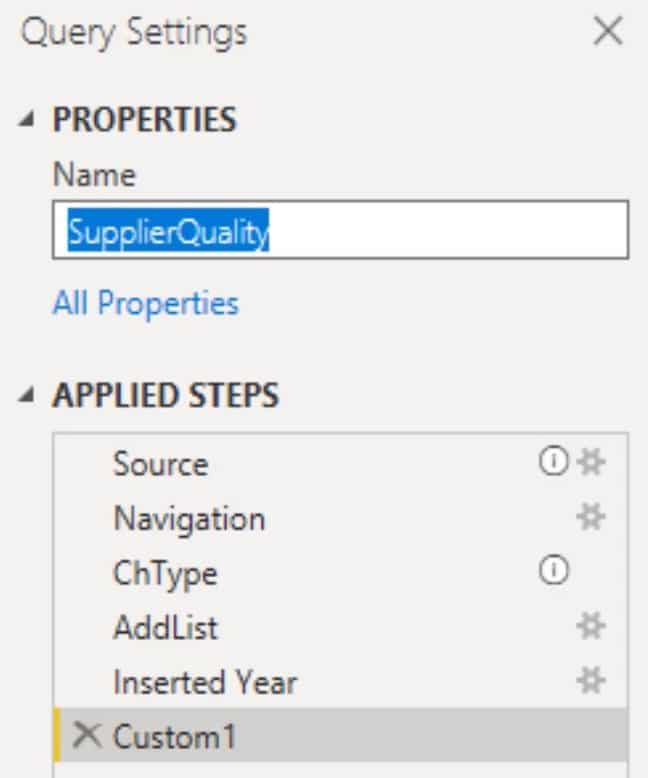
The gear wheel icons inside Applied Steps give you access to the associated dialog boxes. For example, if you click the icon beside Source, a dialog box will appear.
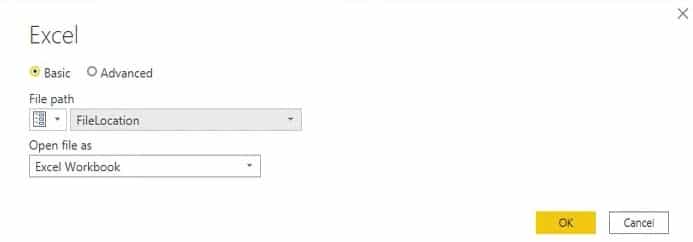
Exclamation marks beside the icon show that there are common activities done in the step. You can view the information by hovering over the mark.

Steps in the Applied Steps have a right-click context menu. If you right-click any of the steps, you’ll see options that you can utilize.

Edit Settings is only available for steps with a gear wheel icon. Once you delete a step with the Delete option, you can’t undo the action. The only way to bring the step back is to repeat the same transformation. The Delete Until End option deletes the currently selected step until the last one.
The Insert Step After option creates a manual step. It returns the previous step name as a result of that newly added step. Extract Previous splits the query in two on the previous step and references that output in the source step of the original query.
View Native Query is enabled when query folding to the source is possible. Lastly, Properties opens up the property dialog box and lets you rename and comment the selected step.
In the center of the screen, you’ll see the Preview pane. It has an additional context menu that is only available for queries that return at table type. The type is indicated by the mini table icon in the top left corner

Context Menus In Tables And Columns
If you click on the icon shown below, the menu will appear which gives you access to the table and add column options.

Columns also have a context menu. To open the menu, right-click a column header. It has many column transformation options from the ribbon. However, the contents of the menu change if you select multiple columns.

If you want to select a continuous range of columns, hold the Shift key and click the column where you want the range to end. But if you want to select a non-continuous range, hold the Ctrl key and click the column you want.

If you right-click one of the selected column’s header, you’ll see that the content of the context menu is different. Only a subset of transformation action remains. It is because not all transformations can be applied to multiple columns at the same time.

Right-clicking the green line directly below the column header reveals a context menu to resolve issues with column quality.

A secondary preview pane becomes available when you click the white space in a cell that contains a structured data type. You’ll then see the pane below the main preview pane which allows you to view a sample of the contents within the data.

At the bottom of that pane, you’ll see the status bar where you can change the number of rows that is being profiled. Column profiling is performed on the top 1000 rows, but you can change the setting to the entire dataset for each query. However, scanning the entire dataset has a negative impact on performance so it’s recommended to always set it to the top 1000 rows only.

The Quick Access Toolbar User Interface
The quick access toolbar, which you can find at the top left of the screen, allows you to access and customize the tools and items.

By default, there is only one option available, which is the Save option. But you can customize its contents by right-clicking an item from the ribbon and selecting Add to Quick Access Toolbar.

Doing this will make the item appear on the top left of the screen.

To remove it from the toolbar, right-click the item and select Remove from Quick Access Toolbar.

For items that you often use, make sure to place them in the Quick Access Toolbar so that they’ll always be visible on your screen. You won’t need to navigate the ribbon to find and access items and tools.
Another advantage is that these items are assigned a shortcut. If you press the Alt key, you’ll see that each item is assigned with a numeric value.

In this example, pressing Alt + 1 will save your work; pressing Alt + 2 will open the Advanced Editor window.
***** Related Links *****
Extended Date Table Power Query M Function
Power Query Table: How To Dynamically Merge Columns
Extract Values From Records And Lists In Power Query
Conclusion
Having the right tool is not enough. You have to learn and master how to use it efficiently to maximize productivity. In this case, knowing your way around Power Query tools and the user interface will help you build impressive data reports and improve your data development skills.
Melissa


