In this post, I will show you some Power BI tips and techniques on finding the previous value that accounts for weekends and holidays. This came up in a post by Brian Julius in the Enterprise DNA forum. You may watch the full video of this tutorial at the bottom of this blog.
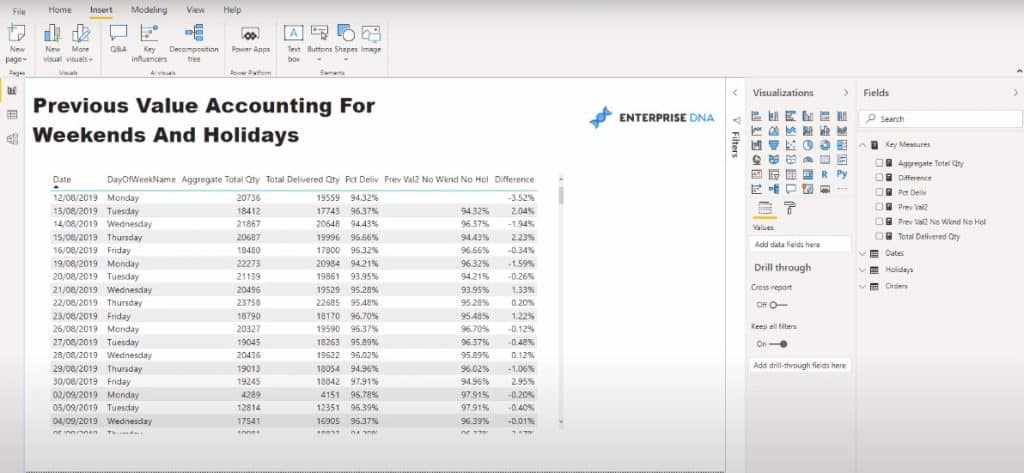
The developer of this report wanted to calculate the percentage difference. However, the developer didn’t want to just look at the percentage difference one day after the next; they wanted to know the difference for when a store is open from Monday to Friday.
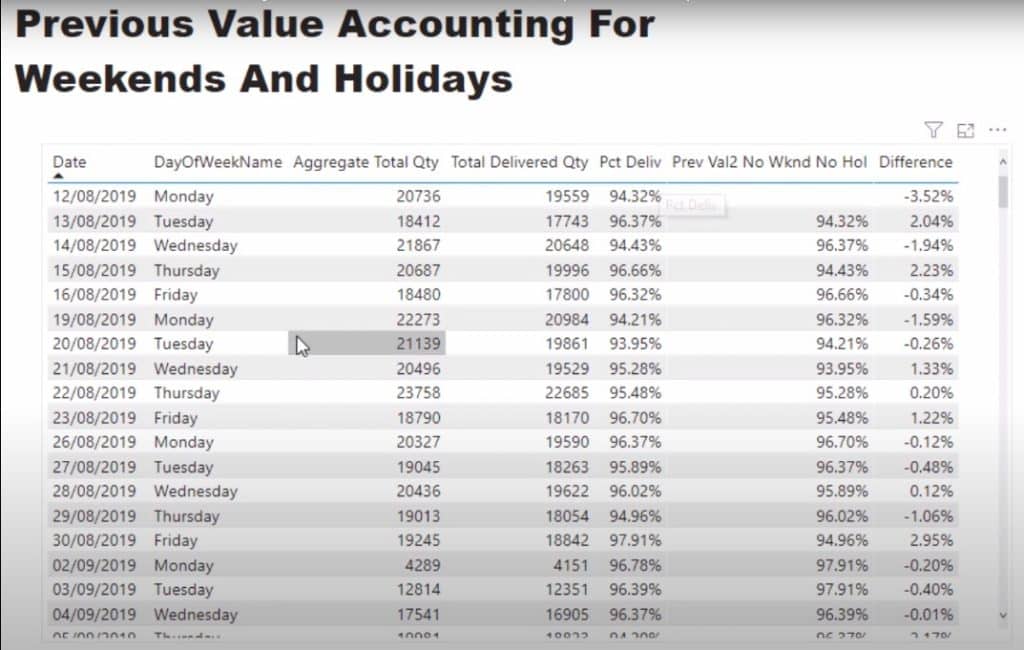
So when we get to Monday, we need to grab the previous value.
What makes things complicated is that we’re looking at percentage values.
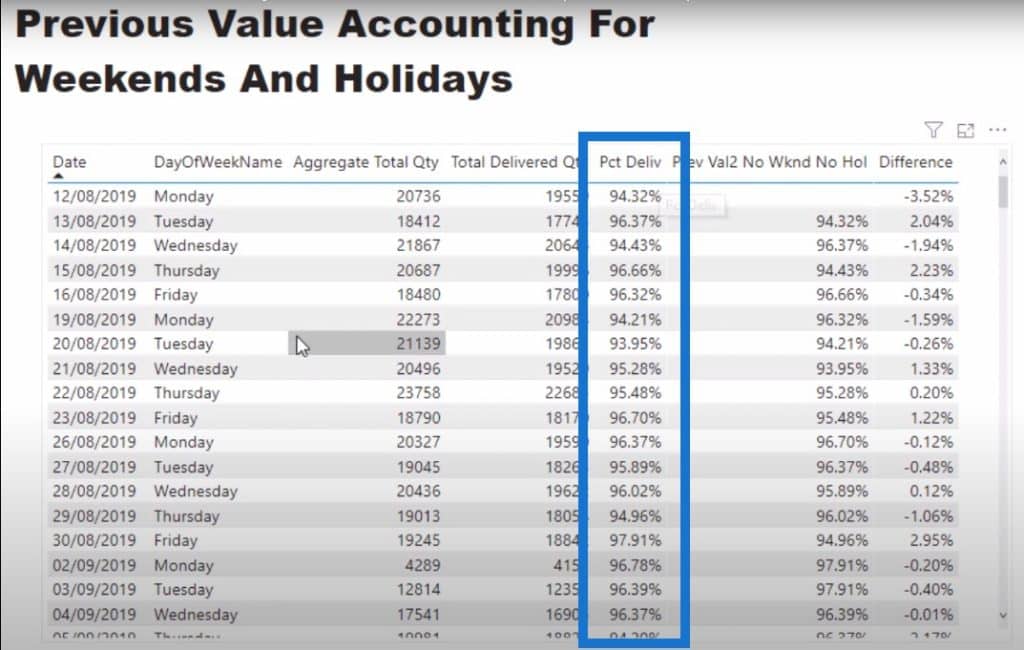
The first thing we need to do is to calculate the percentage, and then work out the logic to retrieve the value from the prior day that the store was open. We need to take into account not only the weekends but also holidays if they are a part of the date table as well.
Here’s one of the Power BI tips I always like to share: if you want to include holidays within your date table, check out the forum where I’ve created a video on how I create my date tables.
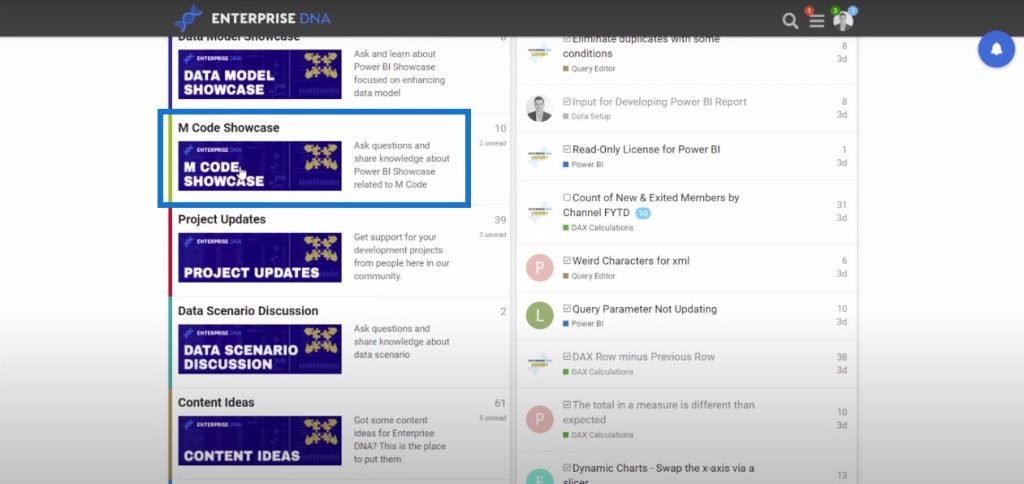
Go to the M Code Showcase and then click on Extended Date Table.

This is the ultimate date table which has been created by one of our Enterprise DNA experts Melissa de Korte. This is constantly updated and it enables you to create holidays.
There’s also a video on our YouTube channel that shows you how to add the holiday table to this particular code.
You’ll just need to input this code first, and then import your holidays.

After we have done this, we can then create a formula which calculates a result but changes the context in which it shows the result.
For example, if you look at the results for Monday, Tuesday, Wednesday, Thursday, and Friday, you’ll see that they take us to the next day.

When we get to the next Monday, we can’t use the time intelligence function PREVIOUSDAY because this function doesn’t work when you’re trying to skip certain days or have to bring in the holidays. For example, on Monday, I want to retrieve Friday’s result or the last day that the store was open.
In this particular solution, there are multiple calculations being built up one after the other. Here is the ultimate formula that we need to make the entire thing work.

Let’s break down this long formula, which looks more complicated than it really is. We’re trying to get the current date as well as the previous date, taking into account the things we’re trying to avoid, like weekends and holidays.
We’ll calculate the MAX date, but then we also have this list of logic that we need to iterate through within the FILTER function.

Not only do we need to calculate the MAX date, but we also need to change the context in which we calculate that MAX date. We want to filter and go through all the dates, which is what the ALL function is doing here.

Then we want to look only at the dates which are the SelDate or the current date. We want to avoid any days of the week that are 6 (Saturday in the date table) and 0 (Sunday in the date table).
Also, if it’s a holiday, it will be equal to FALSE. This is where the holiday part of the date table comes in.

You can embed all of this logic into the FILTER function to retrieve a value.
When we have the MAX date or the previous date, we just need to insert it into this part of the formula:

In this section, we’re calculating the orders that were delivered on the previous date by again using the FILTER function to filter all the dates that are equal to the previous date. So for this part, we’ll only retrieve the delivered quantity from the previous date.
And then for this section, we’ll do the exact same technique to get the total quantity.

Then we’re going to divide the first variable (PrevDeliv) by the second variable (PrevAggQty) to give us the percentage result of the previous day.

To retrieve the previous value, the calculation jumps back to these two values I’ve highlighted to dynamically give us the change.
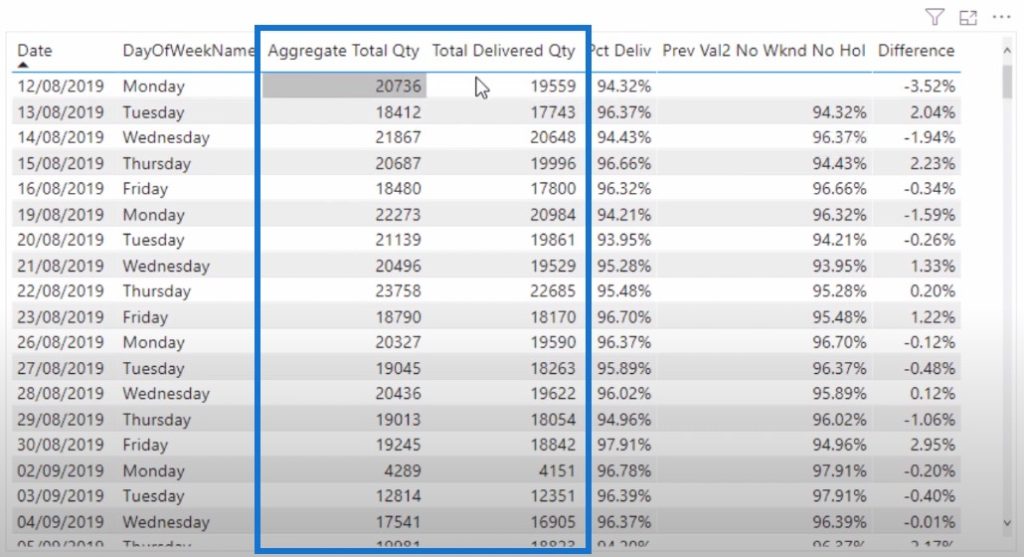
If we want to work out the difference between the results of the current and the next day, we have to subtract the previous value from the percent delivered.
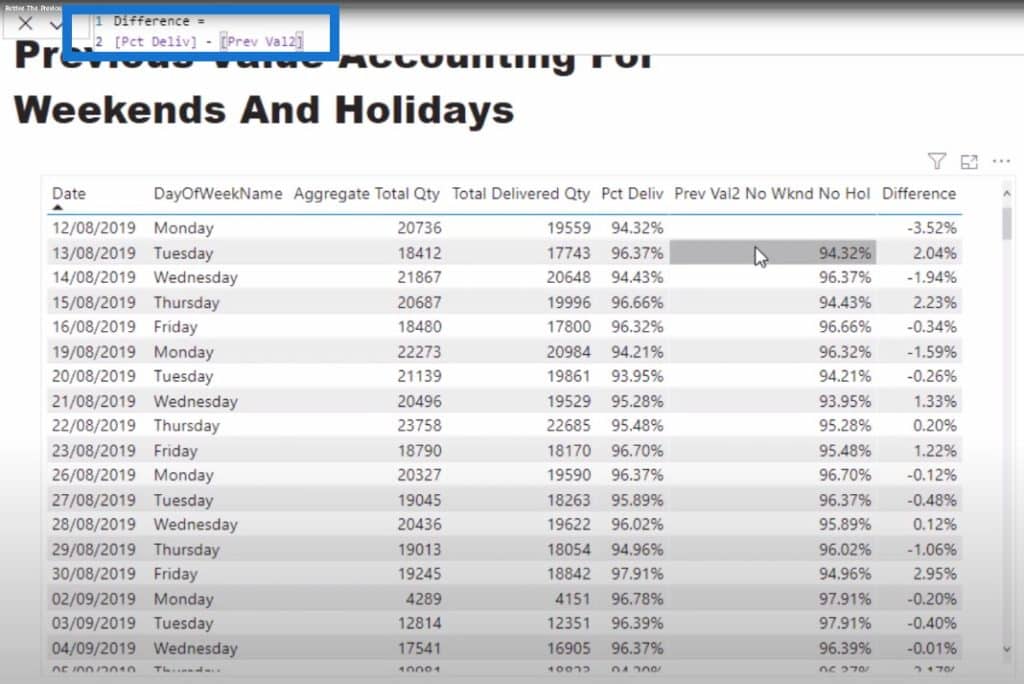
I think what Brian did in the solution is he originally created this using different measures, and then he put it all together.
It is important to build it up first so that you understand each part of the formula.
After all, it’s hard to dissect what each variable is doing in a big formula like this. So one of my Power BI tips for this tutorial is to build it up first in individual measures, and then put them next to each other within a table. Once you have the right result and you don’t need any of these intermediary measures, you can aggregate them into one measure using variables. This is a clean way to showcase things in the measure area.
The DAX Cleanup Tool
As you can see, we used quite a long formula. I’m going to copy this formula and use it to showcase our DAX cleanup tool.

I pasted the entire formula here and clicked on the Format button.
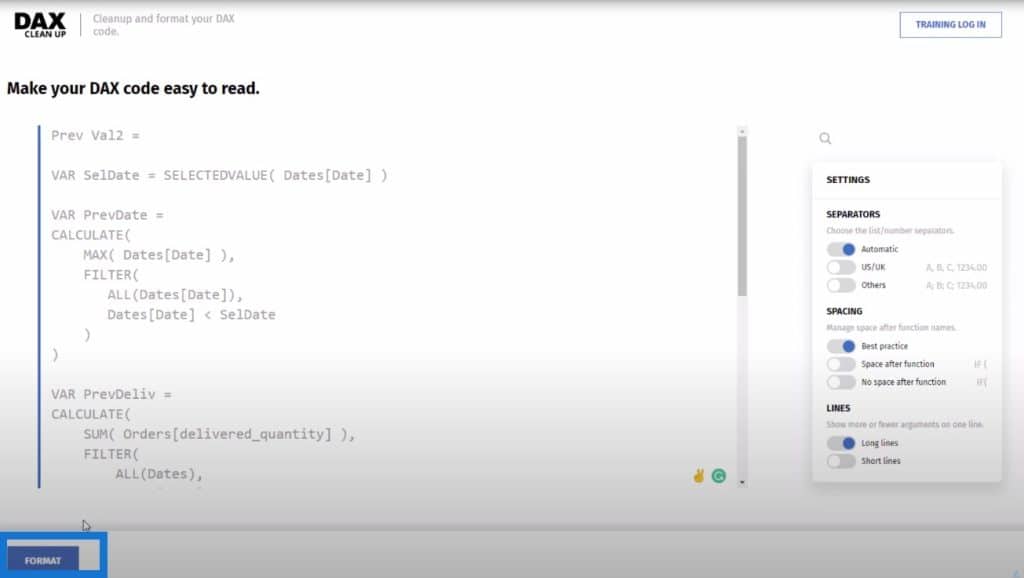
You can see that the formula is shown in a slightly different format. I prefer this one because it’s more condensed and reads easier.
There might be a few adjustments you need to make, which you can do by clicking on the yellow Edit button.
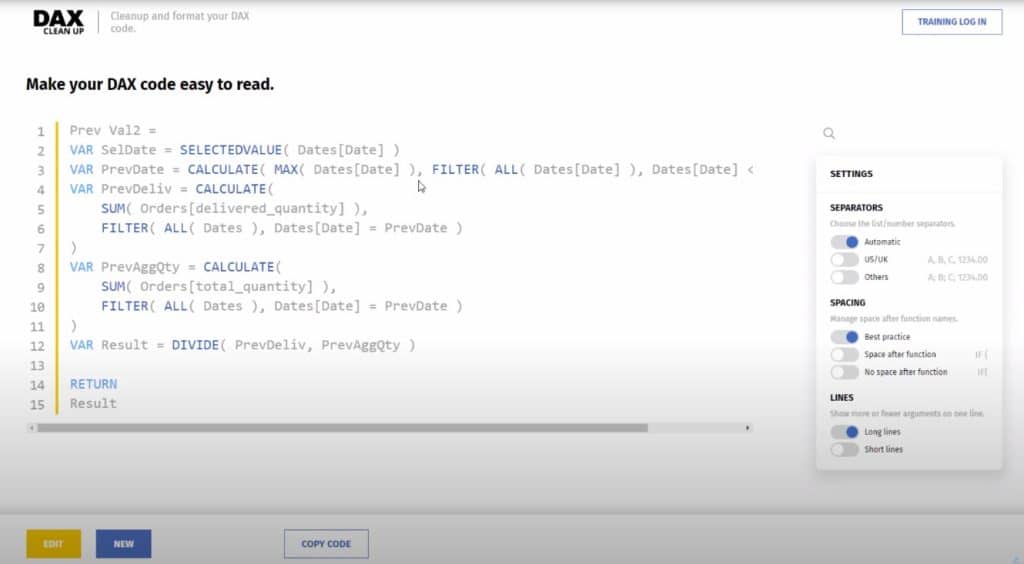
Once you’re done editing the formula text, click on the Commit button.
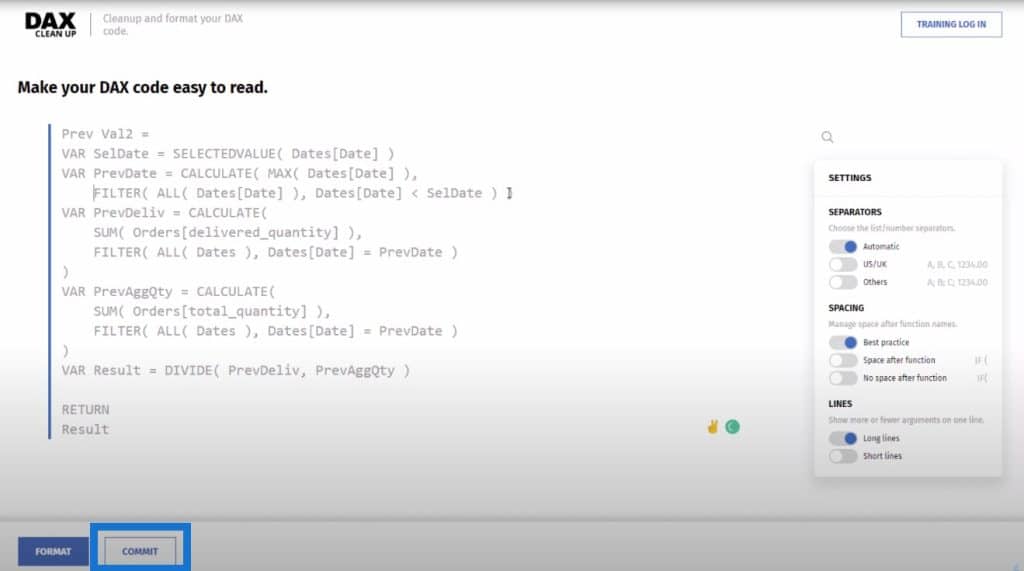
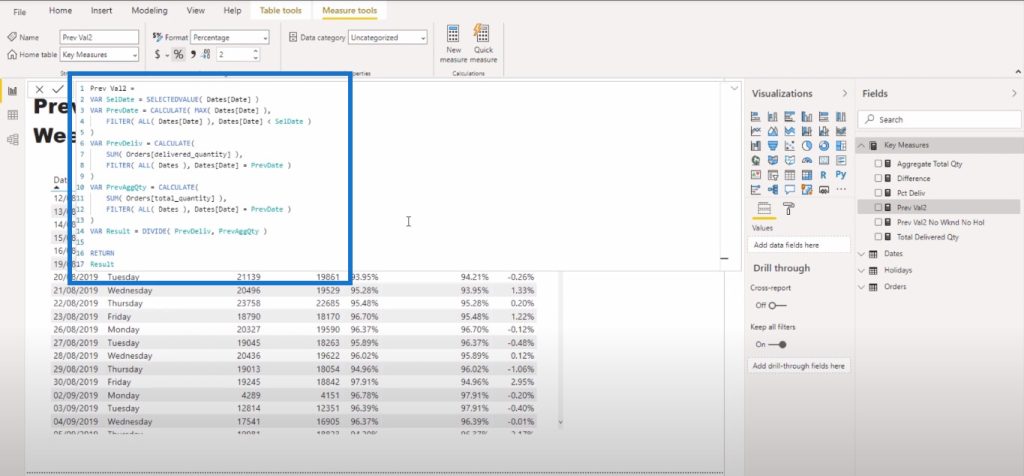
You can just copy this code and replace your old code with the reformatted one. In my view, the condensed version is easier to understand.
***** Related Links *****
AVERAGEX: Calculating Average Per Day In Power BI
Using Variables In Power BI – A Detailed Example
Showing Month to Date (MTD) To Current Date In Power BI Using DAX
Conclusion
There are a lot of exciting updates to the DAX cleanup tool, which is part of our Analyst Hub platform. You can use this tool so that other users will have an easier grasp of your formula.
I also want to reiterate the importance of building up individual measures in a lengthy formula like we just went through.
Many thanks to Brian, who provided epic support in this forum thread. If you liked this tutorial, don’t forget to subscribe to Enterprise DNA TV to learn more Power BI tips and tricks.
All the best,
Sam


