
Showing month-to-date calculations to the current date (i.e. today) in Power BI is a common problem that I see all the time. The same goes with quarter- t- date and year-to-date. I’ve been asked this on the Enterprise DNA Support Forum quite a lot so it’s timely to create a tutorial around how to solve it. You may watch the full video of this tutorial at the bottom of this blog.
In this tutorial, I’m going to show how you can solve this quite easily using DAX formulas.
Many times when you showcase time comparison information, you want to show some results versus the previous month or the same month the previous year.

Historical information is usually projected for the entire month. The problem comes in when you might be in the middle of the month and you only want to show up to the current date.
So I’m going to show you how you can show the true like for like comparison. To illustrate this, I’m going to work with 20 days into the current quarter. In this example, we’re comparing to the first 20 days of the quarter last year.
Time Comparison Using DAX
I’ve already got a few measures here so now we’re going to create quickly the quarter to date number. To do this, we click on New Measure and then write the formula in the formula bar.
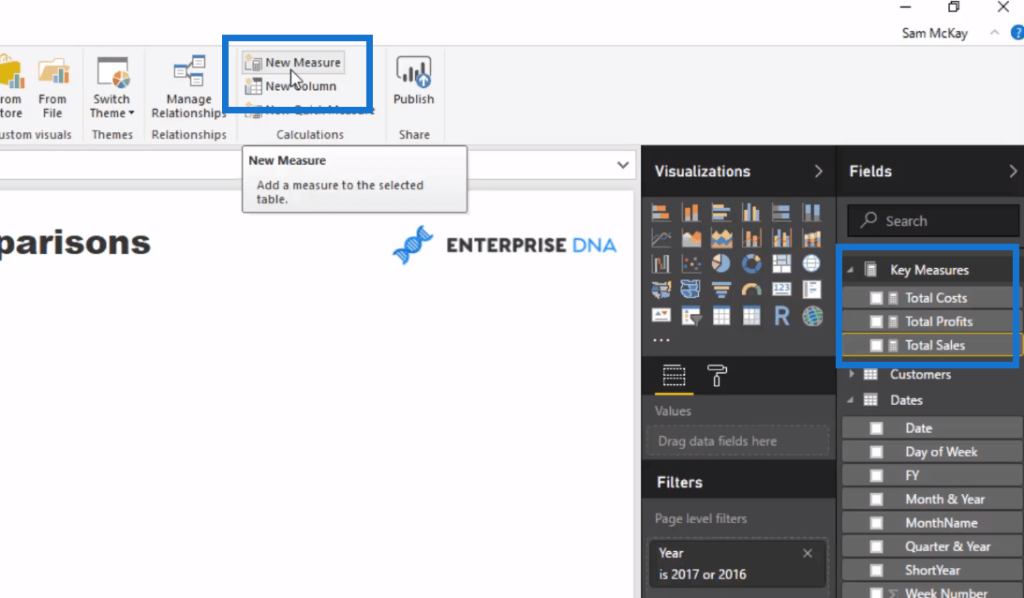
We name this formula Sales QTD, and then use Time Intelligence functions. Using these functions are not too difficult. It’s just a matter of understanding which one to use. In this case, we are using the CALCULATE function.

We then grab it and put it inside the table, and we’ll see the results.
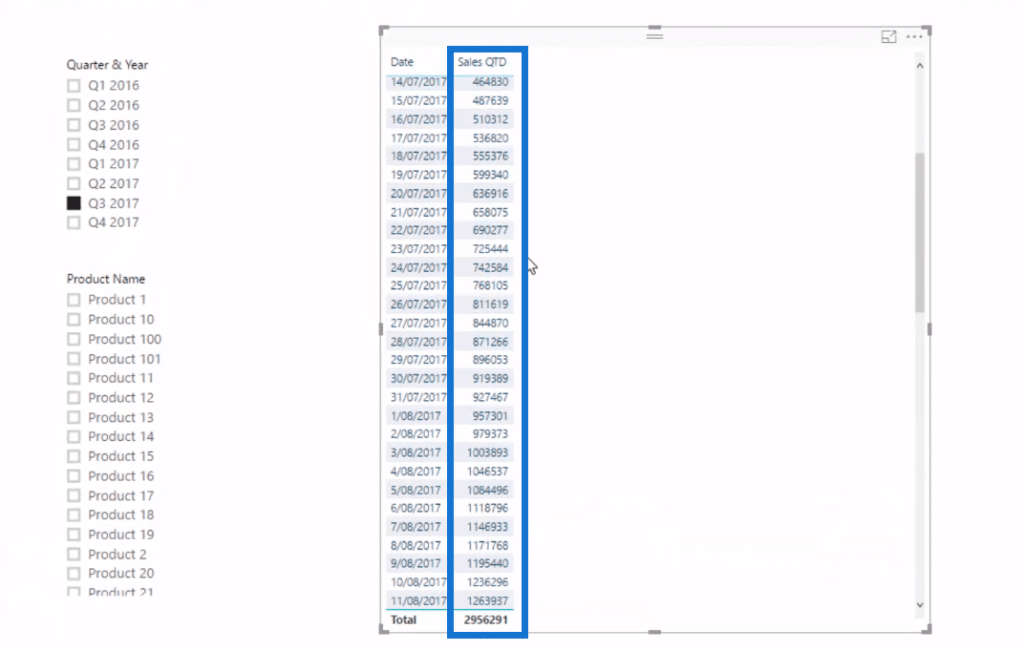
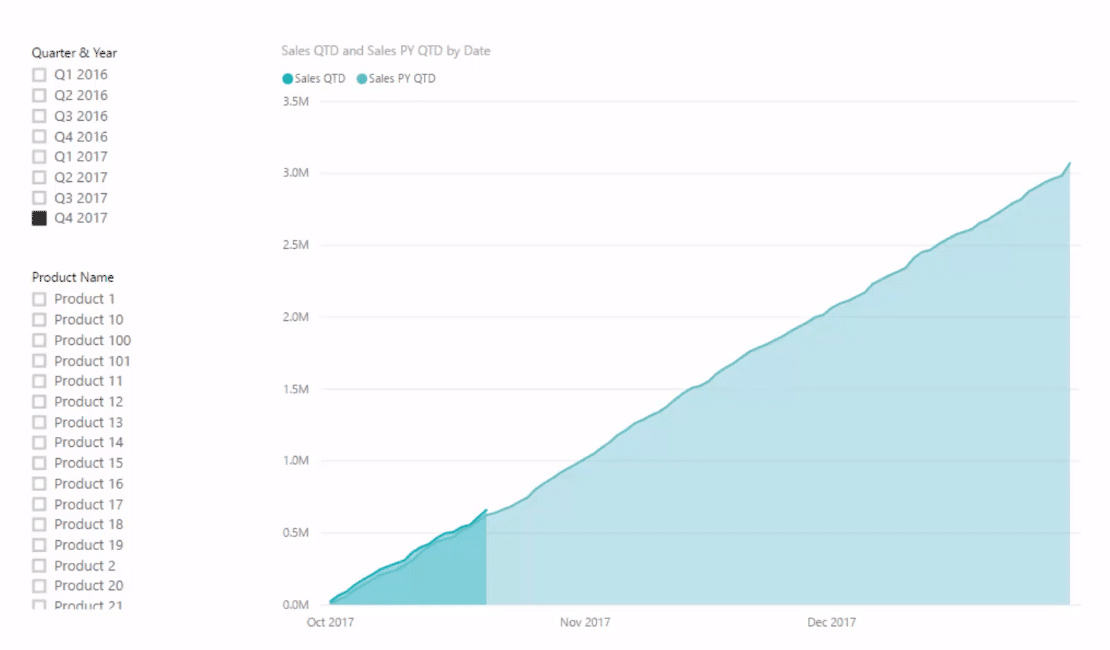
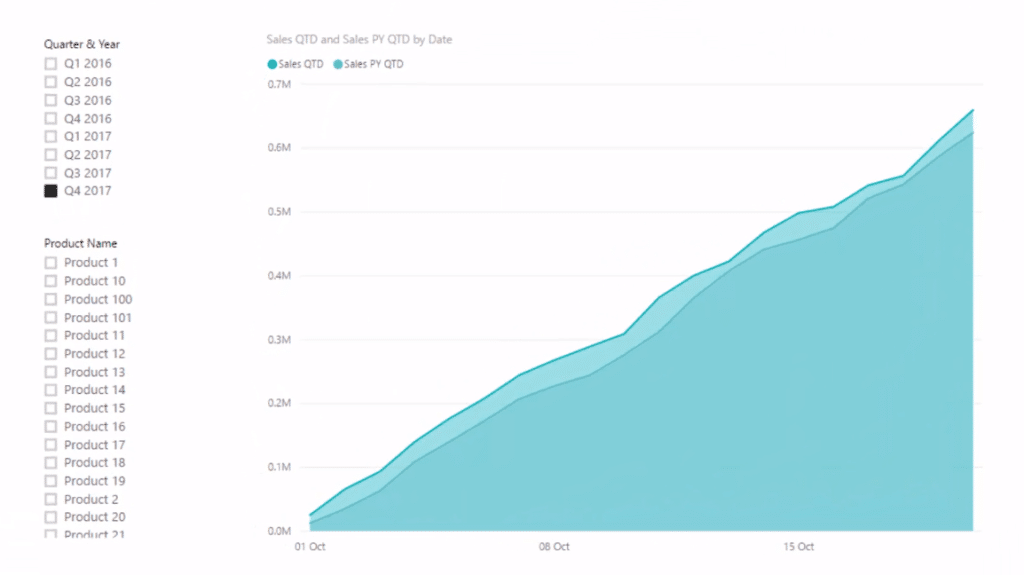
We can also put this into a chart, and we see that this is showing a quarter to date number. We use the date slicer as well and quickly change the time frame.

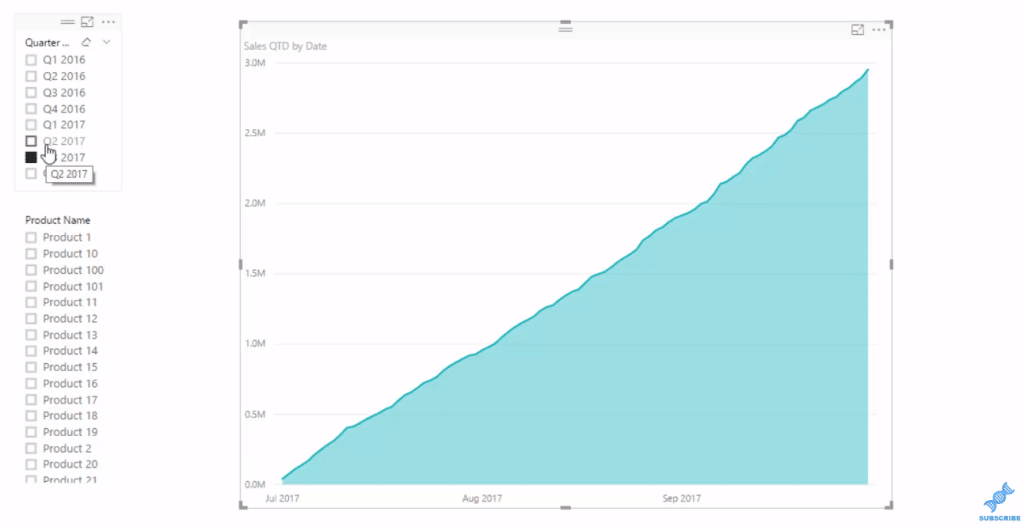
So for instance, we’re now in quarter 4 and we’re only going to have information up to the last twenty days because in this example it’s the 20th of October. To show that, we need to get our previous year’s numbers. First, we need to work out the previous year sales.

In this formula, we use the DATEADD, which is another Time Intelligence function. We’re comparing to the previous year, so we need to jump back a year here.
Since we wanted to go from sales previous year to sales previous year quarter to date, we simply need to replace the Total Sales inside our Sales QTD formula to previous year (Sales PY) to get our Sales PY QTD.

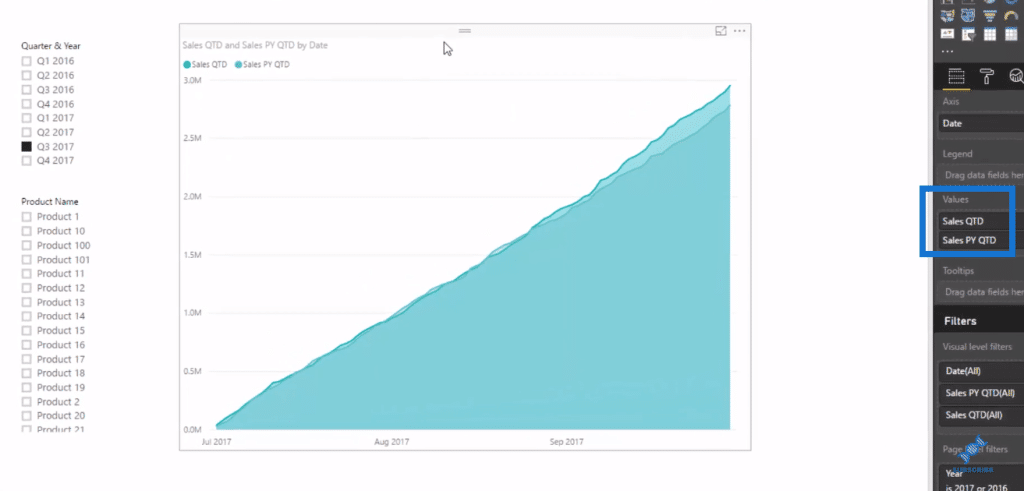
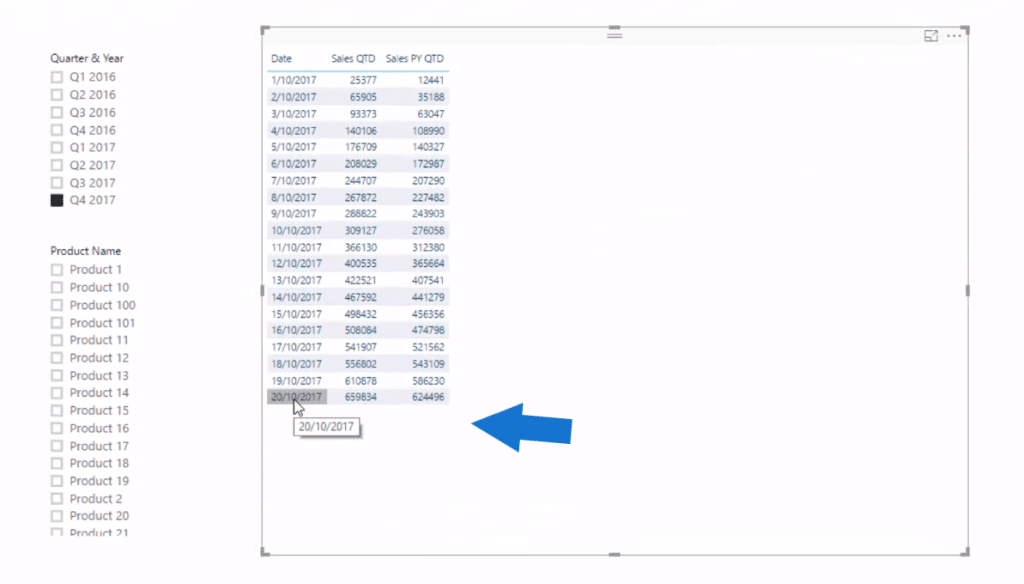
After which we drag it into our table and we can see the comparison of sales quarter to date (QTD) in the current context versus the prior year.
Now I’m going to show you what you probably have if you’re looking at live data. I’ll use this formula for our Total Sales to demonstrate it.

With IF logic, this is probably what you see in your data. You have sales quarter-to-date or it could be month-to-date or year-to-date, and then you’re looking at the entire number for the previous year.
We want to highlight only a certain period, so we need to implement some logic to enable us to do that.
Showcasing True Time Comparisons
To show the true Power BI month-to-date, quarter-to-date, or year-to-date time comparisons, we need to get rid of or blank out the numbers that are past today or where they sit in the current context.
In the table below, we see that this is exactly today, 20th of October. We need to blank out this number if it’s greater than this date.
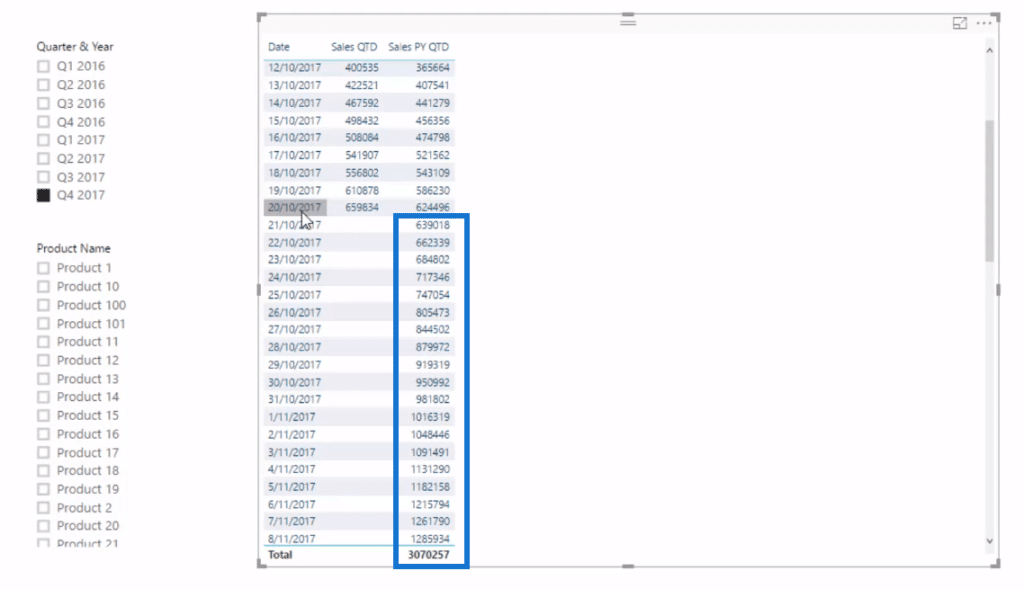
All we have to do is jump to our Sales PY QTD and wrap some IF logic around it like so.
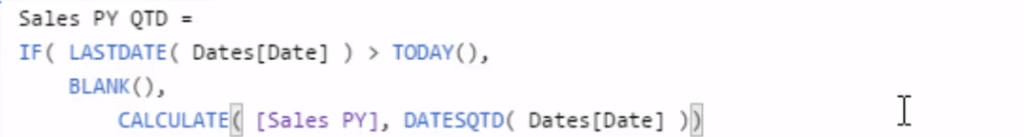
This logic is saying, “if the last date is greater than today then make that equal to blank; if not then equal to the result”, and that’s going to do the work.
We see also the changes in the chart because the chart will not return blank values.
What’s great about this calculation is that it’s live, so as we go through time, the TODAY field is going to update and will give us the additional date or days worth of data every day.
***** Related Links *****
Prevent YTD, QTD, MTD Results Extending Forward In Power BI
Time Comparison For Non Standard Date Tables In Power BI
Calculate Financial Year To Date (FYTD) Sales In Power BI Using DAX
Conclusion
In this article, I take you through the exact steps to follow and some of the DAX formulas that you need to implement to show true Power BI month-to date, quarter-to-date, or year-to-date time comparisons. I used quarter to date (QTD) in the demonstration.

I ran through how you can effectively change your visualizations to illustrate the information in your Power BI reports in a compelling way. There’s plenty to learn around DAX formula visualization techniques.
With this blog tutorial, you will understand how to effectively manage time intelligence or time comparison-type information really well in all your Power BI reports.
All the best with this.
Sam


