In this Power BI Report Builder tutorial, you’ll learn how to add a sparkline chart in your paginated report. A sparkline chart is a small chart that provides a visual representation of a specific set of data. It indicates trends or progress over time.
Group Properties For Power BI Sparkline Chart
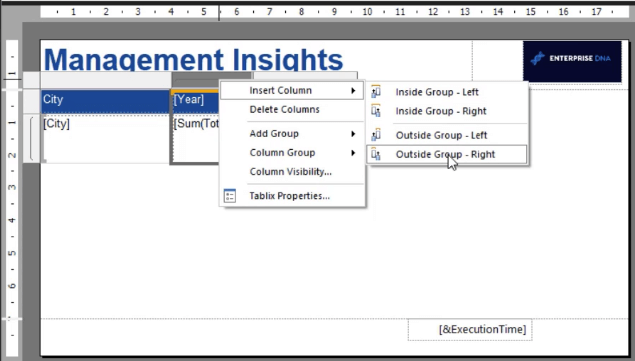
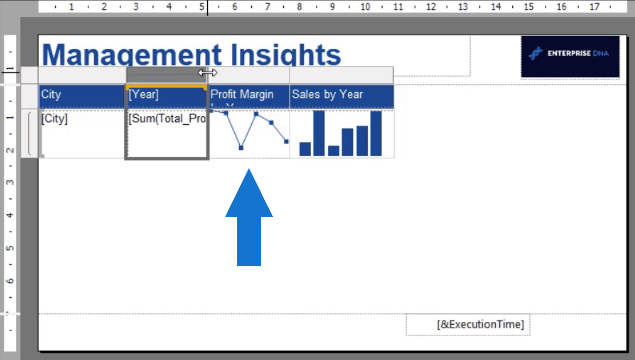
Click on your matrix and select Insert Column. Then, click Outside Group – Right. This will create a new column to the right of your matrix.
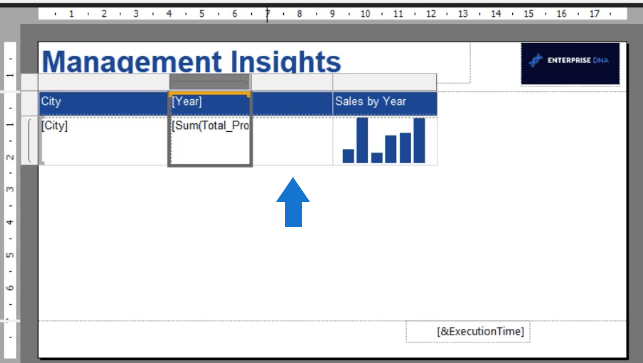
At the bottom of Report Builder, you’ll see two tables that contain the Row and Column Groups. These define the granularity of the data. In this example, the Row Group is City while the Column Group is Year.

The Sum of Total Profit data is grouped by Year. When you run the report, this data will split into the number of years in the data model.
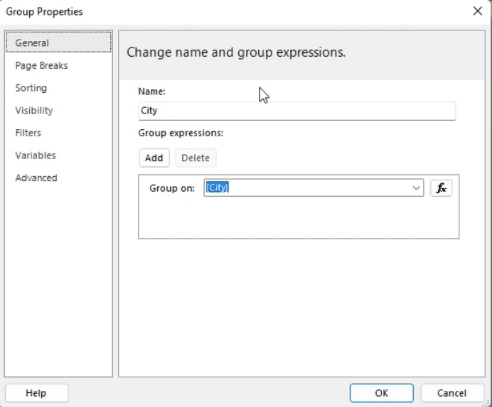
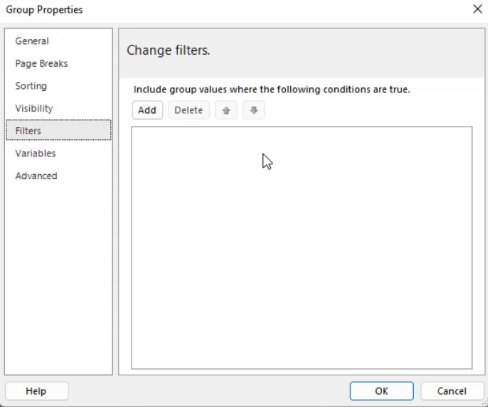
The new column is grouped outside the Column group, but it belongs within the Row Group. If you click the drop-down arrow of an item in the group, you can select the Group Properties option.

This opens the Group Properties window where you can format a group according to your preference. You can change the group expression. This also allows you to set a page break between each group instance.
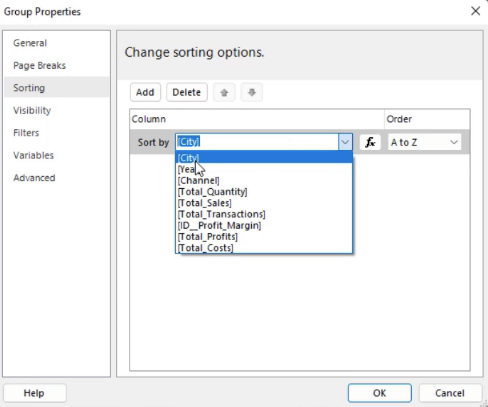
You can also change the Sort by and Filter by options.
Add & Format A Power BI Sparkline Chart
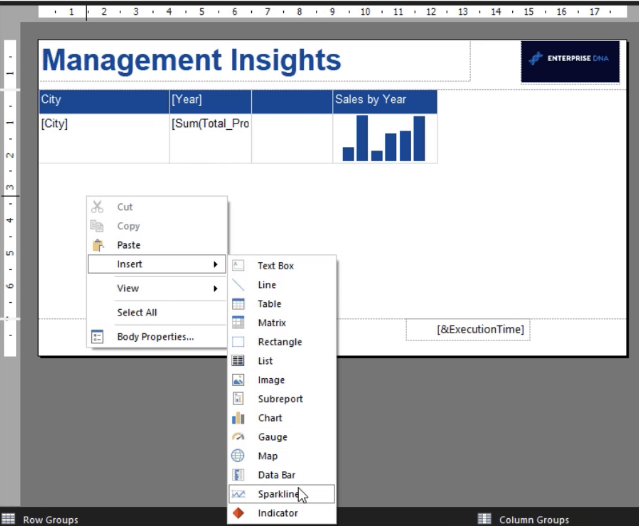
To add sparklines in your report, right-click on your canvas and select Insert Sparklines.
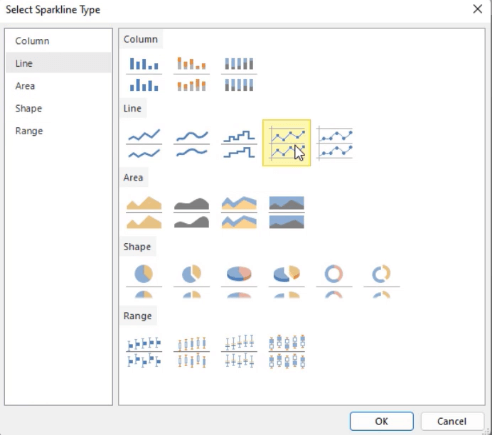
You can choose between five types of sparklines: Column, Line, Area, Shape, and Range. For this example, a smooth line sparkline is used.
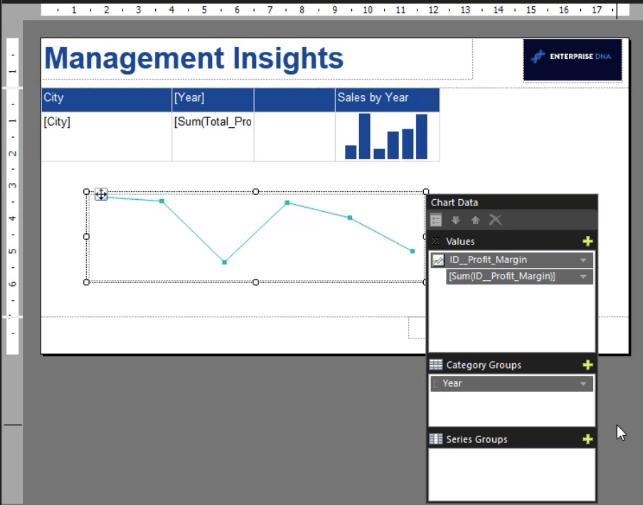
It’s recommended to format the sparkline visualization first before placing it in the matrix. Click on it to open the Chart Data window. Then, choose the Values, Category Groups, and Series Groups you want in the visualization.
The next step is to format the sparkline visualization. Click on it and then customize the options found in the Properties pane to your requirements.
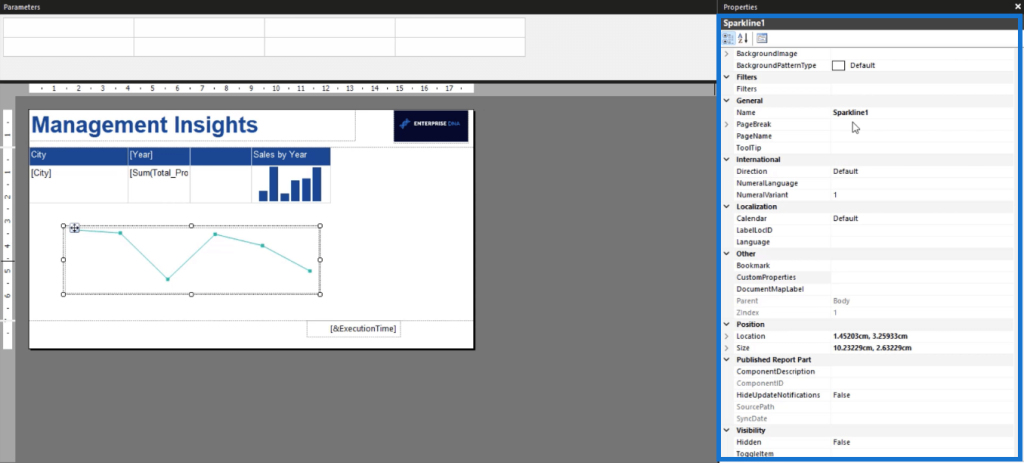
You can change its name and physical formatting. It’s a best practice to give appropriate and unique names to each object in your paginated report. This makes it easier to locate them if ever you need to make changes in the future.
Also, Report Builder doesn’t accept spaces in object names. You can either use an underscore or simply omit the spaces between words.
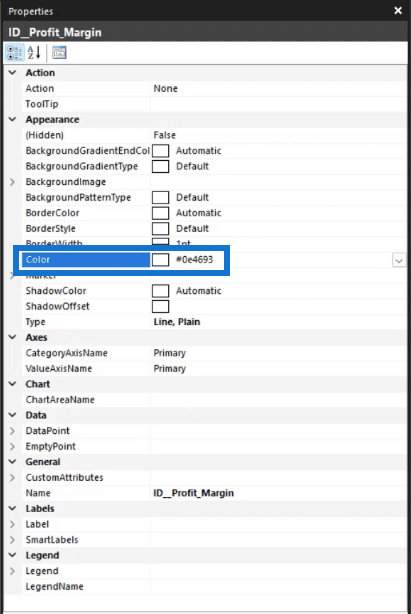
You can set a specific hex code as the main color in your report. You can paste this hex code as a background color or as the line color in your sparkline visualization.
Resize A Sparkline Chart
Resize the sparkline visualization so that it fits in the new column you created earlier.
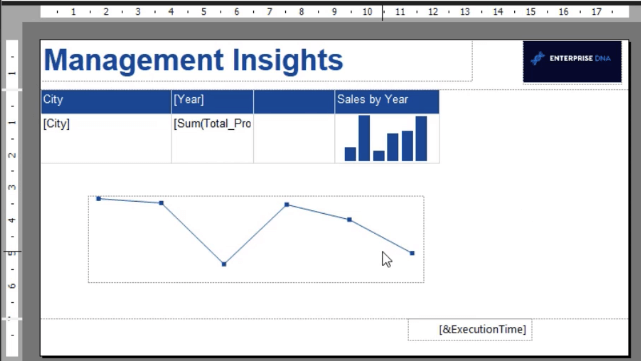
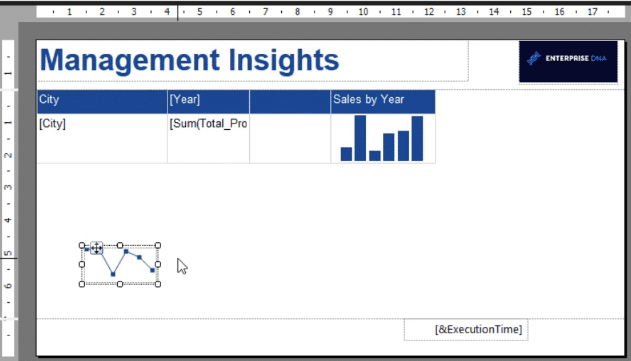
Then, select the visualization and press CTRL + X. Click on the blank column and paste it using the CTRL + V command. And lastly, give this new column a name. In this case, it’s Profit Margin by Year.
When you run the report, you’ll see how a sparkline visualization adds a lot of depth to it.
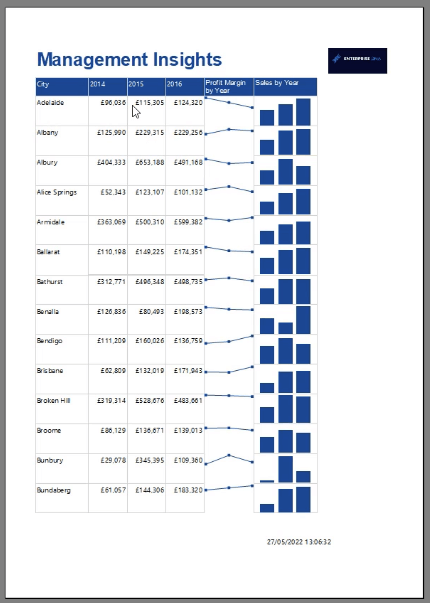
Continue to make formatting changes if you find areas in your report that need improvement.
***** Related Links *****
Different Bar Charts In Power BI To Elevate Your Reports
Conditionally Format Charts Using Charticulator
Paginated Report In Power BI: An Introduction
Conclusion
Adding a sparkline chart in your paginated report gives it more depth and provides a good visual insight for your row data.
This tutorial demonstrated how to embed a visualization for each row in your table or matrix. It’s different compared to creating a separate line chart at the end of your report.
Using a sparkline chart allows you to easily view the trend of each data in your report and compare it between other rows of data.
Sue Bayes


