In today’s blog, we will be continuing our series about the Enterprise DNA Power Tool Suite. In the first parts of the series, we covered the DAX Editor Pro and Power Sort Pro, and today, we will deep dive into Quick Measures Pro, an indispensable tool when doing quick measure in Power BI. You can watch the full video of this tutorial at the bottom of this blog.
What is Quick Measures Pro?
Quick Measures Pro is one of the five Power Tools developed by Microsoft MVP, Greg Deckler, exclusively for Enterprise DNA members. These tools are intended to speed up and automate different aspects of Power BI report development.
In my opinion, Quick Measures Pro is the most complex of the five, but it also is well worth the time to learn.
As we dive into the topic, you may not experience a steep learning curve. Nonetheless, this blog will provide you with incredible power for automating your DAX measures, particularly in conjunction with the Analyst Hub that you also have access to as an Enterprise DNA member.
So, let’s dive in and see what Greg has done on Quick Measures Pro and how to turn that all to your advantage.
Star Schema Model
Let’s start by opening our Power BI. We will use the standard Enterprise DNA practice model – a star schema model based on four years of sales data.
It uses the Enterprise DNA extended date table, a series of common dimension tables, and a measures table containing total sales and average sales.
They are pretty simple but will be quite illustrative when we tie them in with Quick Measures Pro.
Implicit Measure Vs. Quick Measure in Power BI
When talking about measures in Power BI, it is important to differentiate implicit from quick measures.
You might have heard people suggesting not to use quick measures before. However, these people are actually talking about implicit measures and not quick measures.
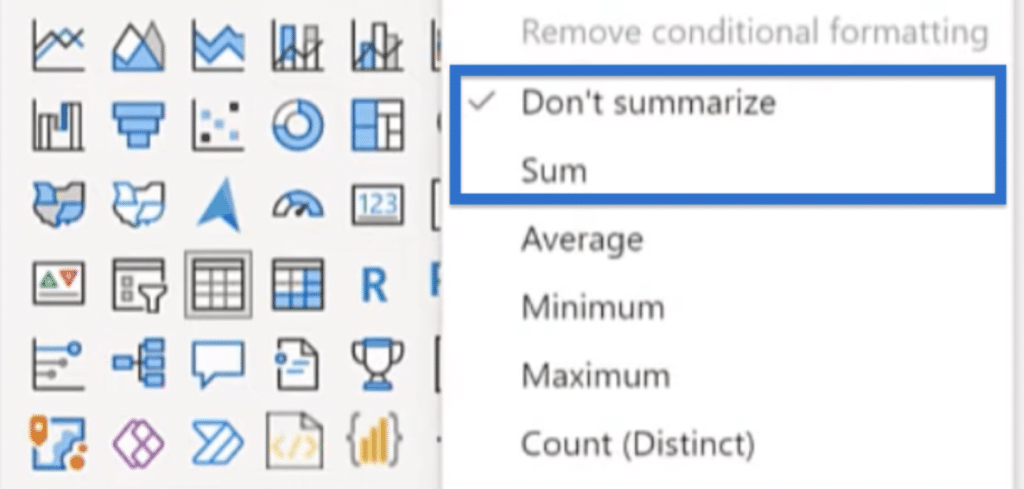
To explain further, let’s go to Home and click the first icon on the left as shown in the image below.
On the right pane, open Fields and click Sales to open the options. Then, check or drag Line Total to bring it under Columns.
Click Line Total and move the check mark from Don’t summarize to Sum.

You can see that the Sum of Line Total is the same as our Total Sales measure. And that’s an implicit measure.
However, we don’t want to use implicit measure (or what some people call quick measure) primarily because we cannot do measure branching from it. There are many other reasons but we won’t get into them in this blog.
Of course, the quick measure also has its own pros and cons, but for the purpose of this blog, we’ll stick to them and talk about the quick measures that are explicit DAX measures and can be classified as DAX patterns.
Navigating Quick Measure in Power BI Using Quick Measures Pro
Microsoft has built a few dozen quick measures that you can select in Power BI. However, they are pretty limited. I personally do not use them that much because they are kind of buried in the menu and it’s often easier to do it in another way.
For example, Greg Deckler put together a comprehensive list of over 200 quick measures and made them accessible and easy to view.
To see for yourself, let’s go to External Tools and click QM Pro.
The resulting window shows us this huge list of quick measures that Greg has put together. These measures are all completely accessible to you with this tool.
If you haven’t installed the Power Tool Suite yet, read our blog on DAX Editor Pro. It teaches you how to download and install this suite if you’re an Enterprise DNA subscriber.
Quick Measures Pro Sample Applications
Let’s take a simple example of taking our customers and segmenting them. Say we want to do either a bootstrapping analysis or a survey of a subset of our customers. We also want an easy way of subsetting these customers based on a fairly random approach.
Sample Application 1: Customer Sampling Using Is Prime
Our first sample application is sampling the customer index. A random way to do it is by highlighting those customer indexes that are prime numbers.
Conveniently enough, there is a quick measure that shows us exactly how to figure out if a number is prime. We simply go through the list of quick measures and click Is Prime. A quick measures column will show up.
From there, we can choose the column that we want to apply. What’s great about this is that we can apply the Is Prime to any column within our model.
We’ll just click Set in the Choose Column and click the appropriate column. For our example, let’s apply it to our Customer Index found under Customer.
What we can do next is take a look at the DAX. In the resulting window, we can see that this is not a simple calculation. So we have to generate a series, calculate that series, and then using the mod command, figure out if the number is divisible only by itself and one. If that’s the case, then it’s prime. If that’s not the case, it’s not prime.

It is a fairly complex DAX to write, but in this case, we don’t have to write it ourselves because Greg has already done that for us.
What we have to do next is put this in our measures table by choosing Measures in the Table dropdown. We also have a description saying Determine if a number is a prime number.
The other options allow us to Format the string, put it into Folders, and Hide or set the Data Category if this were a particular type of measure. Basically, we can control all the metadata, but in our case, we will keep them as a standard measure.
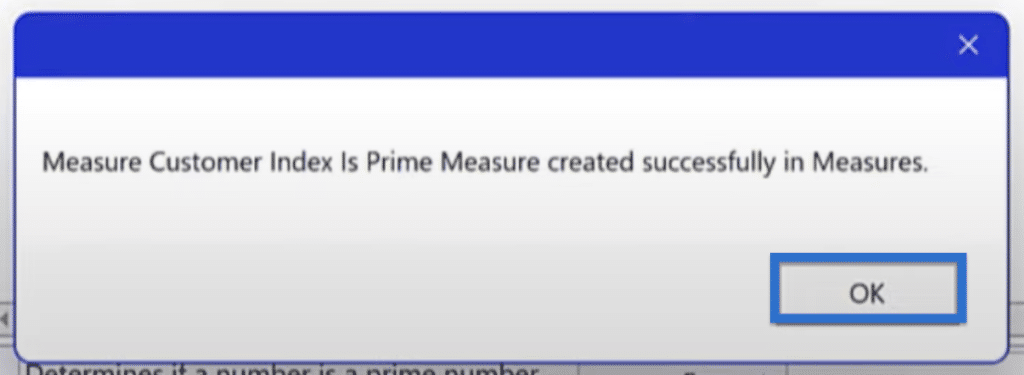
Let’s click Create. A window will pop up saying our Measure Customer Index Is Prime Measure created successfully in Measures. Click OK and go back to Power BI.


We can see in Power BI that the Customer Index Is Prime has been added under Measures in the Fields pane.
We can click on Customer Index and rename it in Line 1 with a shorter name such as Is Prime. Click the check mark to save and x mark to close.
One of the interesting things we can do is create this as a measure or as a calculated column. If we go back to Quick Measures Pro, we can see the options Measures or Column.
We used Measures earlier, but if we want to do a calculated column, we can simply click Column to update the DAX and then click Create.
In our case, let’s keep it as a measure.
Sample Application 2: Creating Visual Indicator Using SVG
What we can do next is create a visual indicator for the indexes that are prime. We will use the SVG measures found in the list of measures that Greg programmed. Again, these are fairly complex stacks that use HTML code to create these visual effects.
Let’s say we choose SVG Blinking Dot. We will keep this a Measure. In the Flag Column, we want to use a measure that we know will always be a number that we can turn on and off. So, in the dropdown choices, we can choose Year.
We can choose our preferred colors for the fill and line. For our Fill Color, let’s put Green. For the Line Color, let’s write White. We will use 1 for the Line Thickness, 10 for the Radius, and 1 for Opacity.
We will choose Measures in the Table field and keep the Description as is.
In the Data Category, we can see that it’s smart enough to know that the data category is Image URL which is important. That is because if we don’t click Image URL or it doesn’t click ImageURL automatically, we would only get the text in return.
We will then click Create and OK.
Let’s go back to Power BI and see how it works.
In Power BI, let’s create a very simple measure that we will call Prime Dot. We can do this by going to the Fields pane, clicking Measures, then New Measures.
Copy the code shown below in the appropriate area.
Then, we will drag the Prime Dot measure from Measures to Table. We will change the Date Category to Image URL.
We then get our flashing dots for all the ones that we want to select in our subset based on the customer index being prime.
Quick Measures Pro: A Go-To Tool for Quick Measure in Power BI
In our example, we can see the power of Quick Measures Pro when doing a quick measure in Power BI. What we did is simple and trivial, but we managed to create a relatively complex DAX measure and a blinking visual measure in just a few clicks.
And that’s powerful, especially when we consider the enormous array of quick measures that are listed in Quick Measures Pro. We have all sorts of time intelligence and date measures.
Under Excel, Greg has replicated many of the Excel functions that you might need. I particularly like Large which ranks and determines the ranked item in a column or in a set.
There are also all sorts of filtering measures, financial measures, lookup measures, math, and statistics. There are other complex measures such as the SVG measures, text manipulation, time and duration, time intelligence, and unit conversions—a whole range of over 200 measures.
These are all easily accessible by simply pulling them up, filling in the right columns, and clicking Create.
***** Related Links *****
Pros & Cons of Quick Measures In Power BI
Quick Measures Power BI: Year-To-Date Total Calculation
Quick Measures – How To Use Them In Power BI Models
Conclusion
For this tutorial, we did an out-of-the-box yet extremely helpful application of Quick Measures Pro. We learned about the 200 common measures included in this tool—all accessible with just a couple of clicks.
In a nutshell, Quick Measures Pro allows us to create our own custom quick measures based on our most frequently used DAX.
We will learn exactly how to leverage these two tools so we will only have to write our commonly used DAX measures once and reuse them over and over in our reports with just a couple of clicks. And when we tie this in with the Analyst Hub, it gets even more powerful.
All the best,
Brian Julius
[youtube https://www.youtube.com/watch?v=Buf9VibAMXY&t=3s&w=784&h=441]


