
In this tutorial, you’ll learn how to optimize a measure in Power BI. Optimizing measures in your report improves the performance of your codes in producing valuable insights and data. You’ll also learn about the different evaluation methods and how to apply them to optimize your report. You can watch the full video of this tutorial at the bottom of this blog.
1. Analyze The Performance Of The Code
In this example, you need to optimize this report:

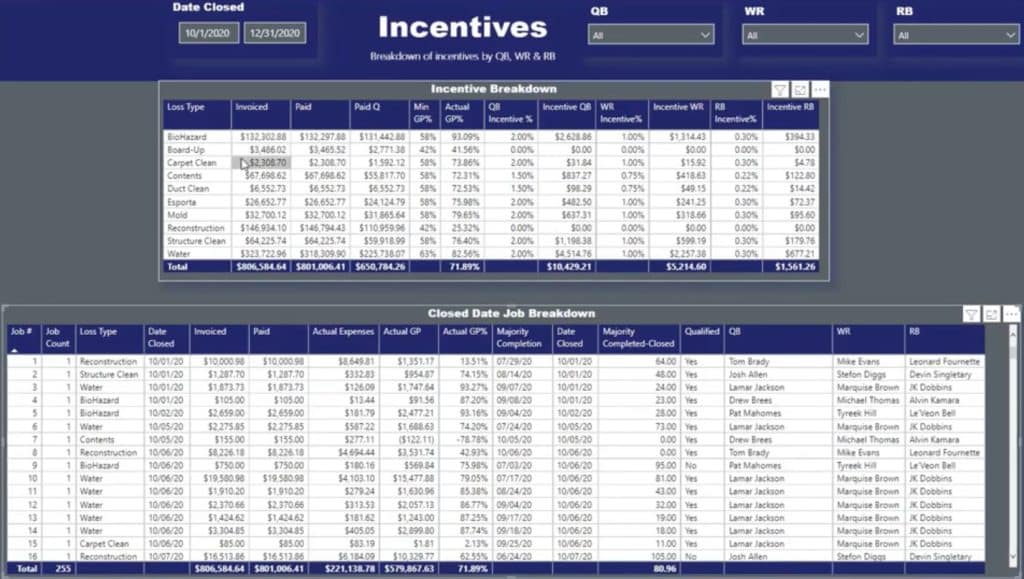
This is the data model that you’re going to use:
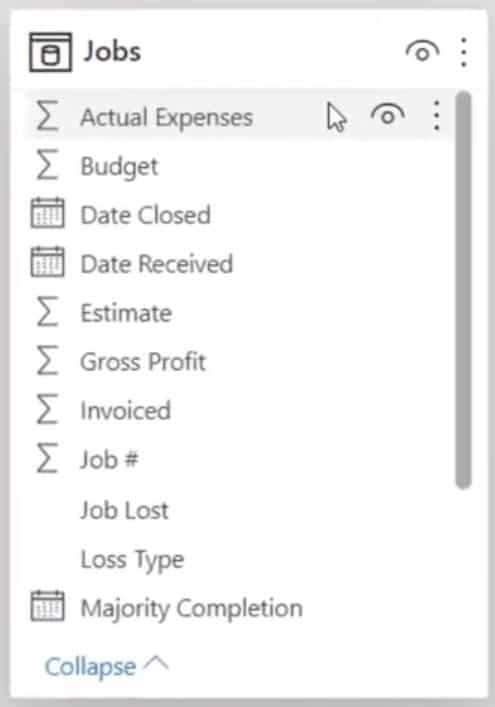
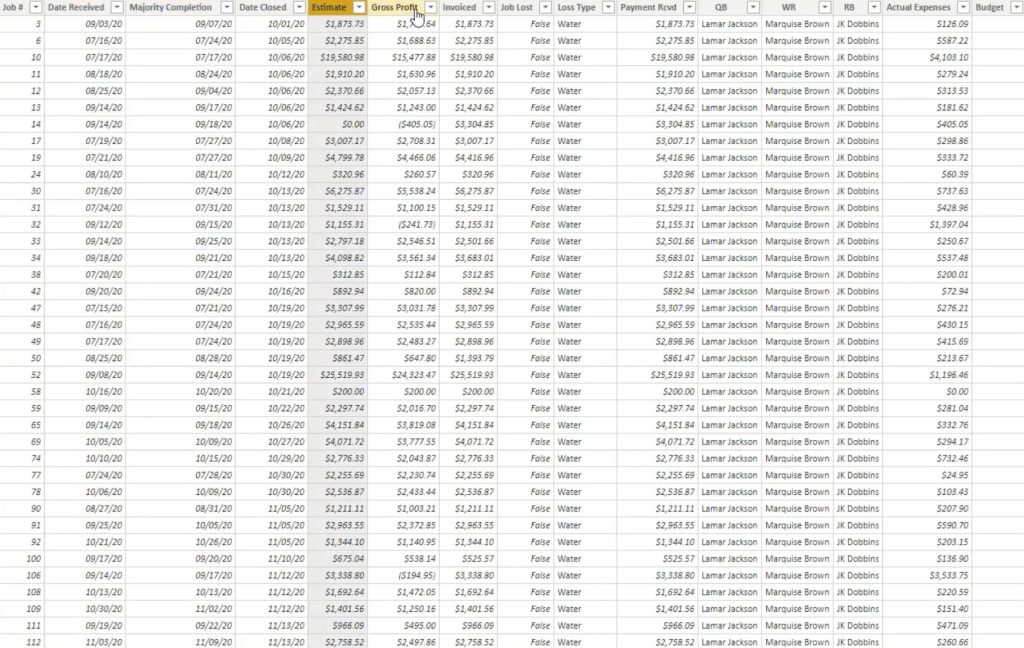
The Jobs table contains all the information regarding any job that has been performed in a given time period.
This table is the base of all measures that you’re going to optimize:
First, you need to test the performance of the report.
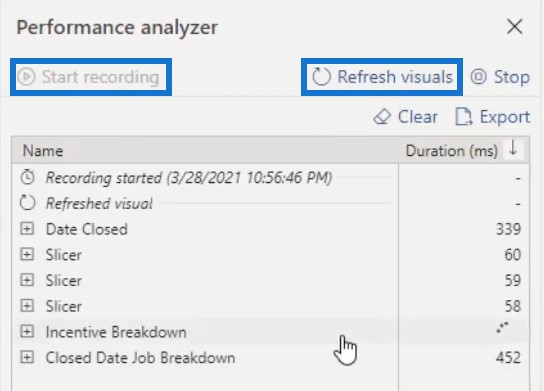
Go to the View tab and choose Performance Analyzer. Then, click Start Recording and Refresh Visuals. Wait for the analyzer to render the visual.
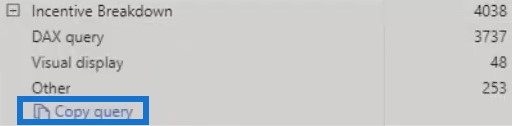
Once this is done, drop down the Incentive Breakdown list and click Copy Query.
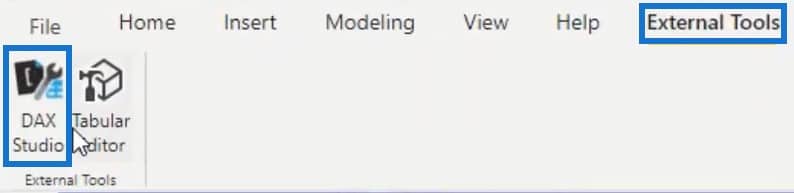
Next, select External Tools to go to the DAX Studio and look at the code that Power BI generated.

Then, paste the copied query inside the workspace.
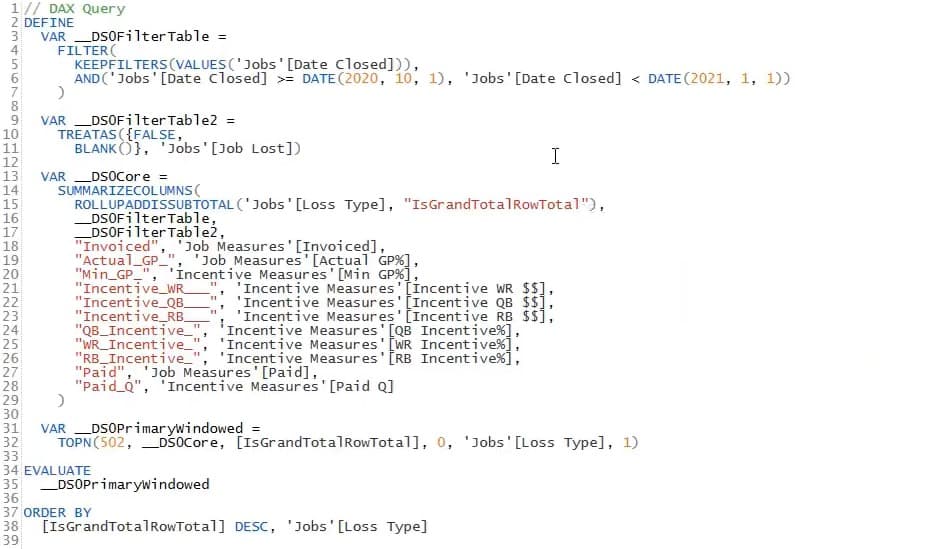
Variables In The Measure
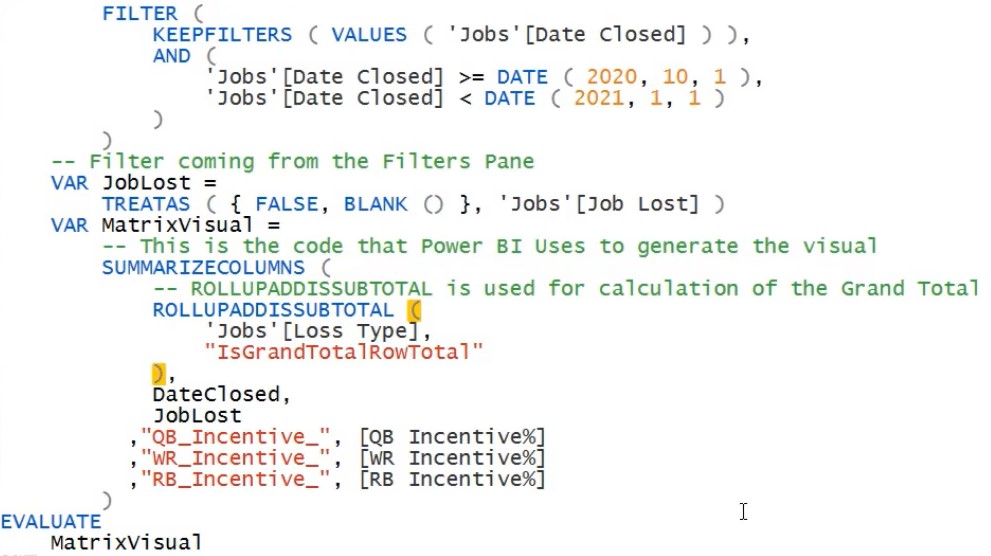
The first variable is DateClosed which is the slicer on the dashboard. It uses a column from the Fact table to get the values of certain periods in the slicer.
The next variable is JobLost which checks for False or Blank of the Job Lost data.
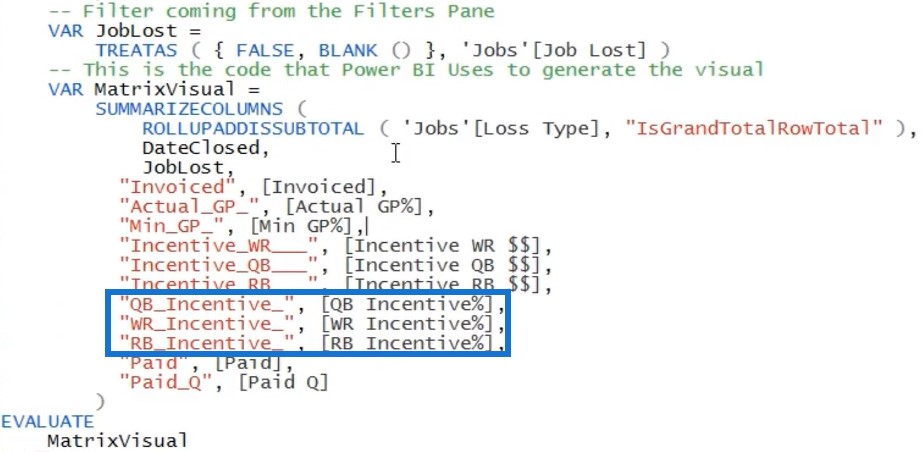
The last variable is MatrixVisual. This is the heart of the code. It shows the summarized column generated by Power BI to populate matrix visuals. It groups the Job Loss Type in this matrix and injects the filters coming from the slicers. Then, it adds extended columns.
Once the summarize column completes the execution, you will see the results in the pane below the code.
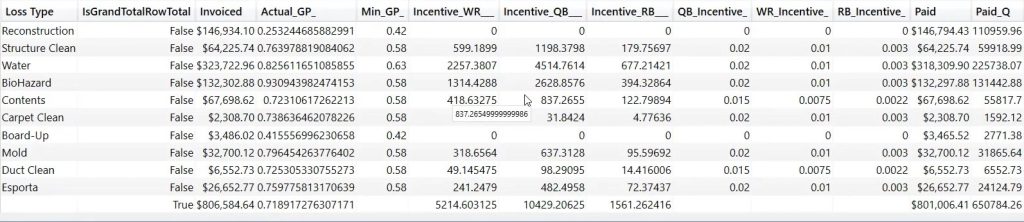
Power BI uses the result to populate matrix visuals.
Cold Cache For DAX Studio
Next, you need to check the time taken in executing the whole code. To do that, turn on the Server Timings and then choose Clear Cache Then Run.

When you’re trying to optimize a measure in Power BI using DAX Studio, it’s better to operate under the cold cache scenario so that the time you’ll get is correct. After that, press F5 and wait for the operation to complete in the Server Timings tab.
Once it’s complete, you can see that the total execution time is 3.6 seconds. It spent most of the time in the formula engine and spent 57 milliseconds in the storage engine
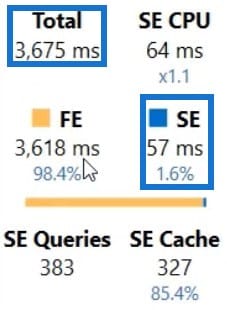
You can also see that it found 383 storage engine queries. Out of all those queries, there are 327 that are cast in the memory so that they can be reused.
2. Analyze A Measure In Power BI
Next, you need to optimize these 3 identical measures.
You have to extract these measures into a different file and connect it to the data model you’re using.
After that, start the Server Timings to see the time taken by the 3 measures in populating visuals.
The results of the run show that the measures are consuming 1.85 seconds to retrieve a result.
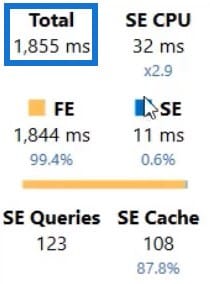
The result shows a table comprising of 10 rows and 3 extended columns which belong in the summarized columns.

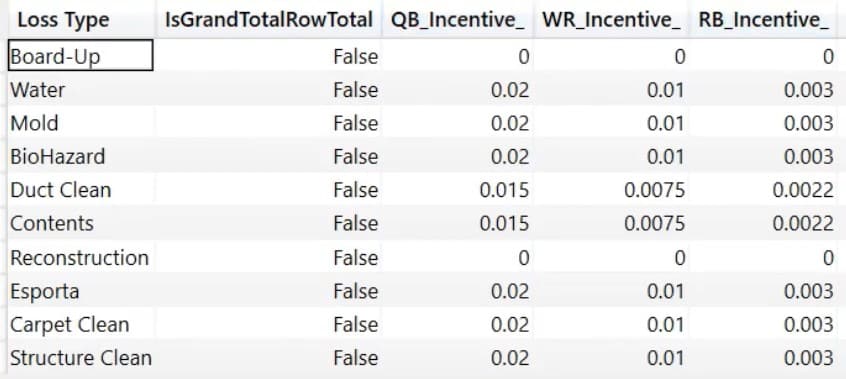
The Loss Type column contains 10 unique values which the code calculates to get the incentive percentages.
The time taken by the code is exponentially high. This is where and when you need to optimize them.
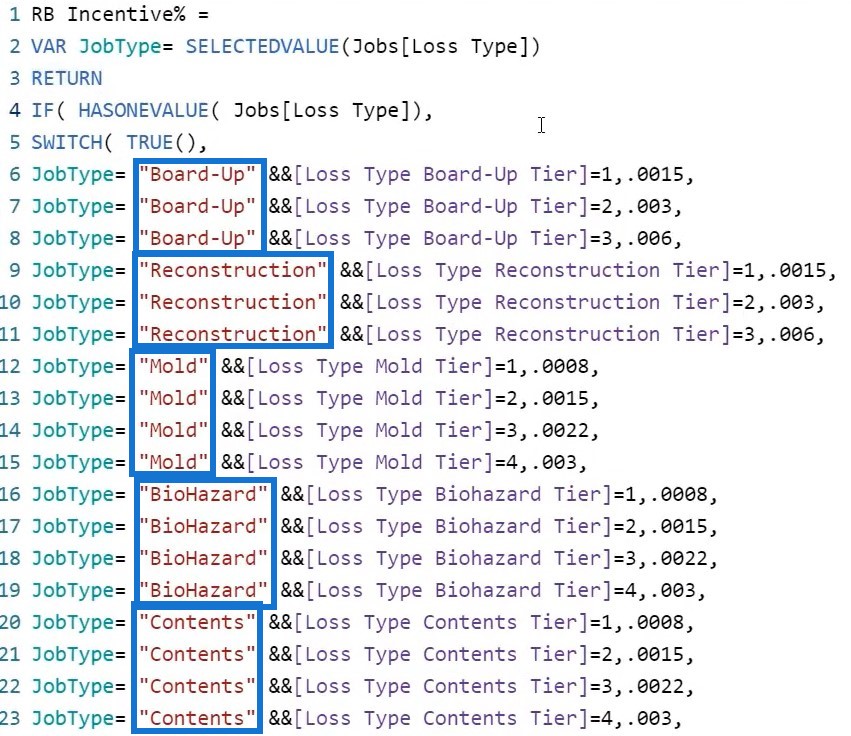
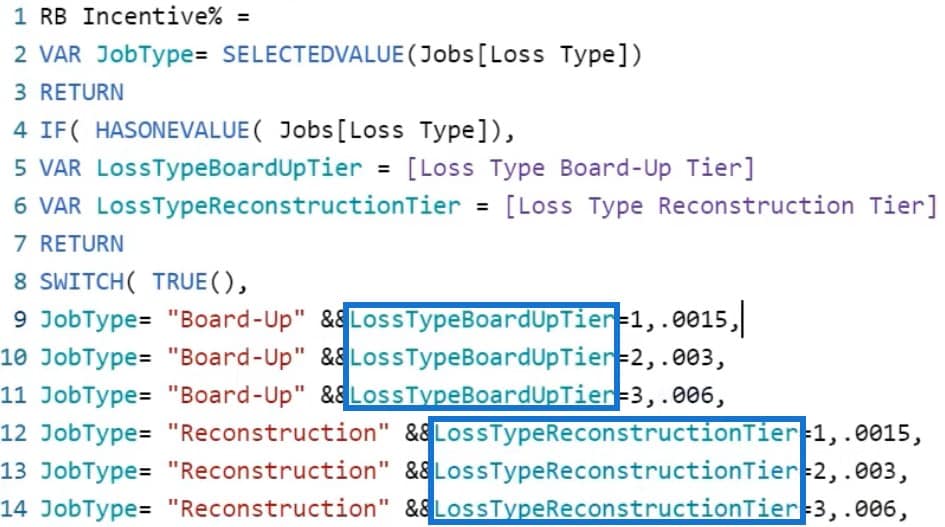
The RB Incentive% Measure In Power BI
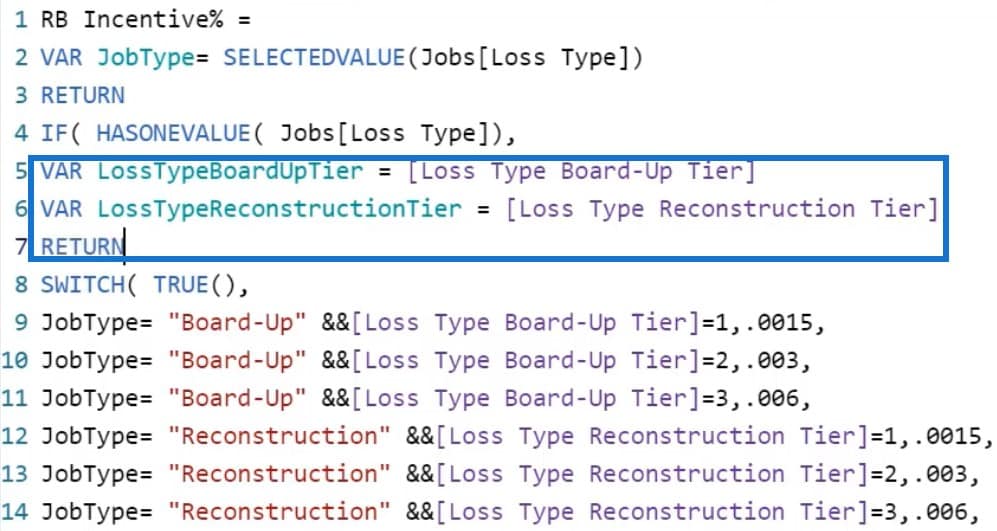
This is an RB Incentive% measure in Power BI. It’s one of the 3 main measures used in this example.
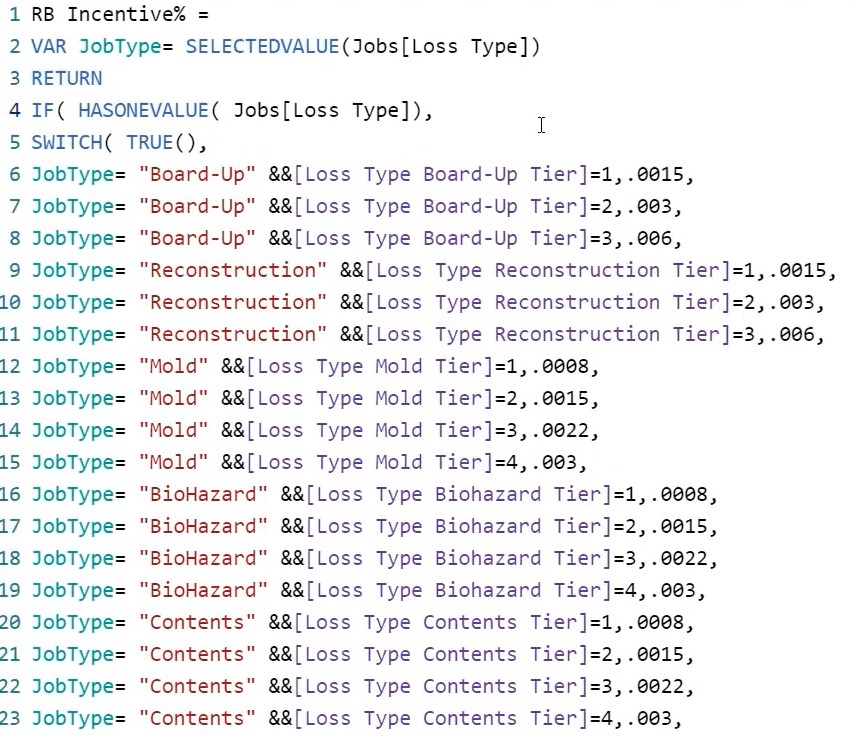
You can see that it’s trying to calculate the incentive percentage.
It has a variable, JobType, which retrieves Lost Type value in the current filter context. It also checks if there’s only a single value visible in the current filter context. You need to use a SWITCH TRUE function so that every time a condition is met, it gives the corresponding result.
This measure code generates a lot of storage engine grease which increases the time in the overall duration of the code.
Now, go back to DAX Studio to check the amount of storage engine queries the measure generates.
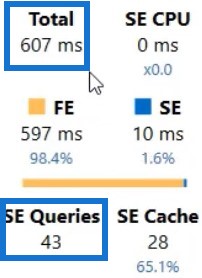
You can see that it took 600 milliseconds to execute and 43 storage engine queries to simply retrieve data for the 10 rows.
Data From The Storage Engine
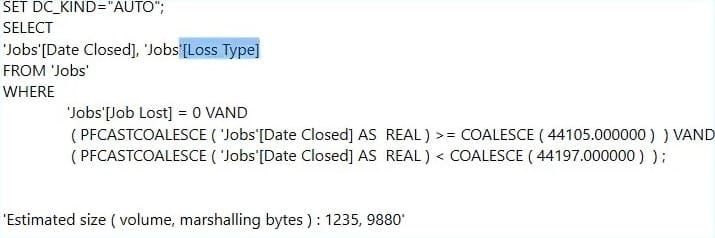
Now, check the data that’s being requested from the storage engine. In the first query, there’s a Jobs Loss Type and DCOUNT of the Jobs Loss Type.
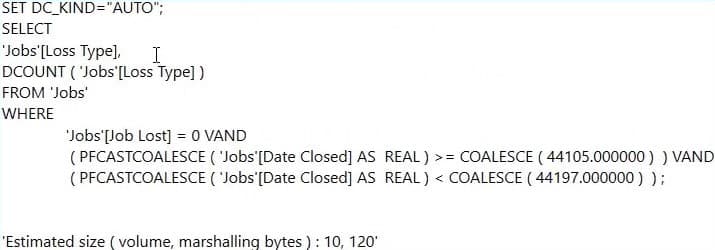
The next query has Jobs Date Closed which is from the slicer in the report.
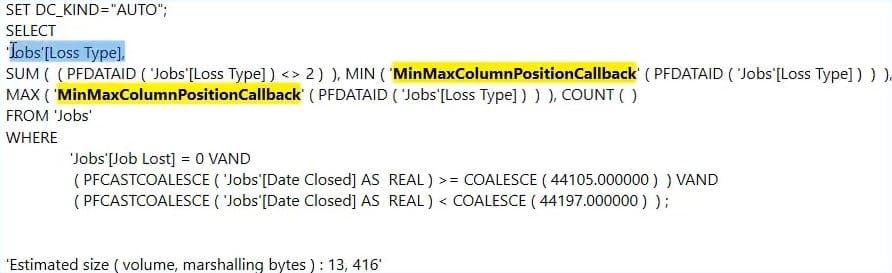
In the third code, you’ll see another Jobs Loss Type with the callback data ID.
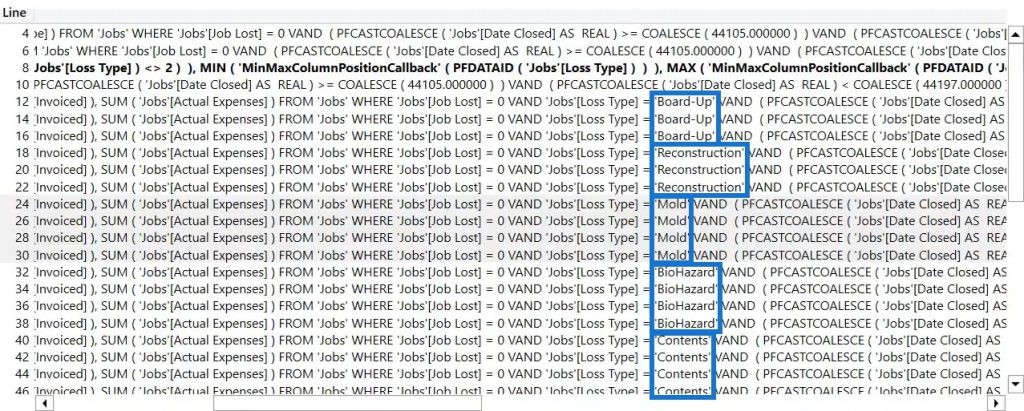
In another line, you’ll see the most important lines of code.
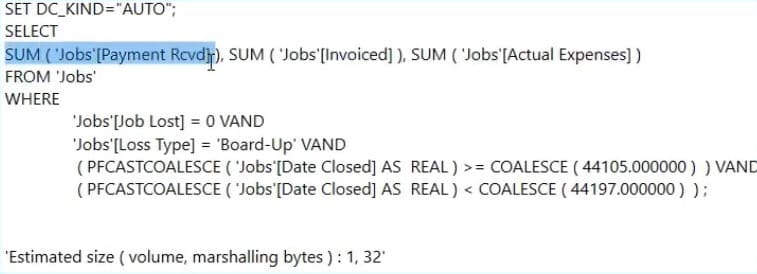
The first thing you see is the SUM of the Jobs Payment Received, Invoiced, and Actual Expenses.
Next is the WHERE function that states a condition and its corresponding result. The result will vary based on the slicer selection and the switch statement in the RB Incentive% measure.
You’ll also notice that the code on Lines 12 and 14 are the same.
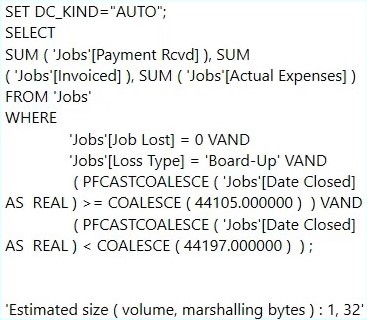
If you scroll to the right, you can see that there are lines with the same queries. The queries on the lines are directed by the switch statement in the RB Incentive% measure.
If you go back to the RB Incentive% measure in Power BI, you can see the number of times a query is repeated and how it’s reflected in the storage engine queries.
The Logic Behind IF And Switch
Now, to understand why the queries are executed multiple times, you need to understand the logic of the IF and SWITCH functions.
You need to execute them separately on a Query Plan. But before you do that, make sure to connect to the database and turn the Query Plan on.
Execute the SWITCH statement in the query plan. Then, highlight the statement and then press enter.

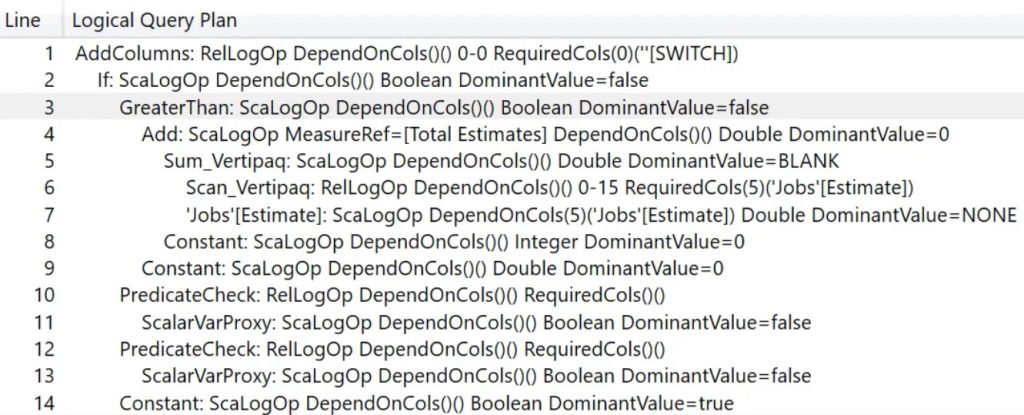
This will generate a Logical Query Plan with different operations.
Next, execute the IF statement by highlighting the statement and pressing enter.
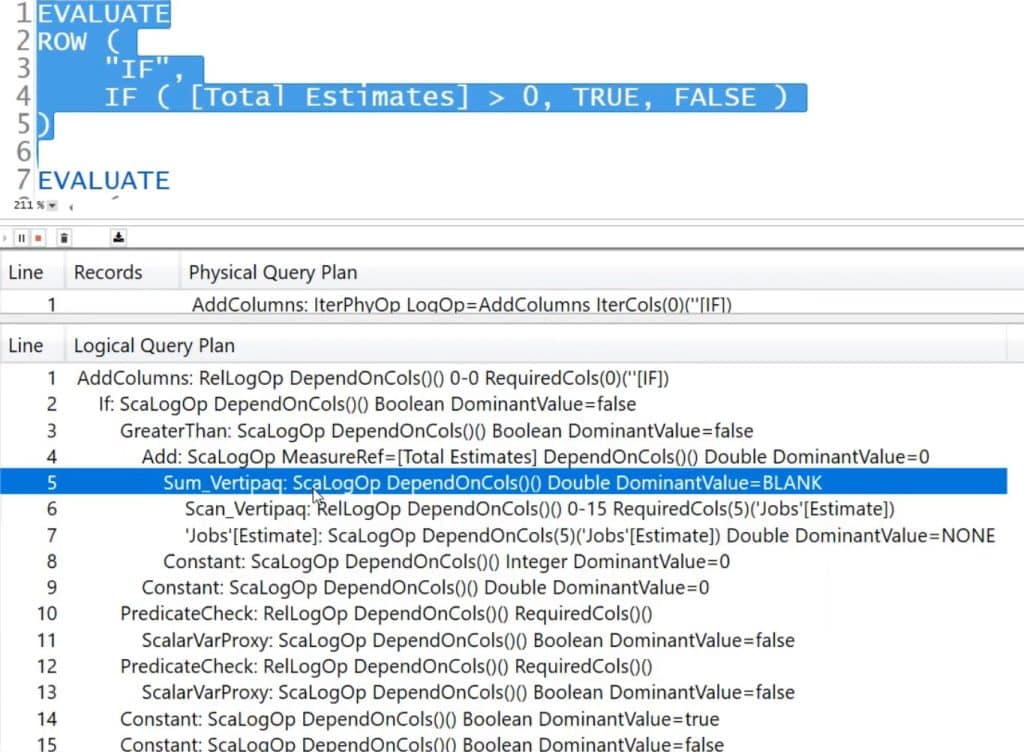
You can see that it generates the same Logical Query Plan.
This is because whenever you use a SWITCH function, the engine internally converts that function into an IF statement. But a SWITCH statement is recommended because it increases the readability of your code.
After that, you need to understand how a code is executed inside the IF or SWITCH function.
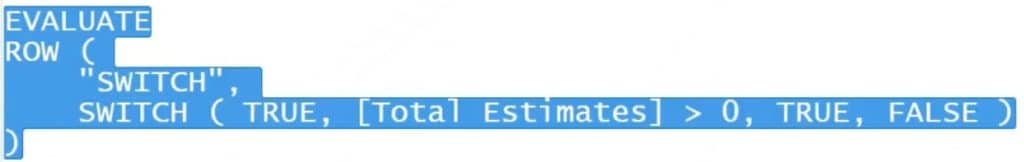
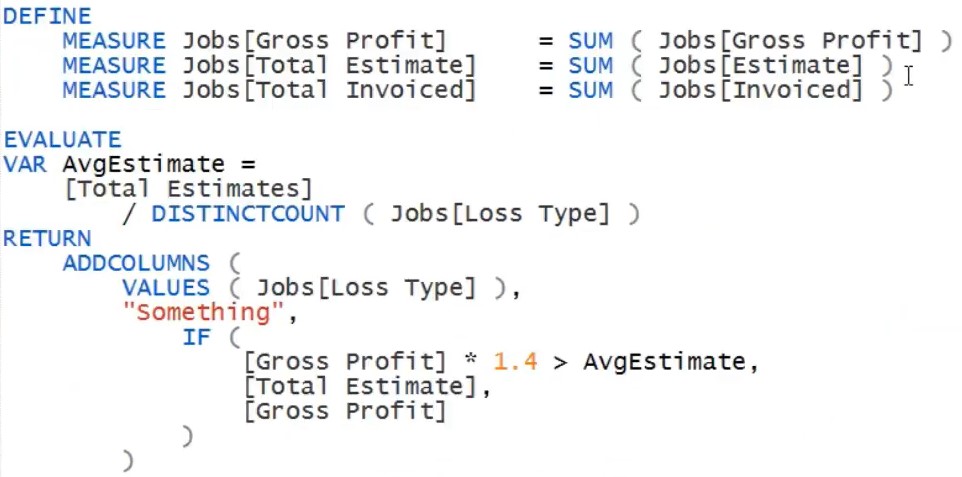
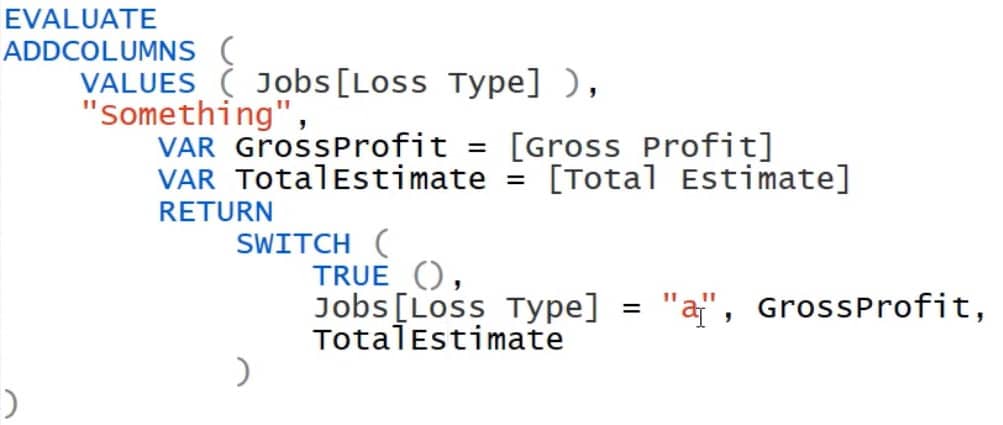
This is an example code that has a SWITCH statement inside.
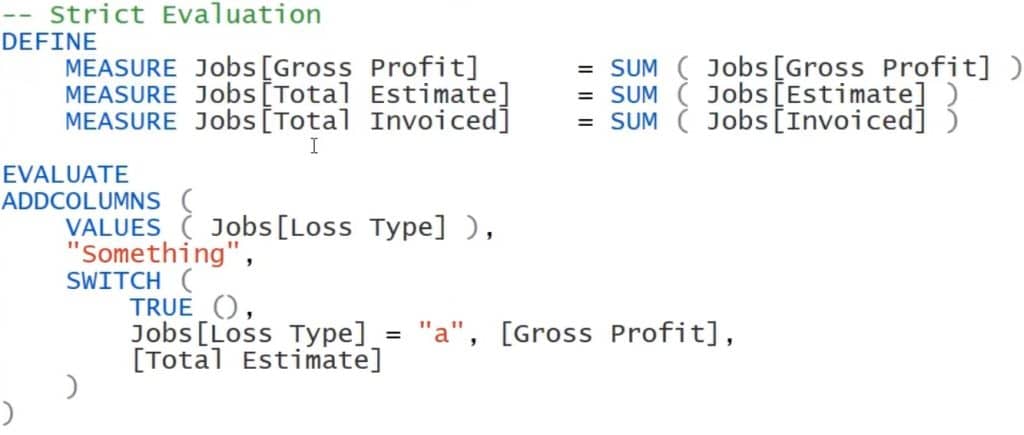
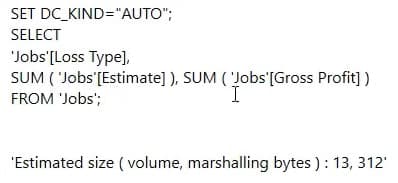
It has measures for Gross Profit, Total Estimate, and Total Invoiced which are all the SUM of different columns. It also has an ADDCOLUMNS function over the VALUES of Jobs Loss Type and a SWITCH and TRUE statement.
When you execute this code, you’ll see the logic behind the functions.
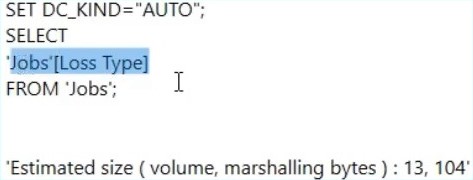
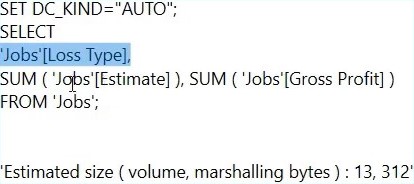
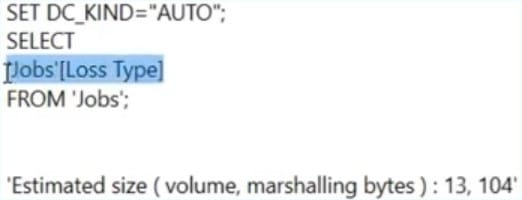
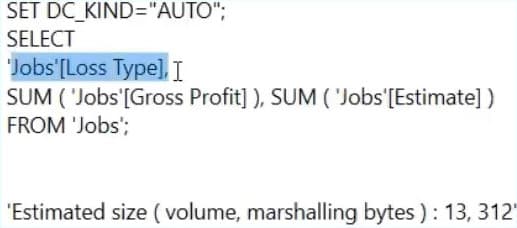
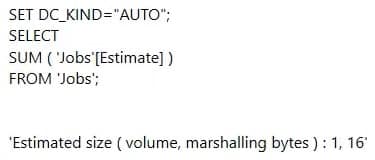
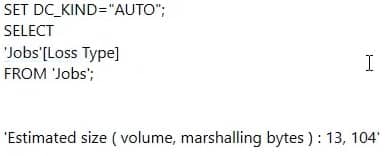
The first query gets the distinct Jobs Loss Type from the Jobs table.
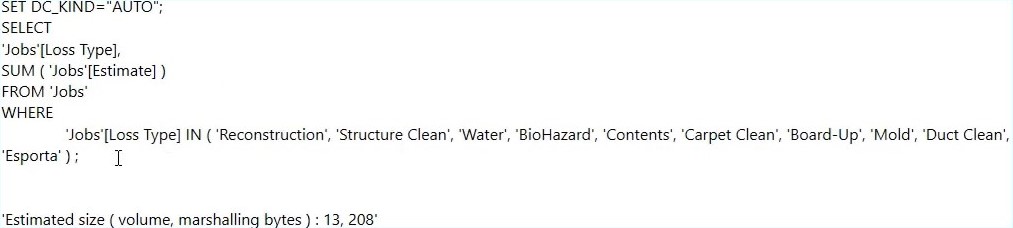
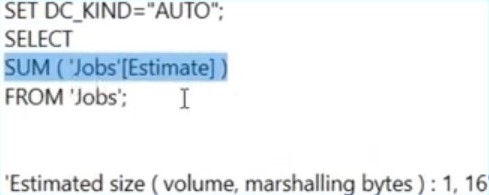
Aside from the Jobs Loss Type, it also gets the sum of the Jobs Estimate.
Inside the WHERE condition, you can also see the values that exist in the Jobs Loss Type column.
3. Use Code Evaluation Methods
In DAX, there are 3 methods in evaluating codes:
- Strict Evaluation
- Eager Evaluation
- IF.Eager Evaluation
These methods will help you optimize a code or measure in Power BI.
1st Method: Strict Evaluation
The example shown below uses the Strict Evaluation method.
The logic behind it is that if the context of the Jobs Loss Type is equal to A, it will provide the Gross Profit. Otherwise, it gives the Total Estimate. The code does this for each row in the Jobs Loss Type.
This is another example measure in Power BI that uses Strict Evaluation.
When you execute this code, it will generate 5 storage engine queries.
With Strict Evaluation, the code provides the Total Estimate if the Gross Profit multiplied by 1.4 is greater than the Average Estimate. Otherwise, it will give the Gross Profit.
Using Strict Evaluation produces more storage engine queries because the IF statement checks the competition of the Gross Profit multiple times and will eventually hamper the performance of the whole operation.
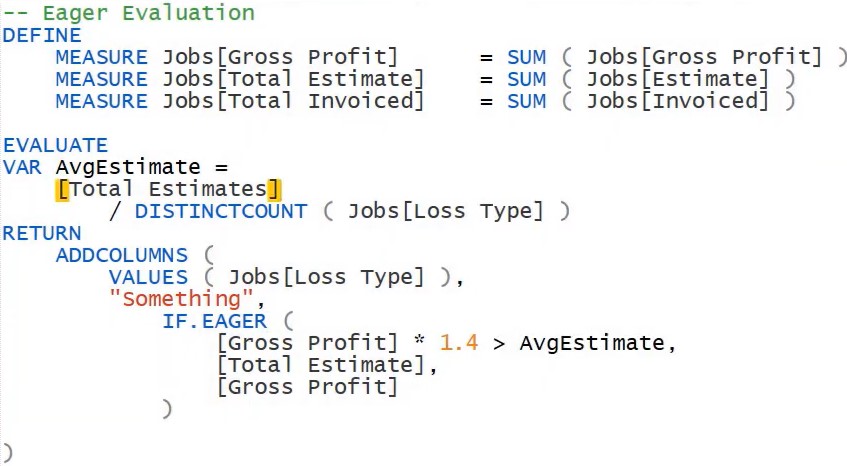
2nd Method: Eager Evaluation
This is the same code as the previous example.
But instead of calculating the measures inside the IF statement, it calculated everything in the VAR before RETURN.
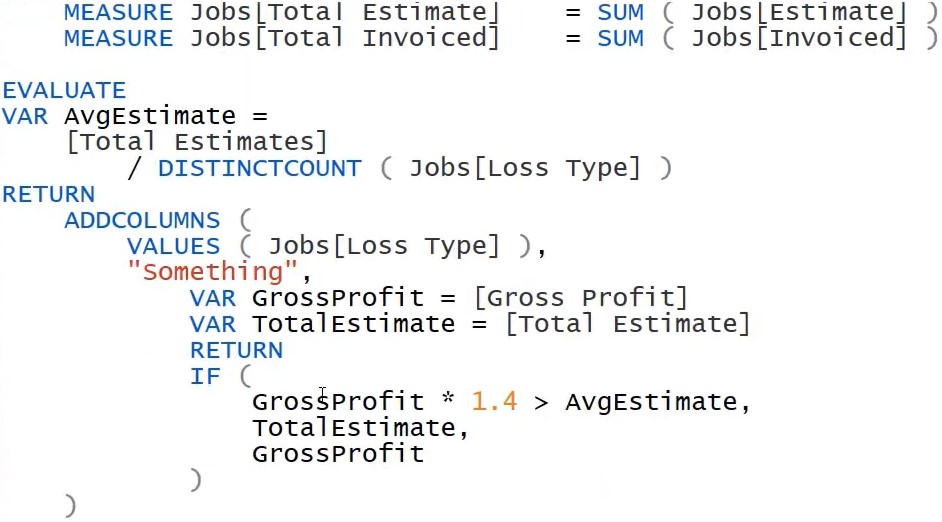
It means that before checking the statements, it gets all the values of the Gross Profit and Total Estimate for all Jobs Loss Type.
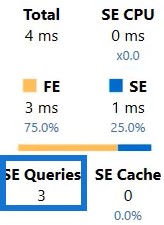
When you execute this code, the number of storage engines is reduced to 3.
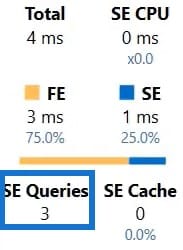
It improves the performance of the whole operation.
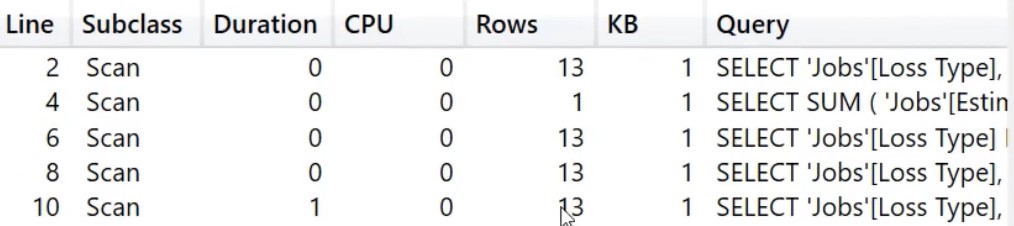
In the first operation query, it gets the Jobs Loss Type and the sum of Jobs Estimate and Gross Profit.
The next query gets the sum of the Jobs Estimate from the Jobs Stable. This is used in calculating the Average Estimate.
The last query gives the distinct Jobs Loss Type for the values written on the ADDCOLUMNS.
Using the Eager Evaluation gets everything in one single data cache. The data is also evaluated and iterated on the formula engine. The IF statement will return either the Total Estimate or Gross Profit depending on the True or False evaluation.
Eager Evaluation isn’t always the best method in optimizating your codes. Strict Evaluation will result in a better performance if you have complex codes. It all depends on the functions you use inside the DAX code.
The downside of Eager Evaluation is if you create valuables before an IF or SWITCH statement and use those variables inside the statement that should never be executed, the engine will still calculate those variables.
Eager Evaluation Disadvantages
Here is an example of the downside:
Ideally, if the Jobs Loss Type is equal to A it should get Gross Profit. Otherwise, it gets Total Estimate.
Since there’s no value inside the Job Loss Type column that is equal to A, it should always get Total Estimate. However, it still provides the Gross Profit in the data cache.
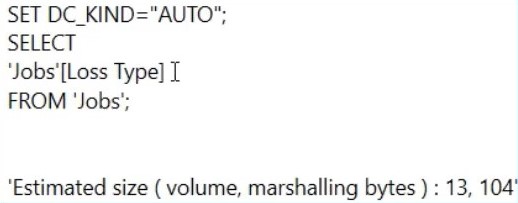
If you look at the first query, it gets the Jobs Loss Type and the sum of the Jobs Gross Profit and Estimate.
In the next query, it gets a distinct Jobs Loss Type from the Jobs table.
3rd Method: IF.EAGER Evaluation
The next method is the IF.EAGER function evaluation which replicates the behavior of the Eager Evaluation.
It lets you write a code that represents the Strict Evaluation and execute it with Eager Evaluation.
If you look at this sample code, it’s just the same as the Strict Evaluation code. The only difference is that this uses the IF.EAGER function instead of IF.
Before you execute the code, make sure to connect to the Power BI model and turn the Server Timing on. Once done, press F5.
You can see that it generated 3 storage engine queries.
The first query gets the Jobs Loss Type and the sum of the Jobs Estimate and Gross Profit.
The second query gets the sum of the Jobs Estimate.
The last query gets the distinct Jobs Loss Type from the Jobs table.
You’ll notice that it executed the same behavior as the Eager Evaluation.
Evaluation Methods Summary
In trying to make the performance of your calculations better, you have to remember the following:
- Strict Evaluation is used for complex codes. It also applies for when you don’t want to evaluate all the values supplied by the table.
- Eager Evaluation is better to use if your codes are simple.
- Use IF.EAGER if you want to write codes using the Strict Evaluation and execute it with Eager Evaluation.
But take note that you have to test these three methods to find out what’s truly best to use in your report.
4. Optimize A Measure In Power BI
The main lesson in this tutorial is optimizing your codes.
Go back and look at the RB Incentive% measure that is executed using Strict Evaluation. Next, try evaluating it using Eager Evaluation.
Start by creating variables and inputting the RETURN function.
Change the measure references with the variables.
After that, confirm the measure and go to the DAX Studio to see if it improved the performance.
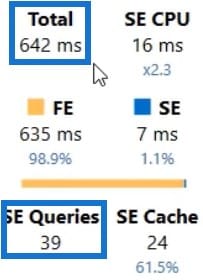
It shows that the total time is 642 milliseconds and the total number of storage engine queries has been reduced to 39.
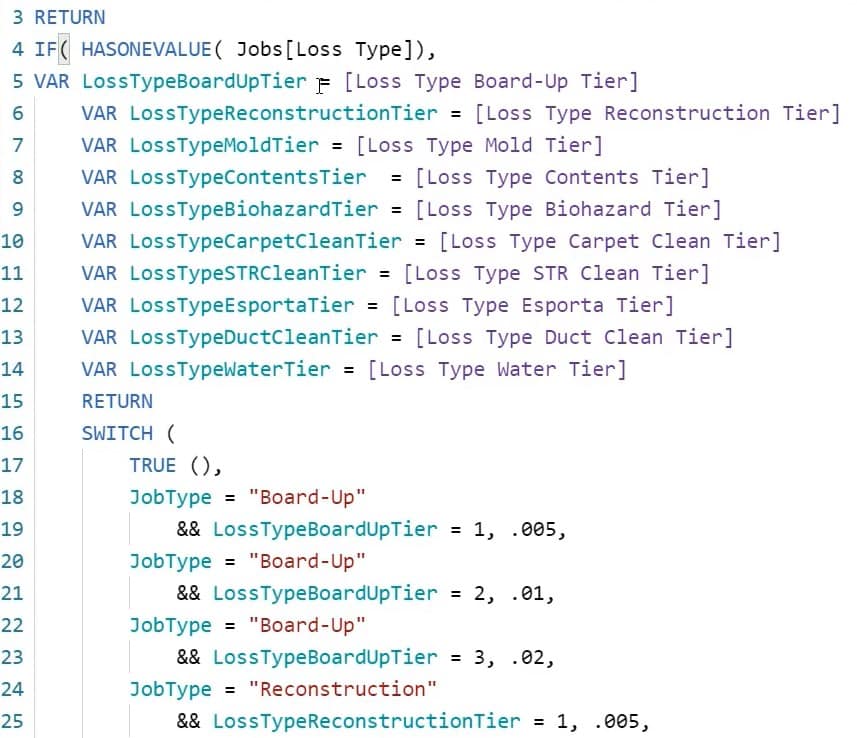
Now, create the variables for all data and change all measure references to their corresponding variables.
Next, confirm the measure and execute the code in the DAX studio.
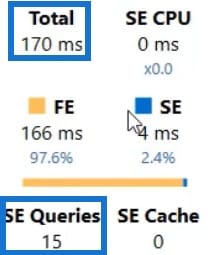
The total execution time and the total amount of storage engine queries have been reduced from 600 milliseconds to 170 milliseconds and 43 queries to 15 queries, respectively.
You can also see that there are no duplicates. Having variables in your code improves their readability and performance.
Advanced Optimization For A Measure In Power BI
Next, you need to further optimize your DAX codes.
Instead of using HASONEVALUE, use ISINSCOPE function.
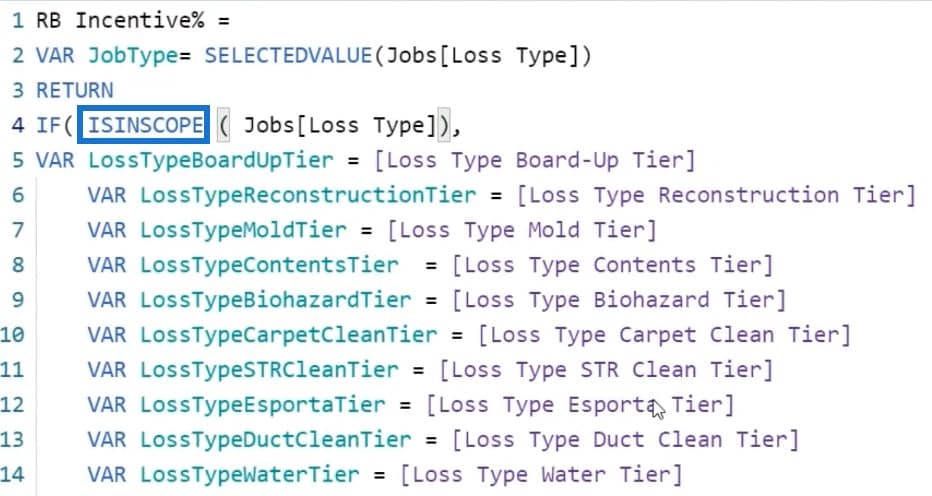
HASONEVALUE counts the number of values available in the filter context which is a very intensive operation. Meanwhile, ISINSCOPE checks if the column that’s being supplied is used for grouping or not.
After changing the functions, confirm the measure and execute it in the DAX Studio.
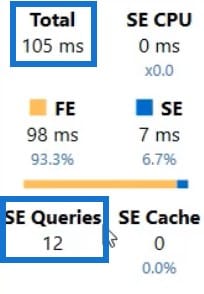
You can see that the number of storage engine queries is now 12. The total execution time has also become 105 milliseconds.
In the 2nd query, you’ll notice a Callback data ID.
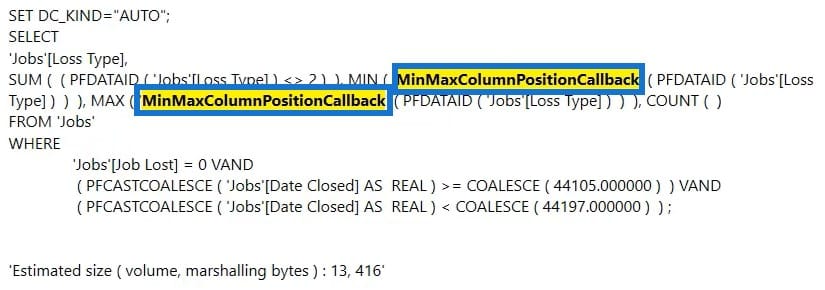
This sometimes happens when you use SELECTEDVALUE with the text field. When you see Callback data, the storage engine calls the formula engine to help solve the complexity of the code. This slows down the performance of your measure.
Remove Callback Data
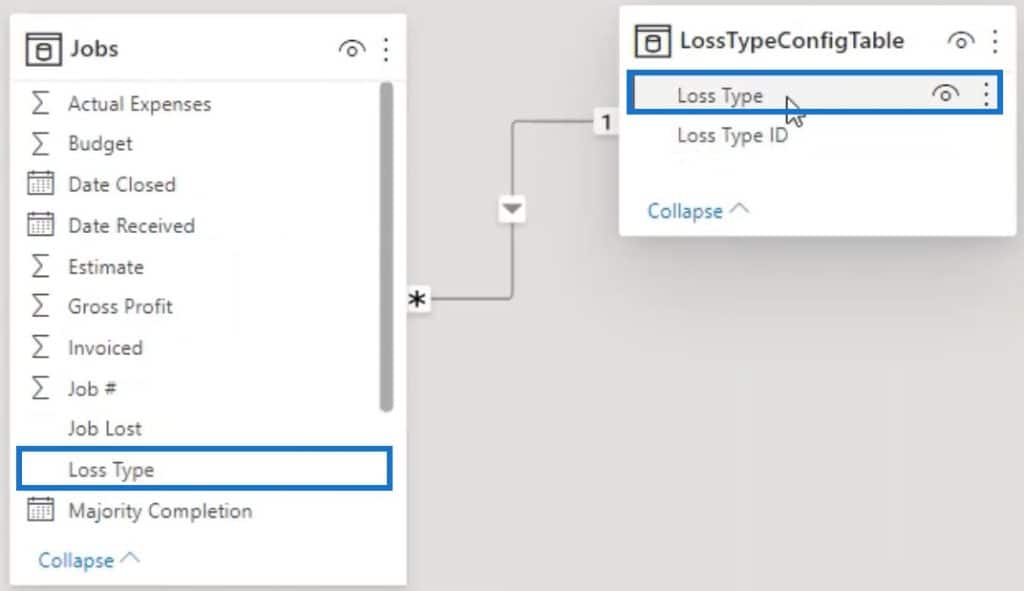
You need to remove the Callback data to have a better performance in your report. To do that, you need to create a configuration table in the data model.
Go to the Enter Data option and paste the data. Name the table LossTypeConfigTable.
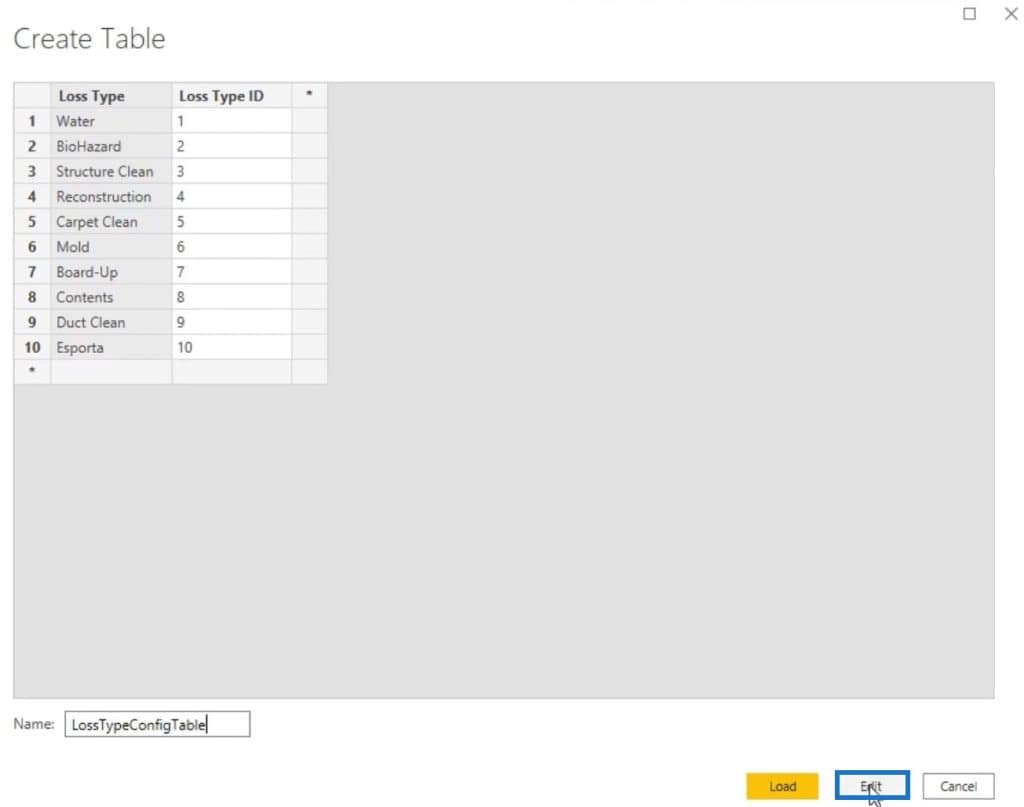
Next, click Edit to change the data type of the column that you’re going to import.
The data type of the Loss Type ID should be a teacher value so it can be used inside the SELECTEDVALUE function.
Once it has been loaded into the model, create a relationship between the Jobs table and the LossTypeConfigTable table based on the Loss Type.
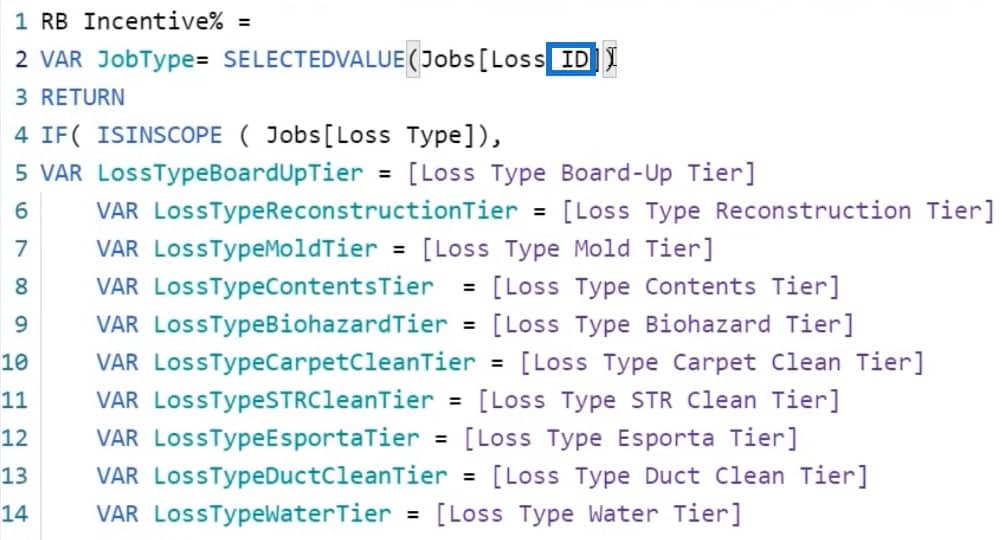
After creating a relationship, go to the Jobs table and add a new column. Call it Loss ID and then, input the formula.

Use the RELATED function for the configuration table and then extract the Loss Type ID.
Next, go back to the RB Incentive% measure and reference the numeric field instead of the text field. Inside SELECTEDVALUE, replace Loss Type with Loss ID.
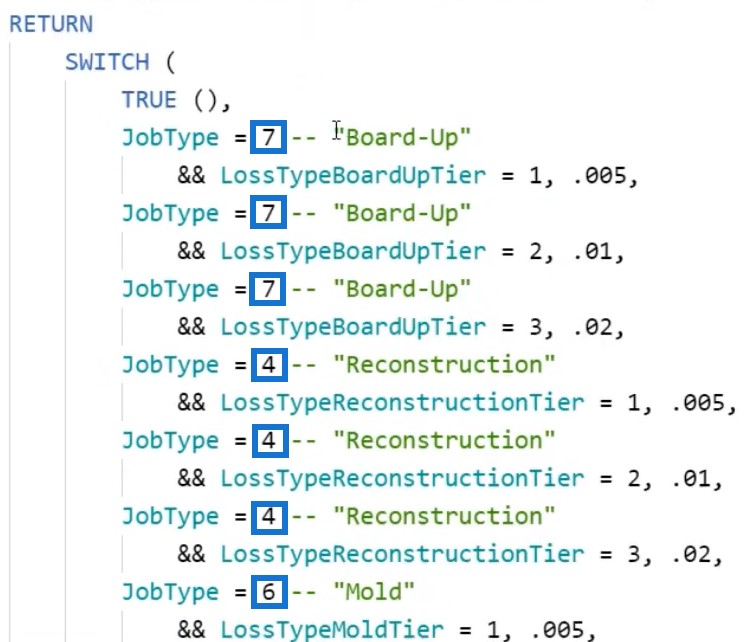
Next, modify all the measures inside the code. Use an integer value instead of text values in checking for the Job Type.
Once you’ve changed the code, confirm the measure and execute it in the DAX Studio.
The Callback data ID is eliminated in the query and the code’s execution time is reduced to 93 milliseconds.
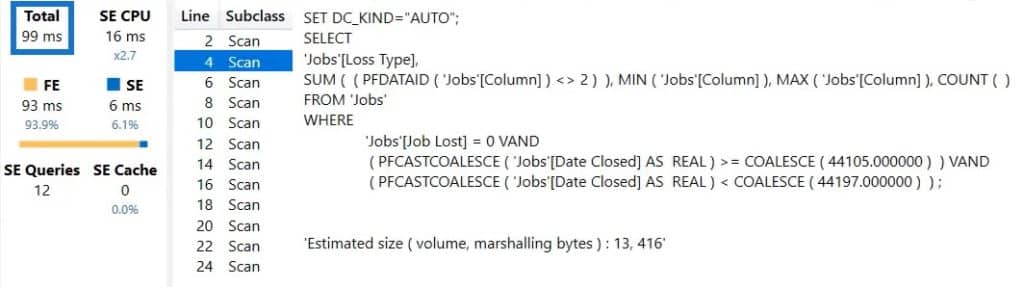
The RB Incentive% measure is now fully optimized.
5. Optimize Other Measures In Power BI
You also need to optimize the WR Incentive% and QB Incentive% measures.
Copy and paste the exact code used in the RB Incentive% measure. Then, run the 3 measures together.
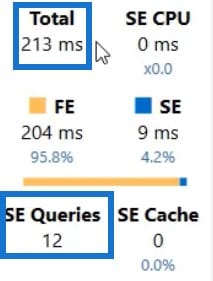
The total execution time is optimized and reduced from 1855 milliseconds to 213 milliseconds. There are also only 12 storage engine queries.
The first two queries create the filter context and the rest represent the exact number of values inside the Jobs Loss Type column.
Since all measures have been optimized, run the original code and see how the performance has changed. The data shows that it’s now being computed in 1.9 seconds.
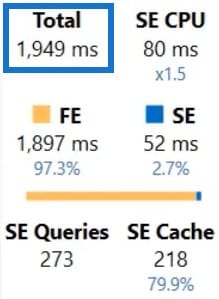
The performance of the whole code is now optimized, making your report faster and better.
***** Related Links *****
Optimize DAX Functions With This New Course
Simple Power BI Transformations For More Optimized Data
Optimize Power BI Formulas Using Advanced DAX
Conclusion
In Power BI reports, measures should be optimized to ensure that your DAX codes run smoothly. This also improves the overall performance of your report.
You’ve learned the different methods to optimize your measure in Power BI and you’ve learned how to assess which one to use depending on the context of your report.
Enterprise DNA Experts


