In this tutorial, I’ll introduce the new version of Enterprise DNA Power Tools, the DAX Editor Pro. You can watch the full video of this tutorial at the bottom of this blog.
This new version of Enterprise DNA Power Tools is a suite of external tools for Power BI developed by Microsoft MVP Greg Deckler, who’s been working with Enterprise DNA for the last few months in developing this toolset.
We released the original version of this a couple of months ago, and it included tools such as the Quick Measures Pro, Metadata Mechanic Pro, and Power Sort Pro.
Greg and I did a video back then introducing the Enterprise DNA Power Tools. It was a really good interview where he walked through the genesis of this project and how it all started. He also talked about the three core tools and how to use them.
We’ll discuss how we can use it in real-world situations, either in our own reports or in developing challenge entries.
I will also showcase how the tool fills in the gaps in Power BI, and how it saves you time when certain things become time-consuming or difficult.
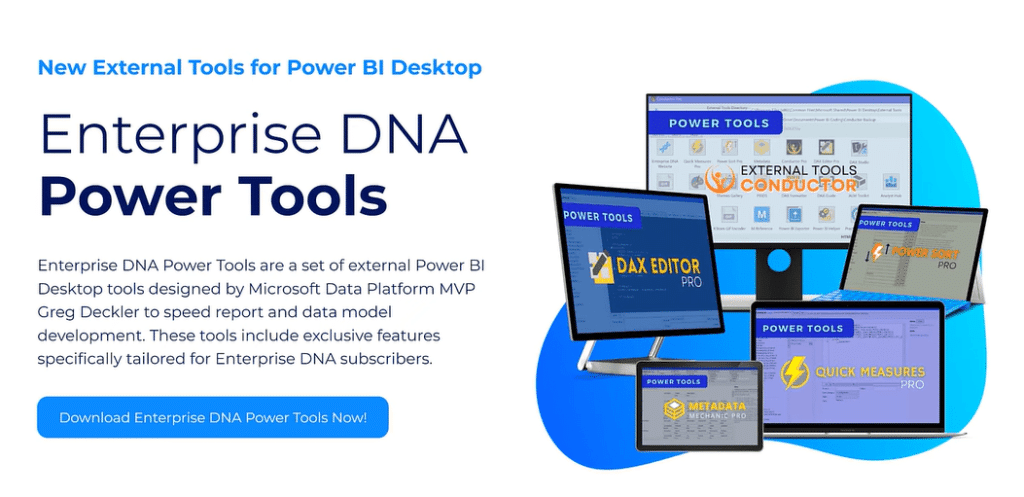
Downloading The DAX Editor Pro
Now let’s focus on DAX Editor Pro. This toolset is free if you are an On-Demand subscriber.
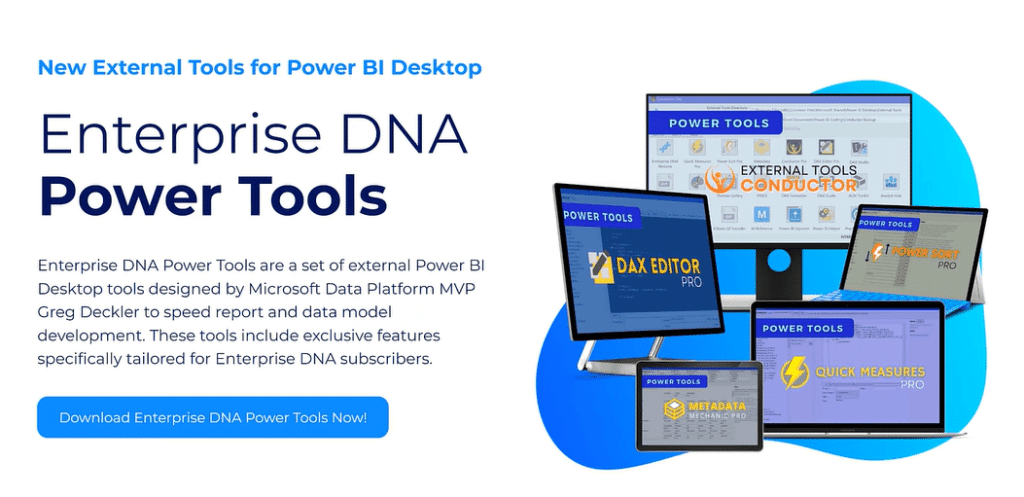
Let me show you how to get the external toolset by going to enterprisedna.co, the home page. From the main menu, hover your mouse to Tech and select Power Tools.

Click the Download Enterprise DNA Power Tools Now button.
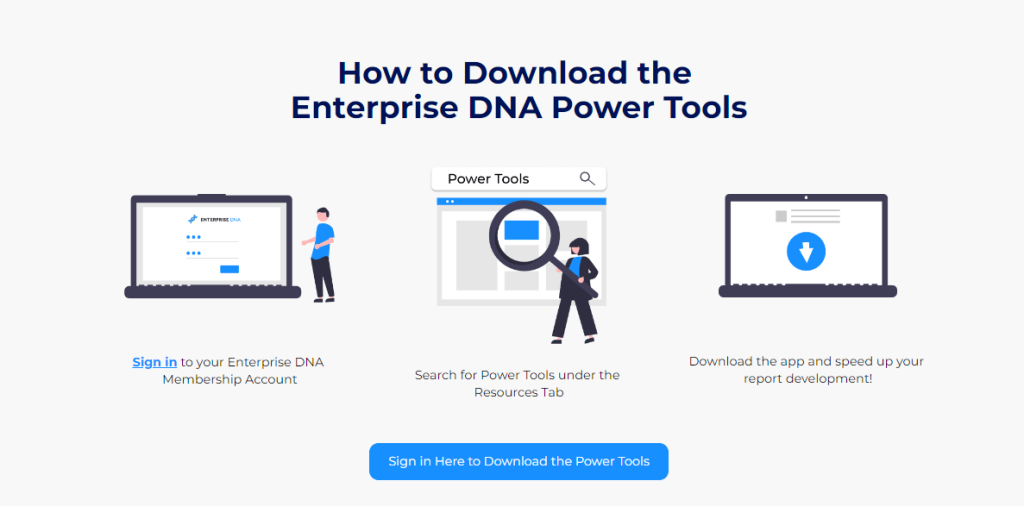
Then click the Sign in Here to Download the Power Tools button.
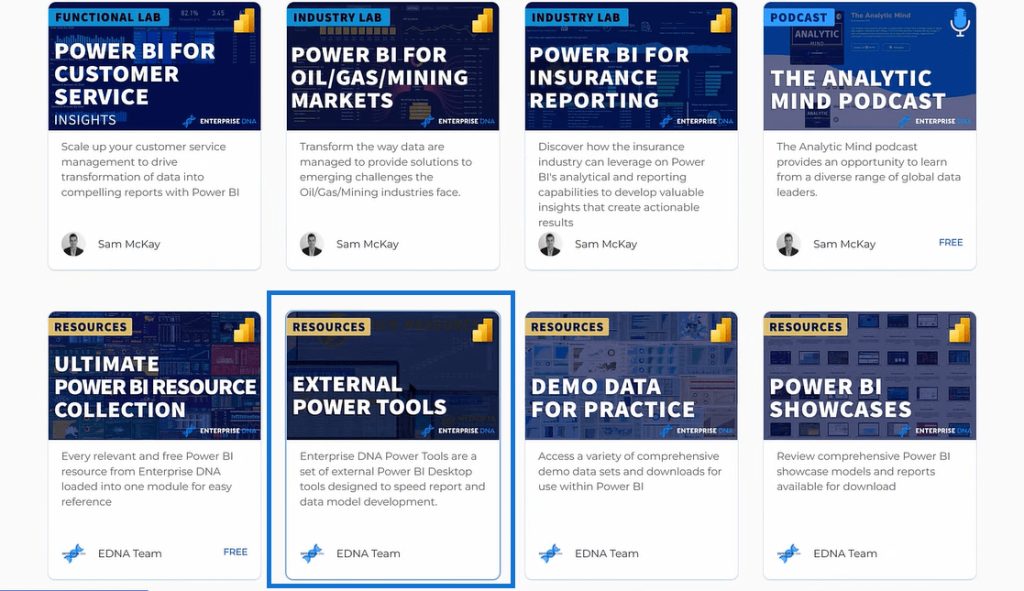
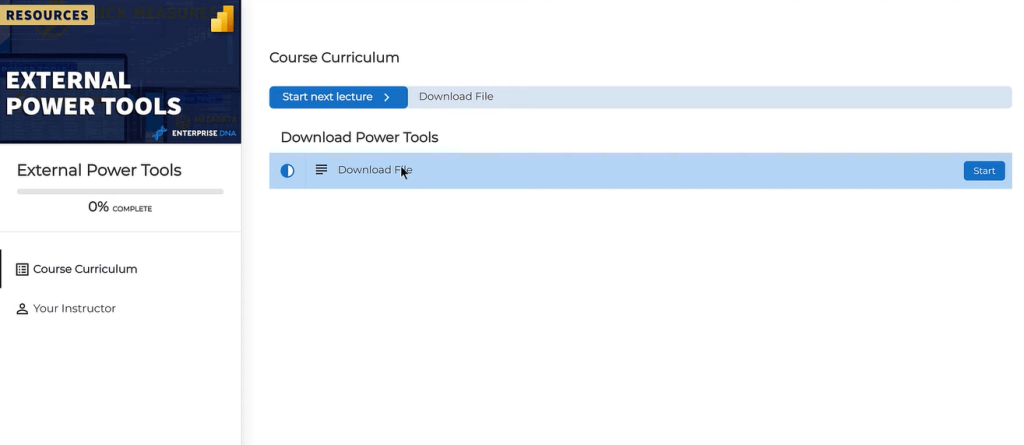
After you enter your credentials, scroll down and select External Power Tools.
Just download the file, and it will give you an MSI file that you need to double click.
It will run through the installation routine. Once completed, go to External Tools, and you’ll get these five sets of tools on your toolbar.
Now let’s jump into DAX Editor Pro by clicking the icon.
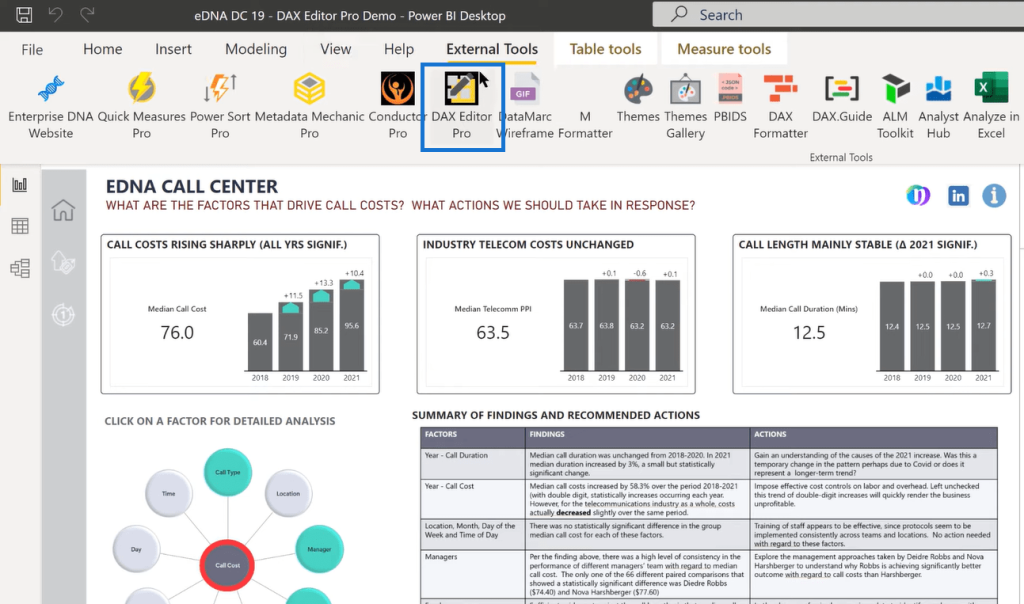
Main Screen & Main Menu Of DAX Editor Pro
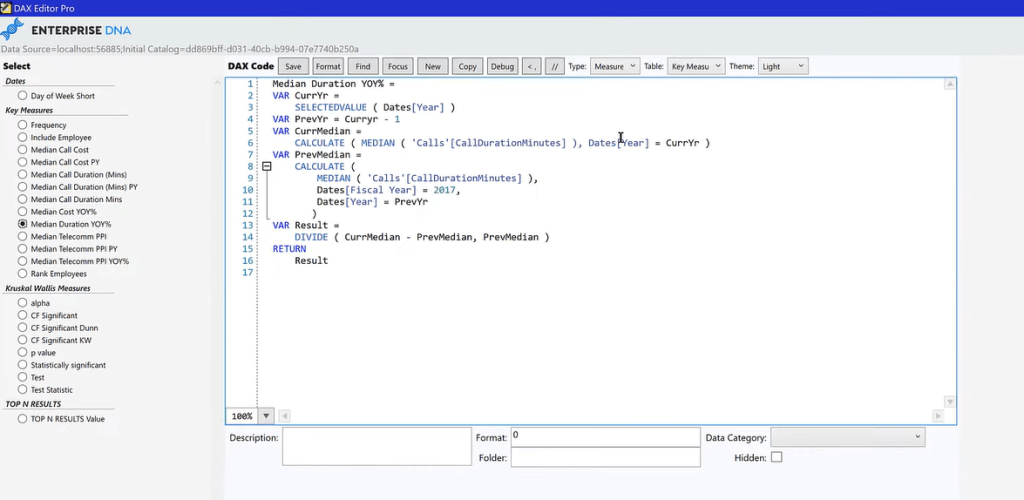
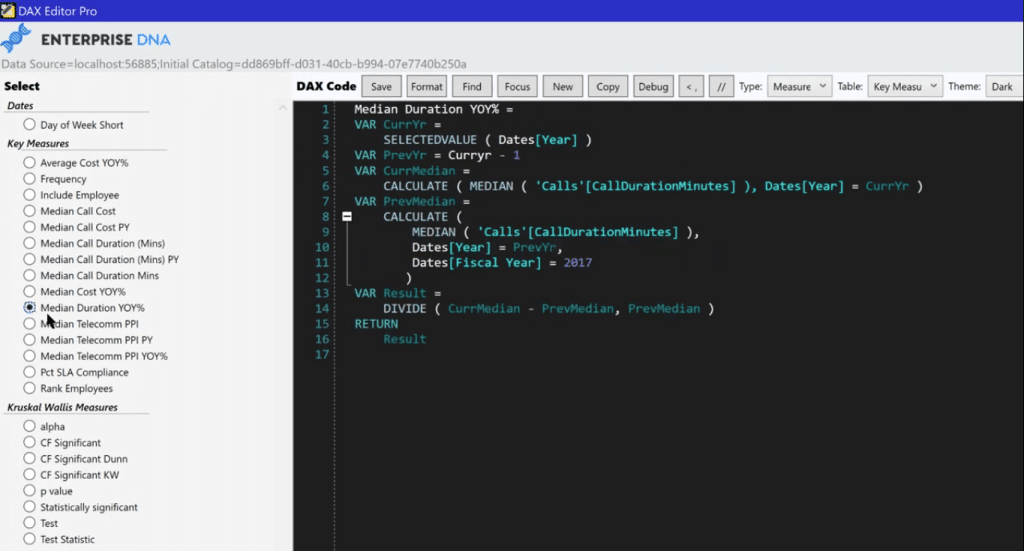
From the main screen, there are a lot of cool built-in themes we can choose from. For this example, let’s pick Median Duration YOY% to see the measure.
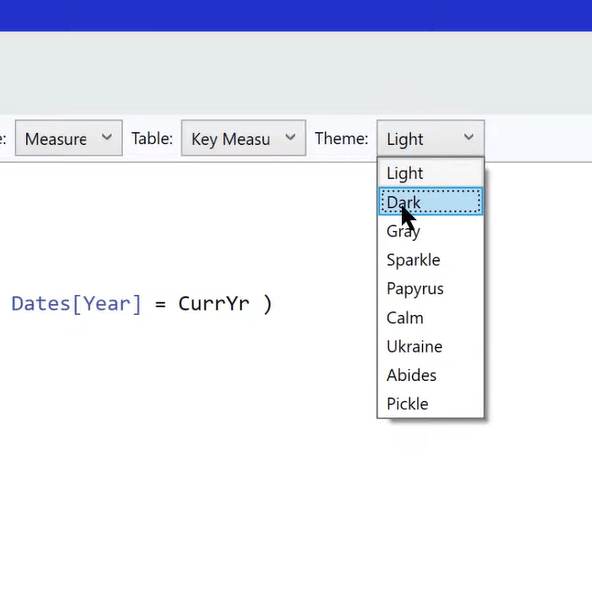
Let’s also select Dark from the Theme dropdown options.
At the top is where we can see the main menu. We plan to change this soon by making the icons with tooltips. For now, this is where we can control the functionality.
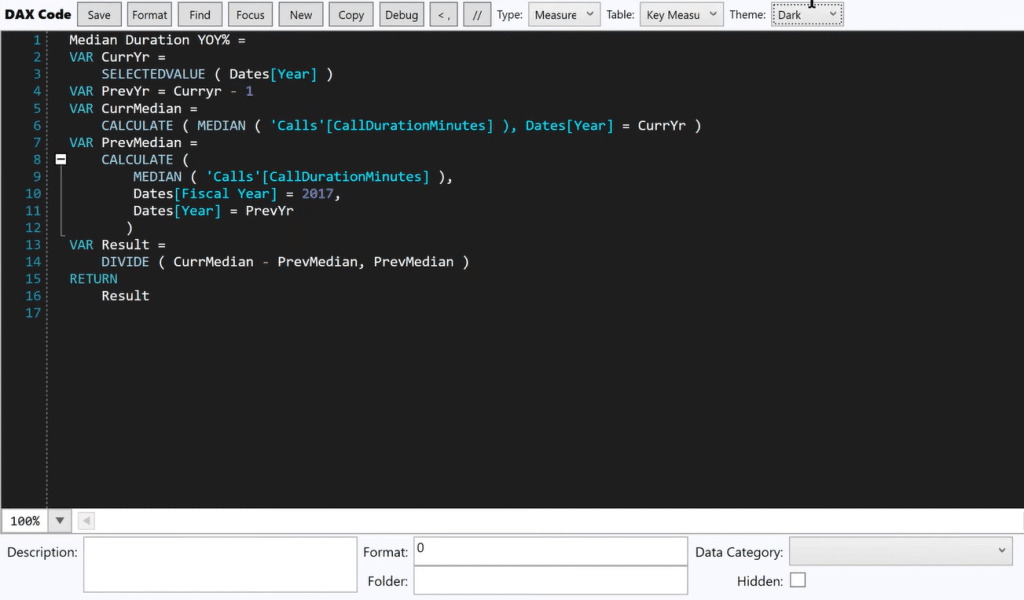
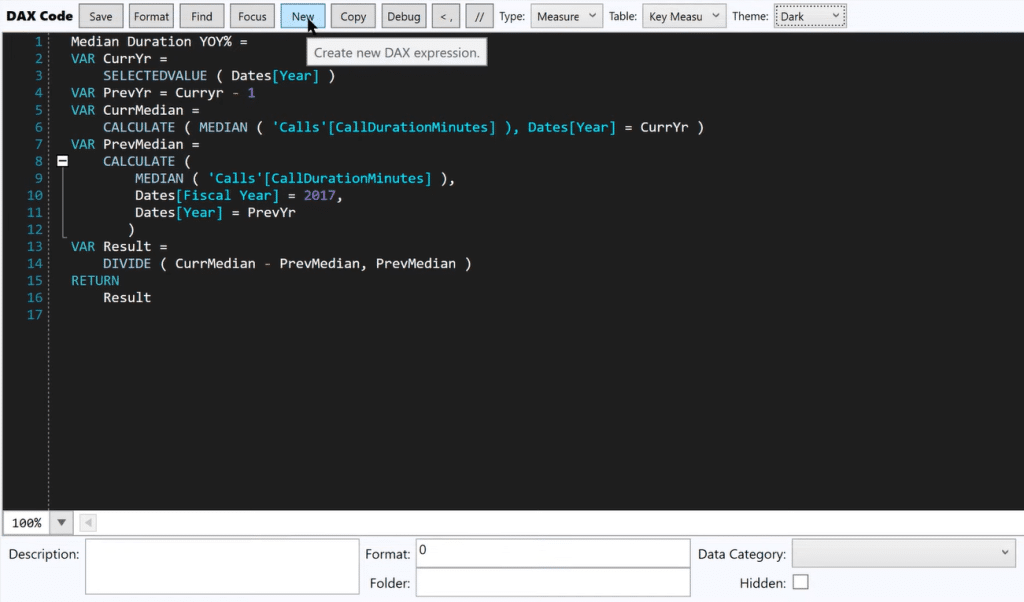
Now let’s go ahead and start a new measure by clicking the New icon.
This is based on Power BI Challenge 19, where we handled a call center dataset. Let’s create a new measure to show how the Percent SLA Compliance works.
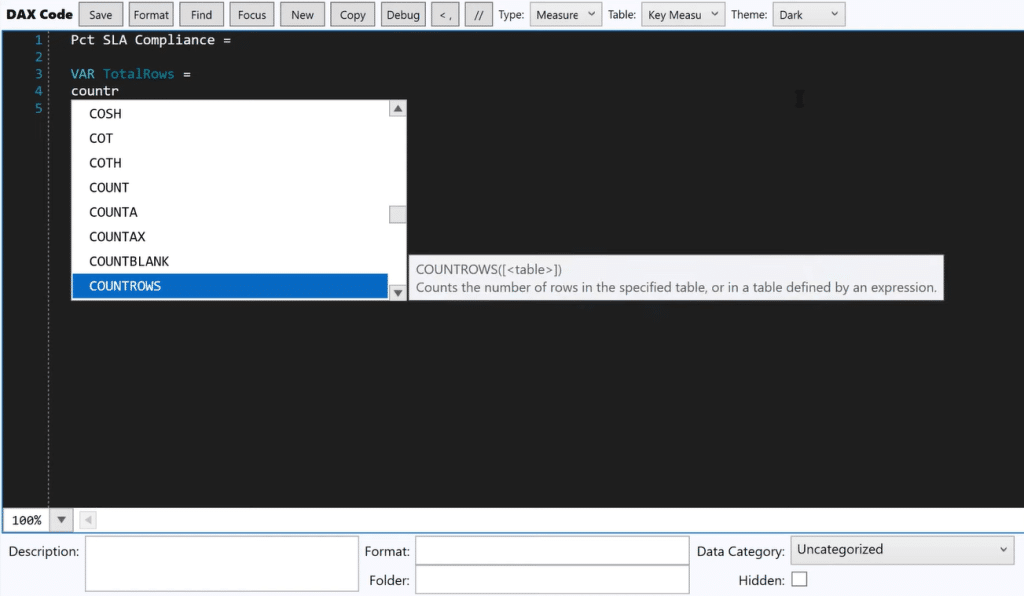
To start the measure, let’s type in Pct SLA Compliance followed by VAR TotalRows.
It also has an auto-complete feature. When we type in count, it will show us the different functions related to count. We’ll select COUNTROWS from the list.
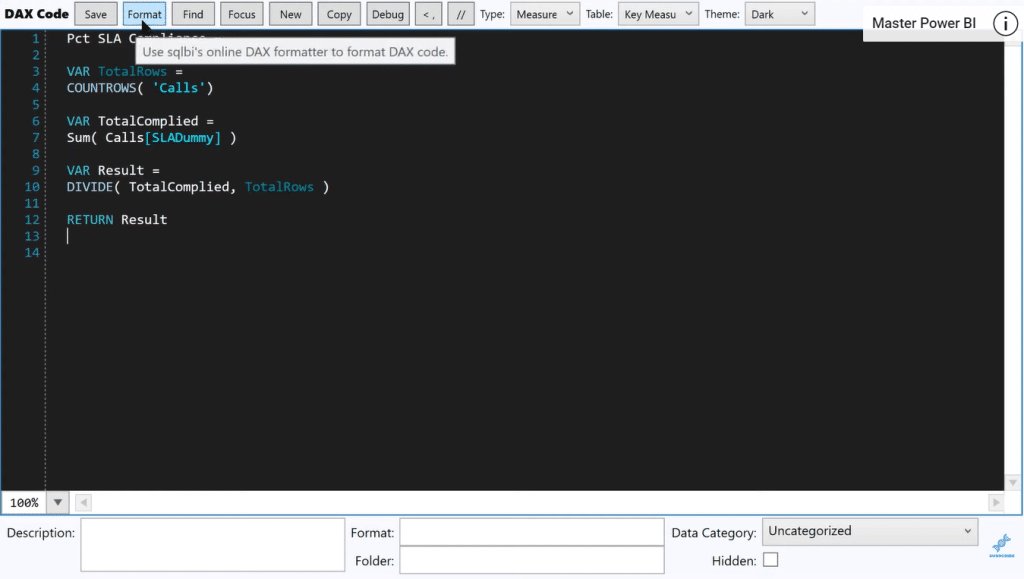
To expedite, let’s copy the rest of these measures from Challenge 19 so I can show you other features.
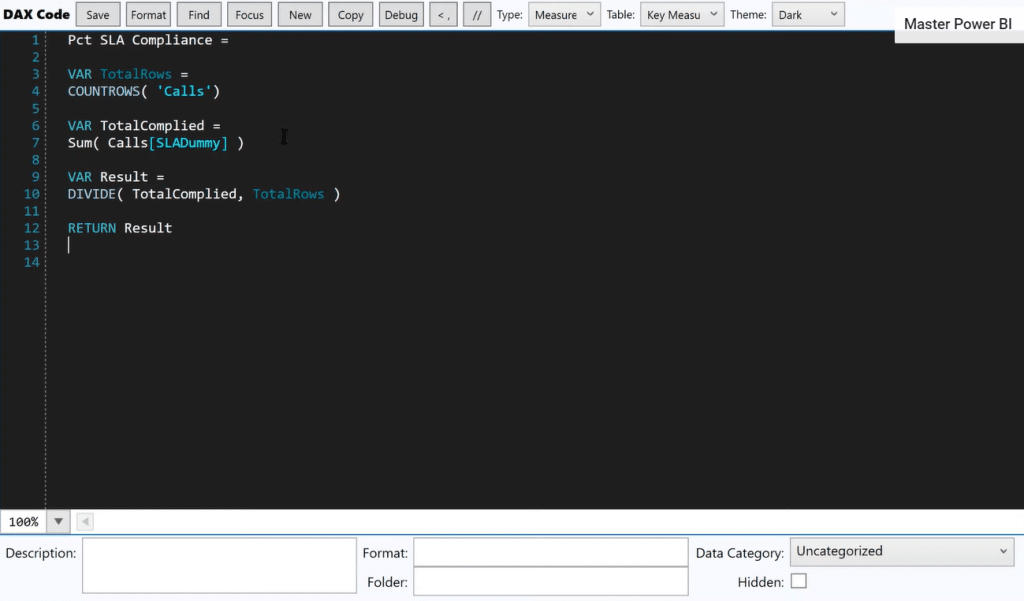
One of the nice things is the Format button with a built-in feature that formats your DAX measures to ensure that there’s no syntax error.
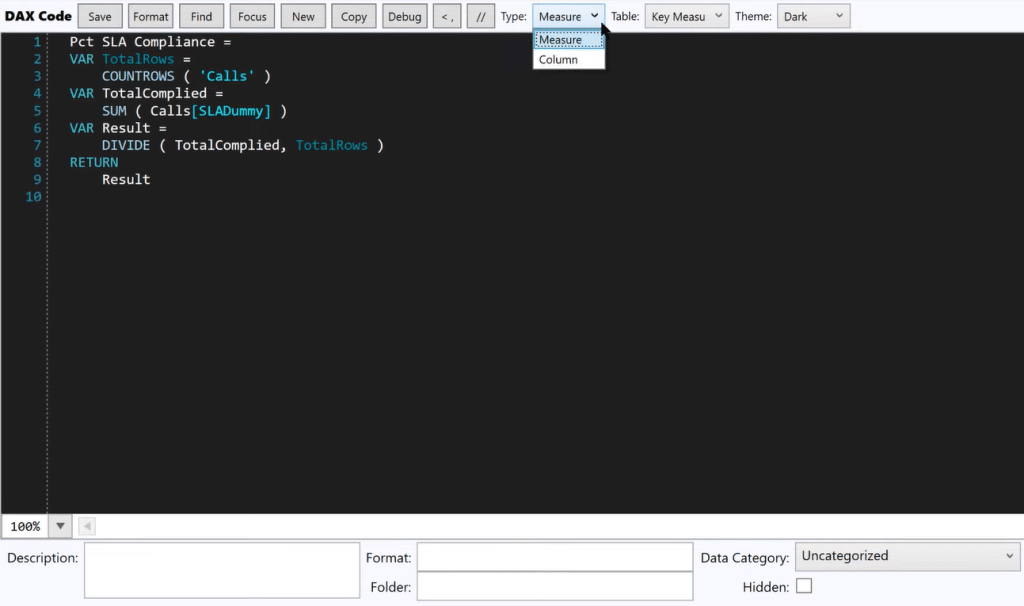
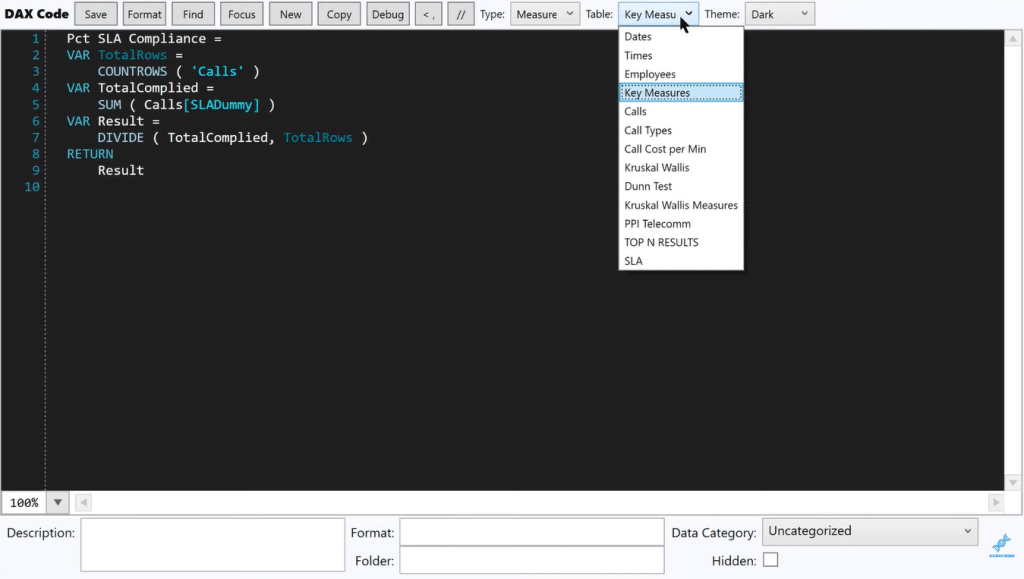
Another great feature is you can do Measures or Calculated Columns. This will put the measures into whatever table you prefer. In this case, let’s set it to go right into the Key Measures table.
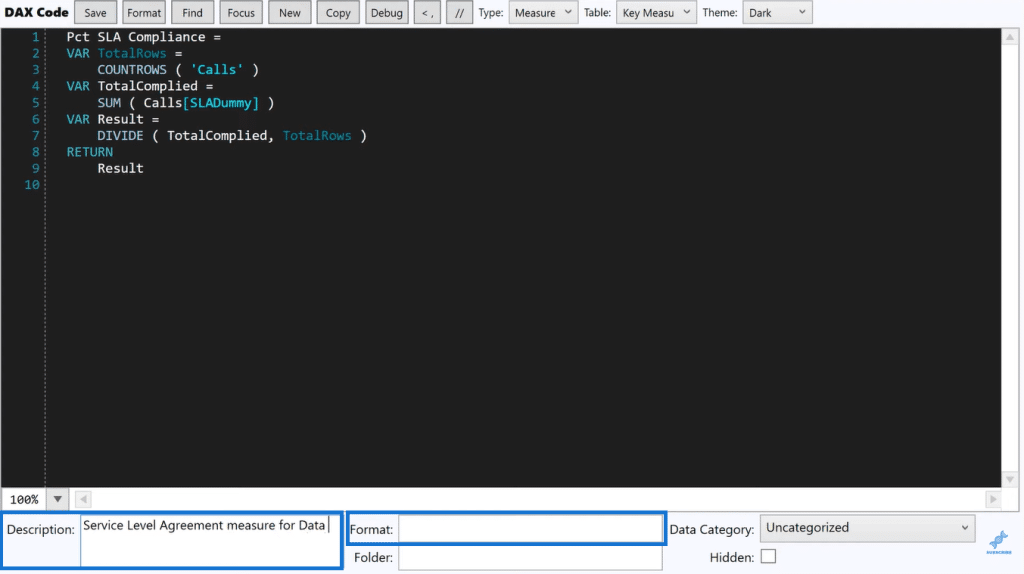
It is also worth mentioning that we can enter Metadata here. For example, let’s type in “Service Level Agreement Measure for Data Challenge 19.”
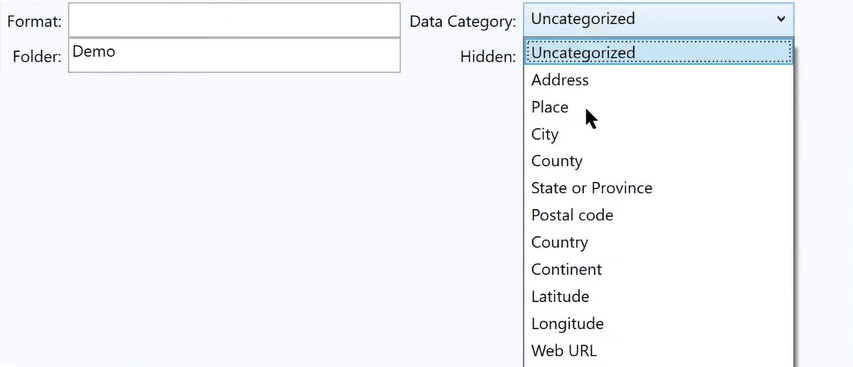
For the Format field, this is where we can put an algorithm. We can select a whole number or a percentage.
We also have the option to divide things by creating a Folder. Let’s create a sample and name it as Demo folder.
The Data Category is a special field where we can set a returning value as country, web URL, image, and more. We can make it hidden or shown.
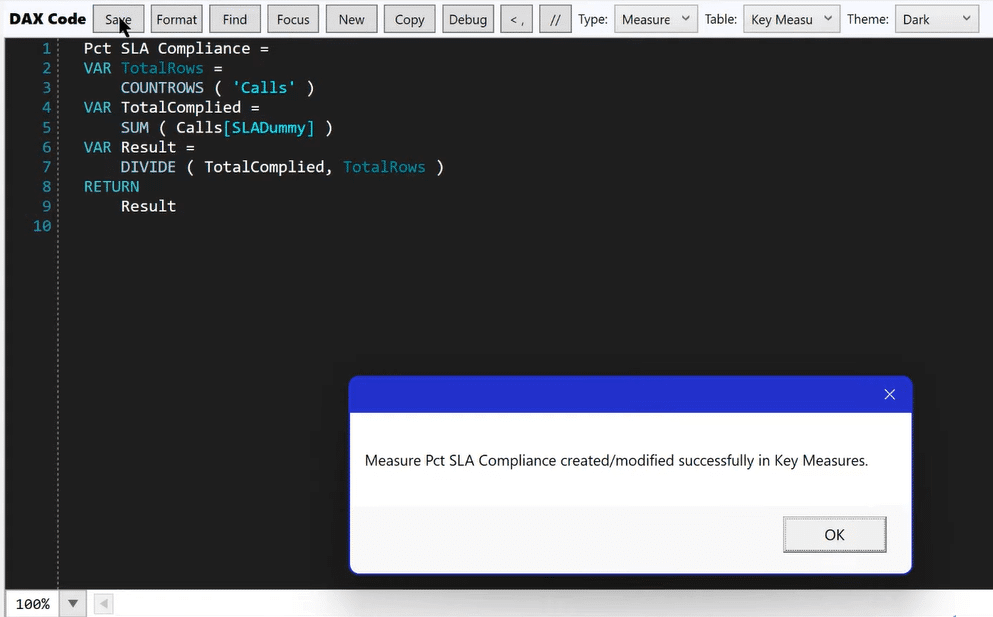
Then all we have to do is to press the Save icon and click OK to save the measure.
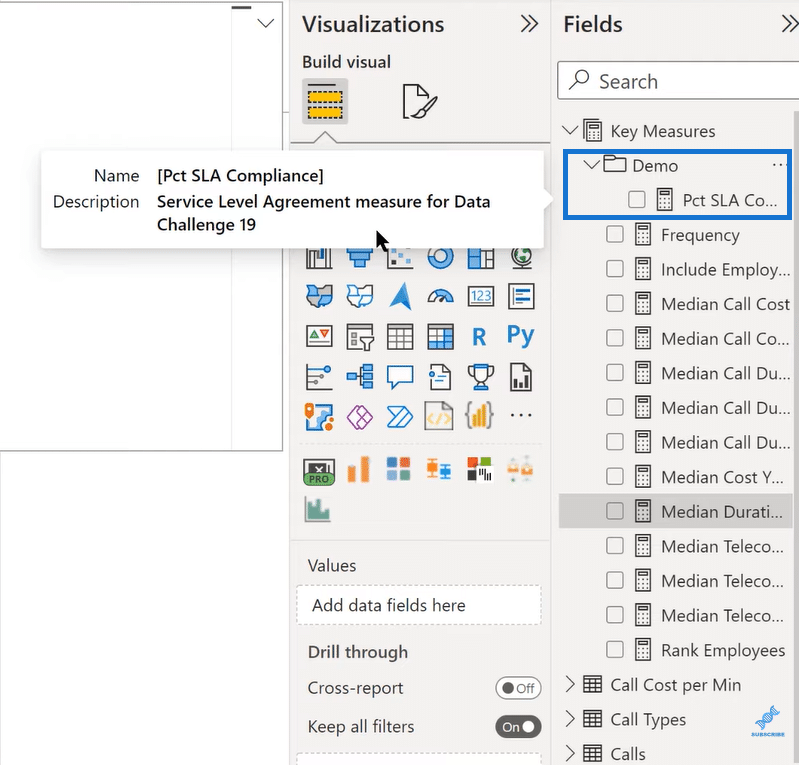
To check, let’s go into Power BI. We can now see the Demo folder that includes the Percent SLA Compliance. In addition, it has the Metadata description that we put in earlier.
This is a really a nice way to document the report and divide things into folders so it will make the table a lot more manageable.
Simple Way To Create Measure
The next thing I wanted to show is a really simple way to create measures. It’s something that I’ve always wanted the main editor to do.
For example, we have this Median Cost YOY% which is a moderately complex measure. We want to change it to Average Cost.
Typically, what we will do is to select all, copy, create a new measure, paste, and then go through line by line to change the Median to Average.
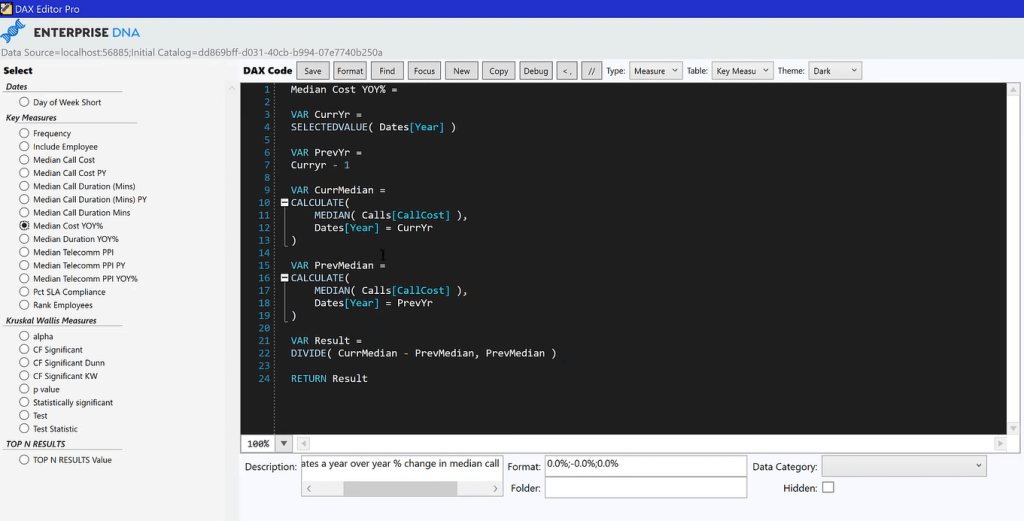
With DAX Editor Pro, it’s very easy to do this. All we have to do is press the Copy icon to create a number one beside the Median Cost YOY%.
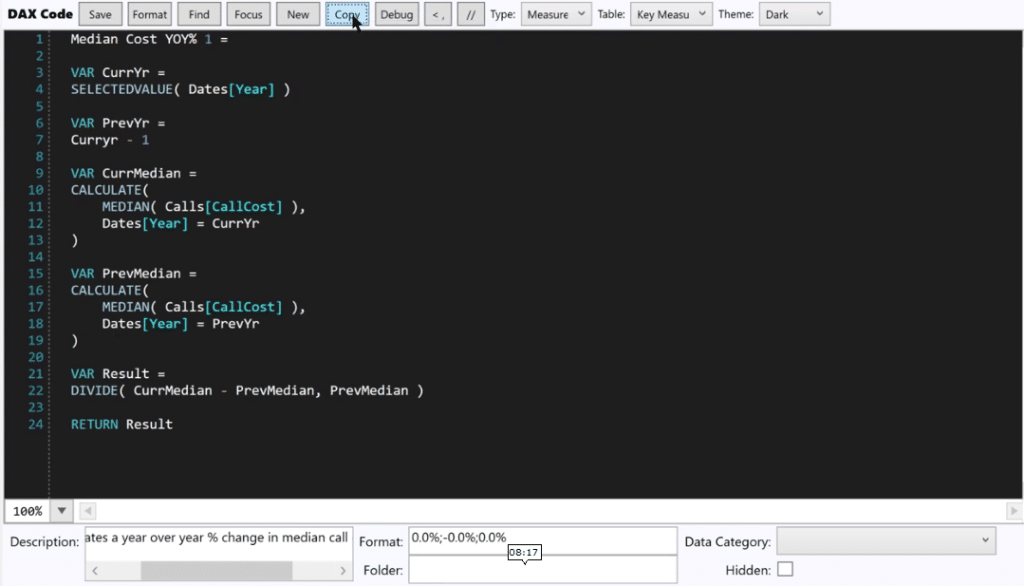
Next is to take the number one out, then click the Find icon to do a full search and replace.
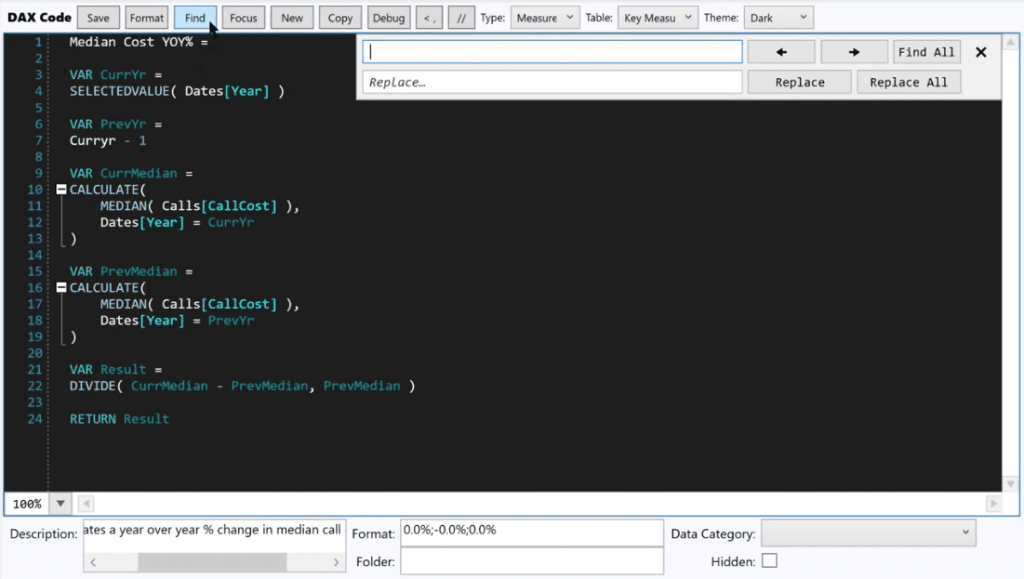
Let’s find Median, replace it with Average, then click the Replace All button.
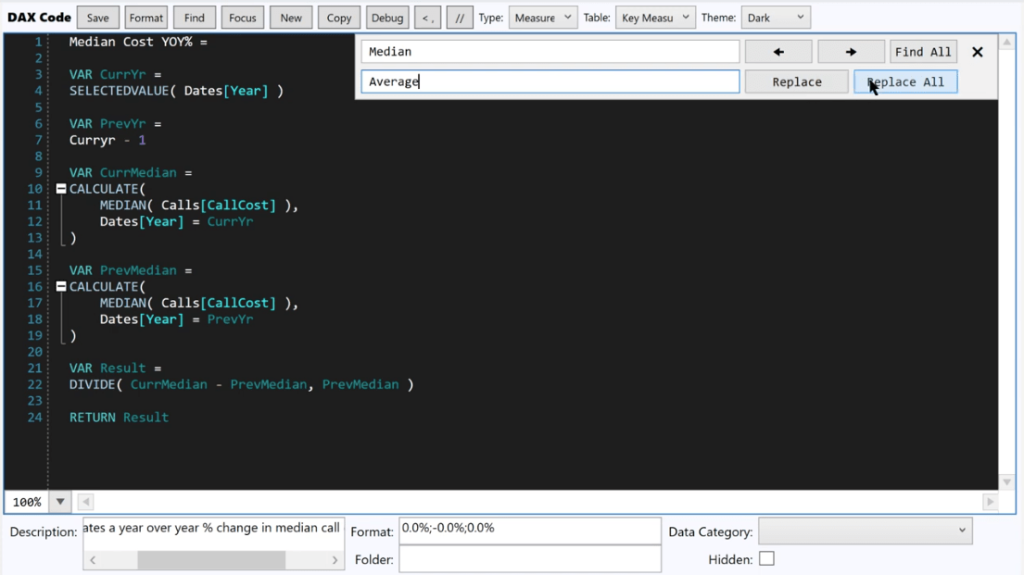
This is now a YOY Average measure rather than a YOY Median. That’s how easy it is to create a new measure using the DAX Editor Pro.
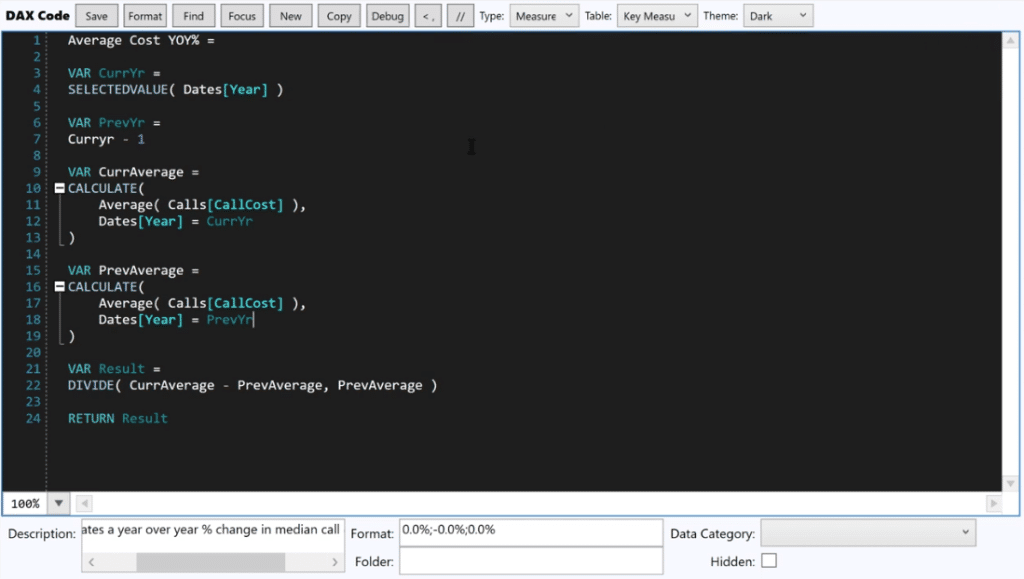
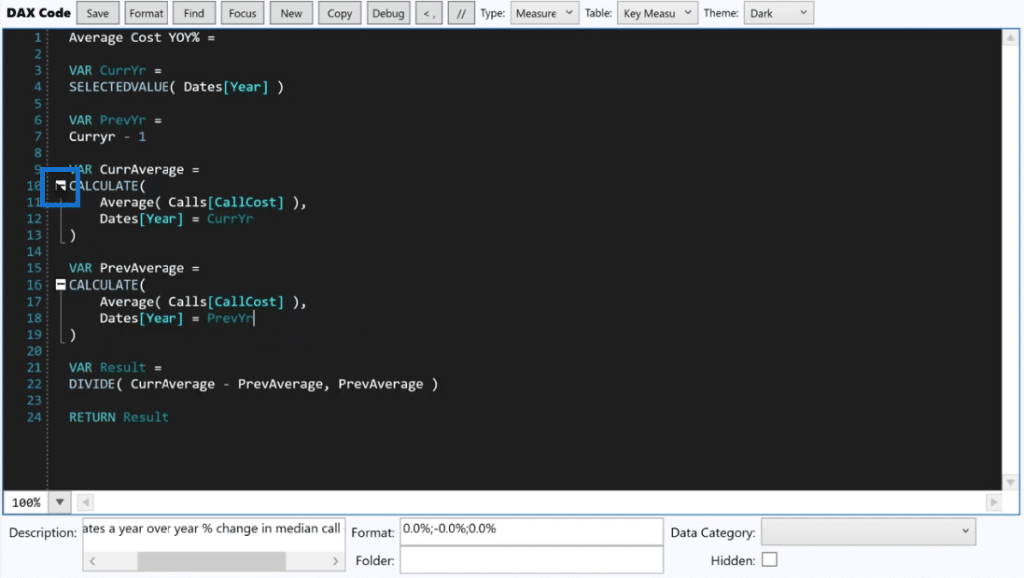
In addition, this outline close is also implemented, where you can open or close it if you have a long measure with complexity.
The objective of this function is to make it easier to see the whole measure in total and dive in to the different sections.
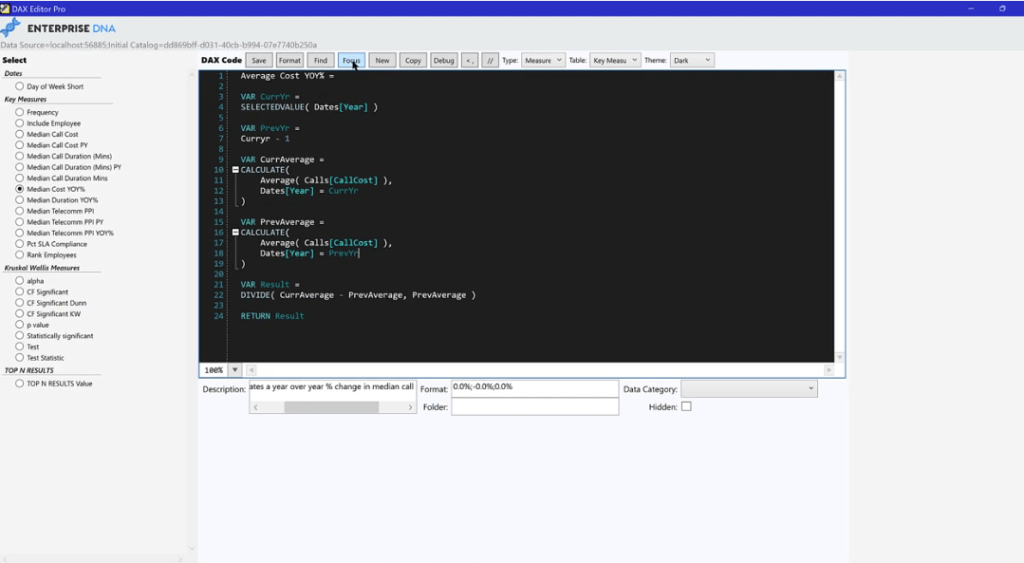
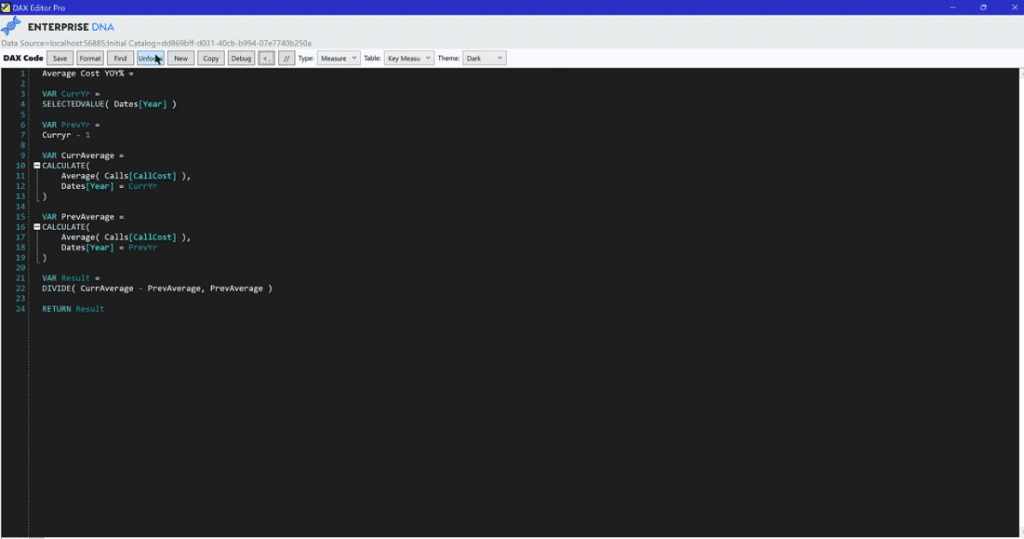
Also, to use the full screen mode without the list of measures, we can select the Focus icon.
Debugging With DAX Editor Pro
Now let’s discuss the Debug feature.
For example, this measure that we put in our table in Power BI was not showing what we expected. There’s something wrong, and we want to debug it.
Press Debug icon, then click OK when the debug tooltips are ready.
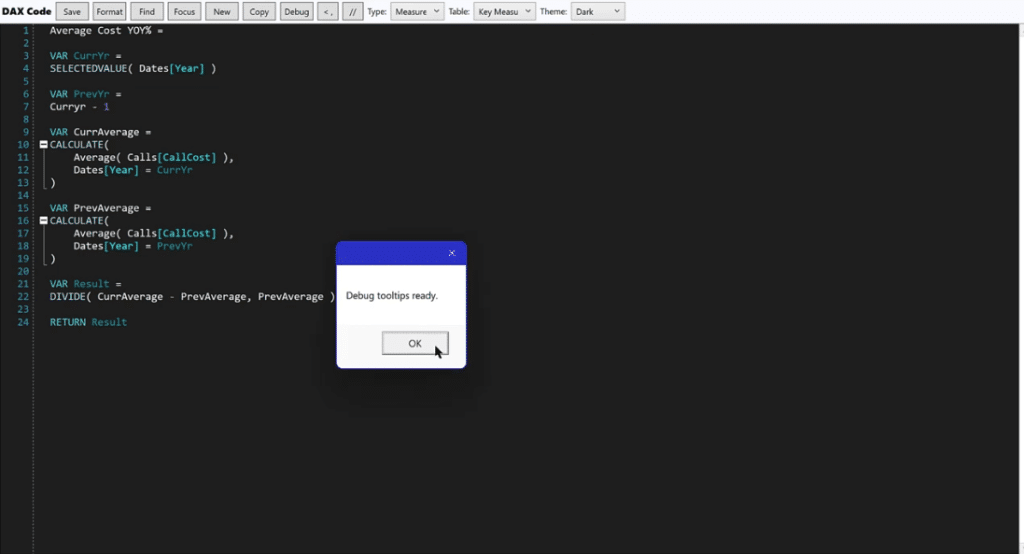
In debugging, one thing you have to do is outside the context of the report page.
If we have the SELECTEDVALUE either in a slicer or in the context of a table, we have to set that variable equal to something.
Just by selecting and highlighting using your mouse, we can temporarily remove the codes.
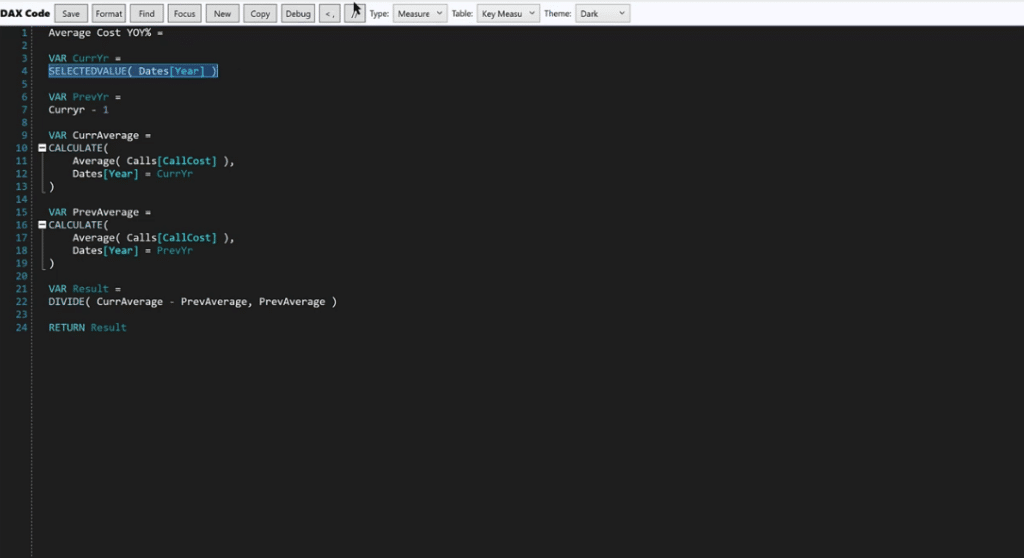
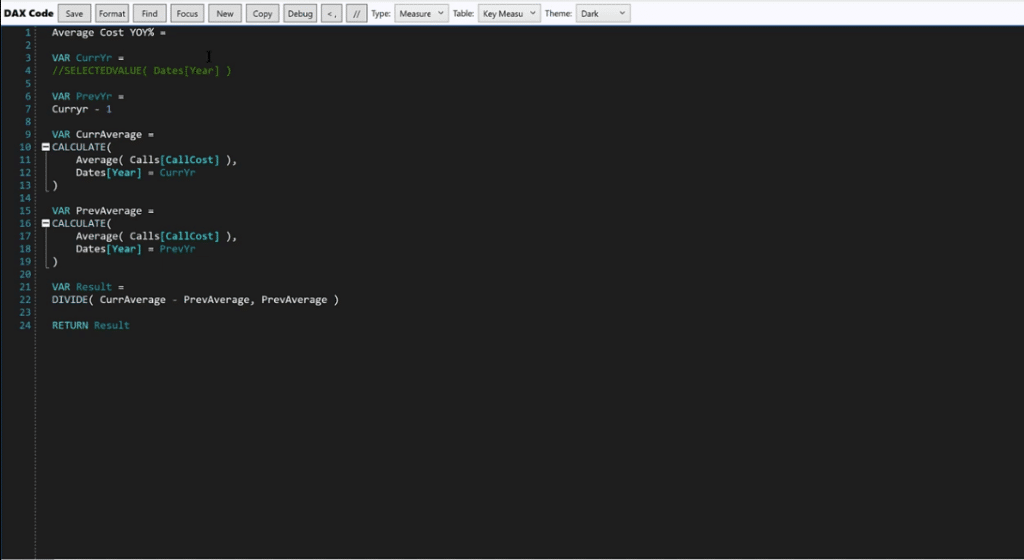
Let’s set the current year to 2020 then rerun the Debug icon.
Normally, the way we will debug this is by going variable by variable, and then substituting the variables into the return statement to see where the problem is.
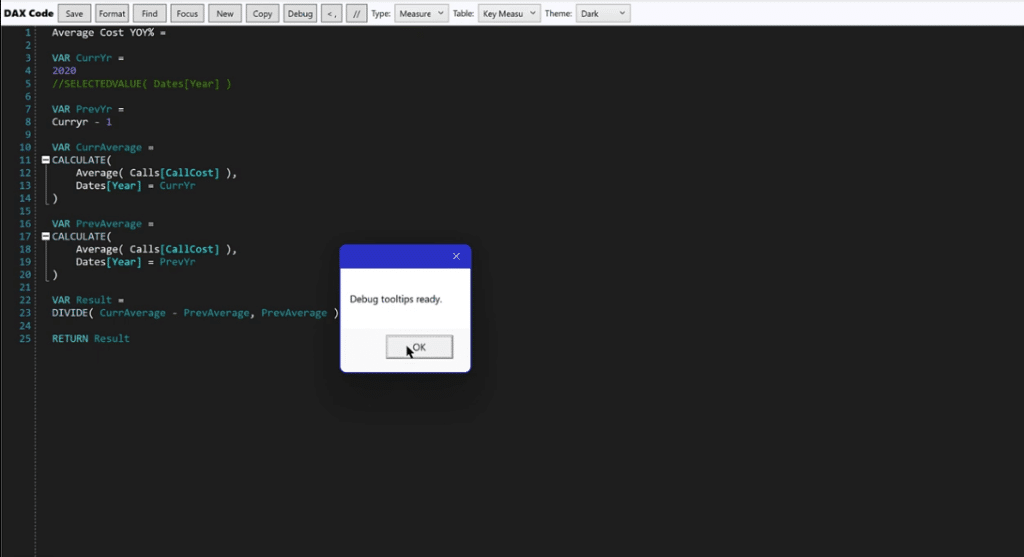
Now let me show you how easy it is to debug using the DAX Editor Pro.
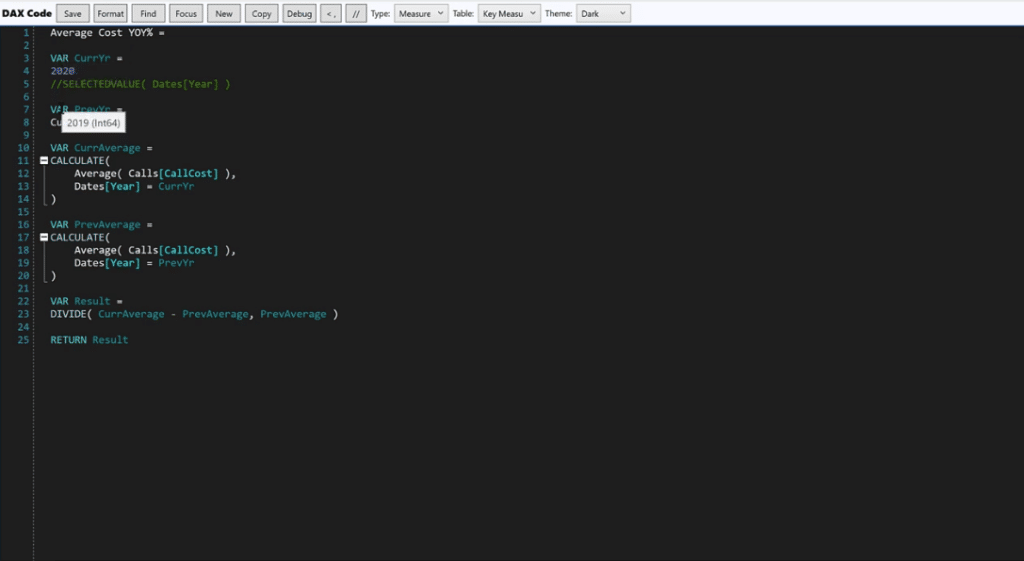
If we hover the mouse on the first variable, it shows the type of variable and the value which is 2020.
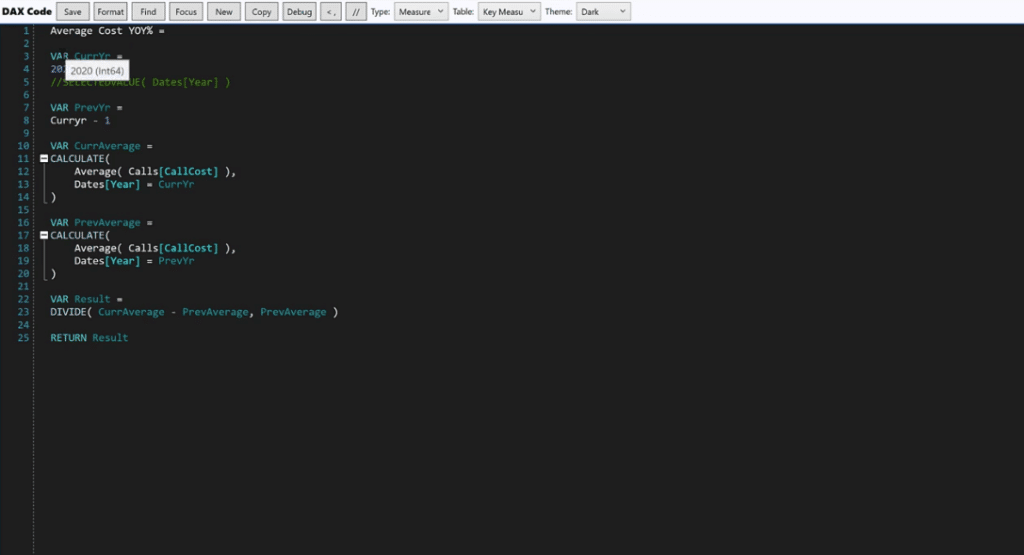
The second variable’s value is 2019.
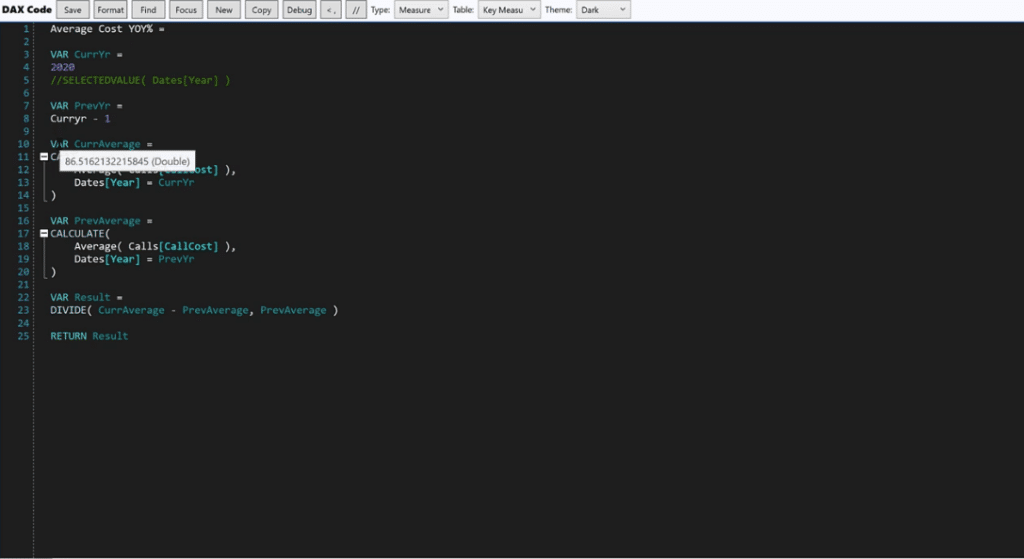
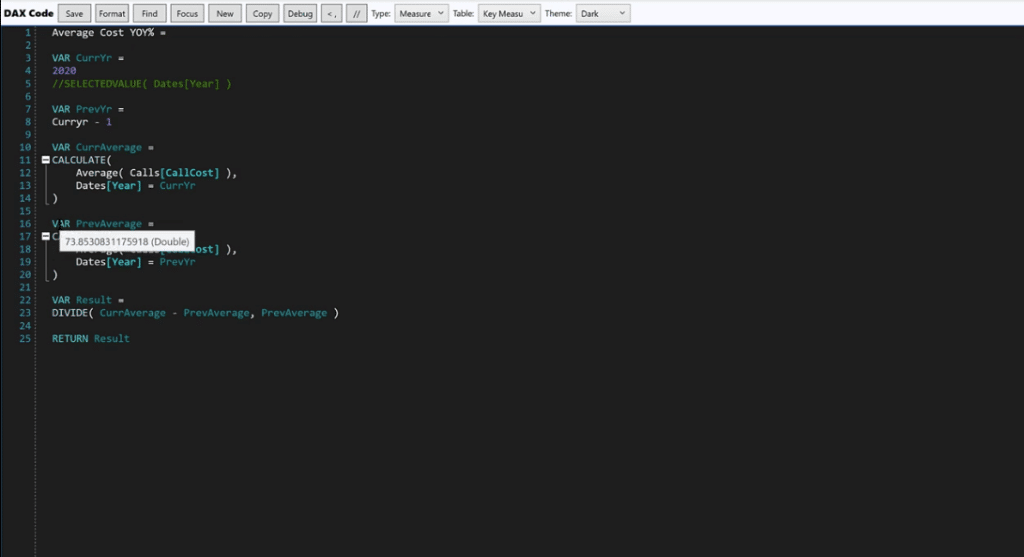
For the succeeding variables, the values are 86.5 and 73.8.
Lastly, if we go to the variable result, we have 17.1.
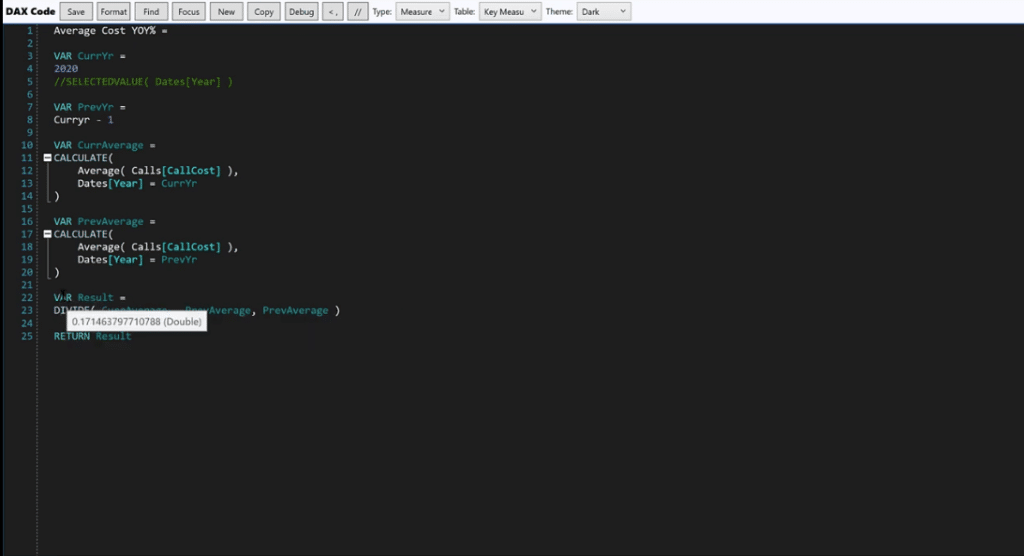
Once we figured that out, we can take the 2020 comment out.
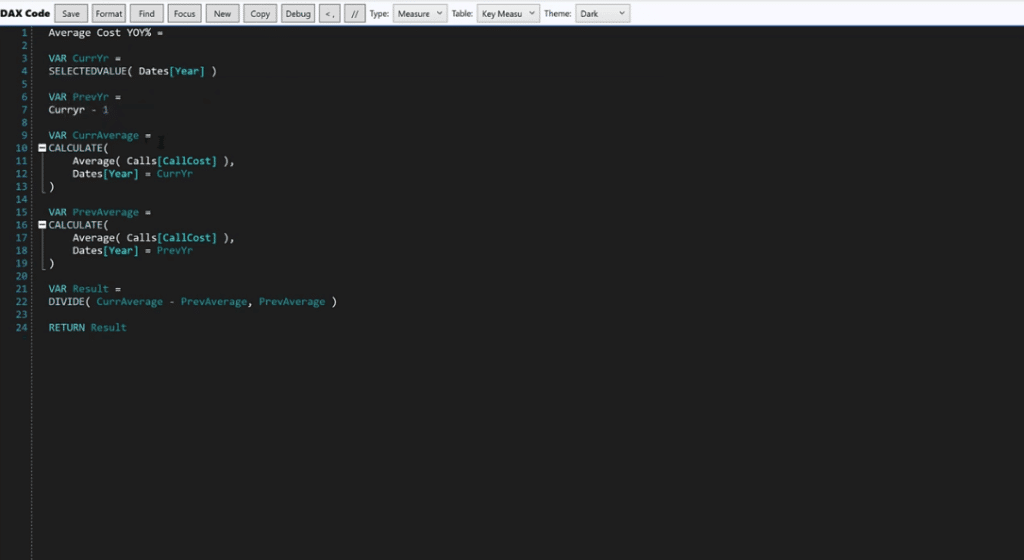
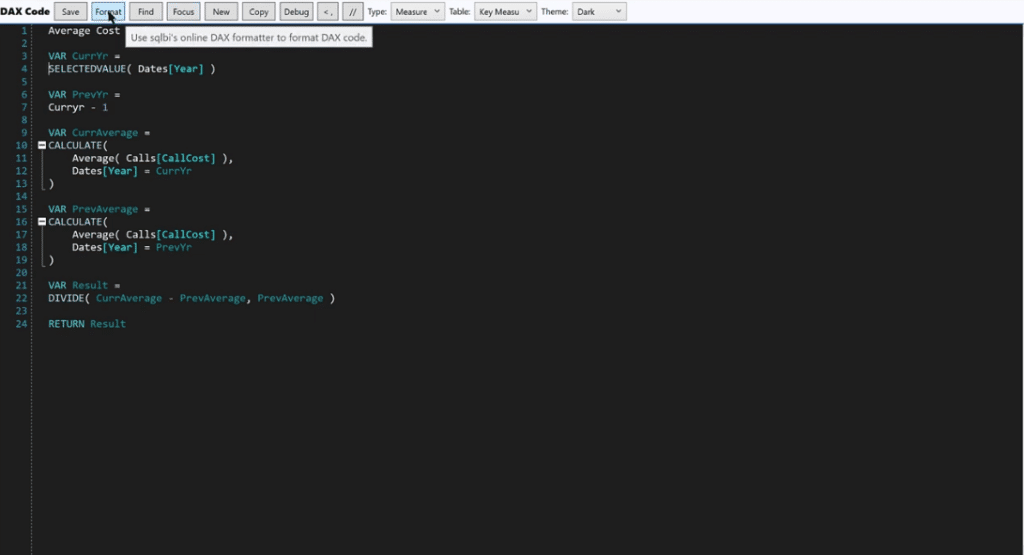
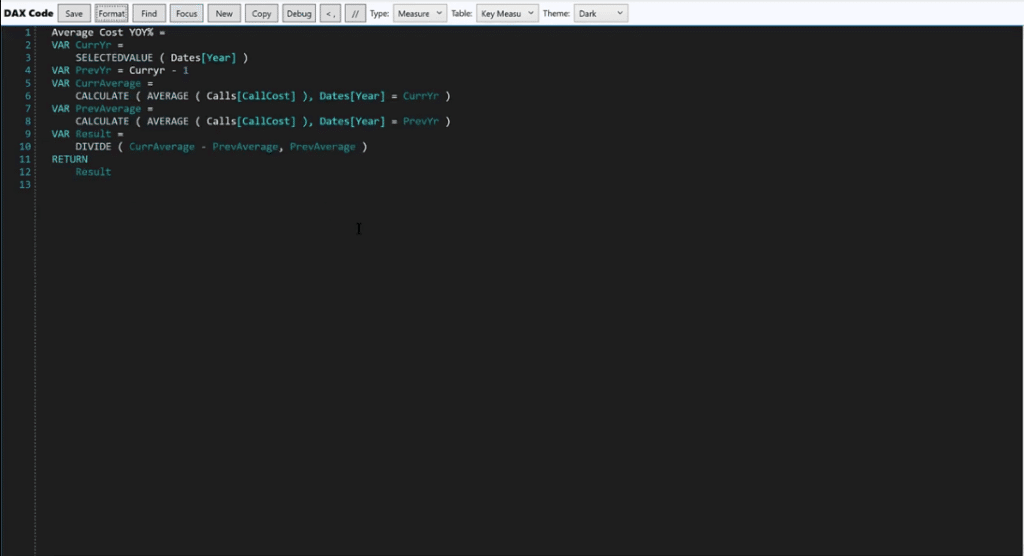
Click on the Format icon to improve the measure and make it look better.
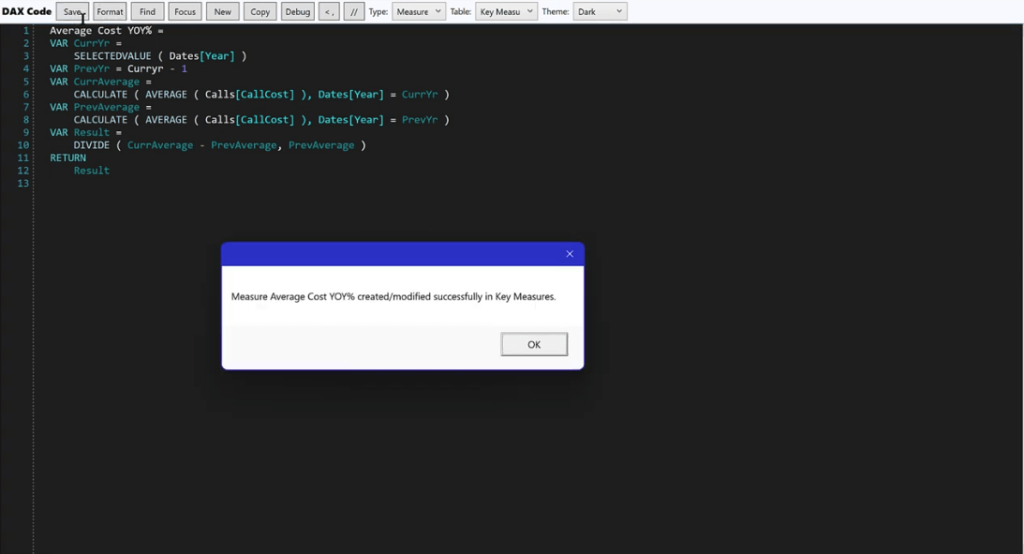
Then press the Save icon and hit OK.
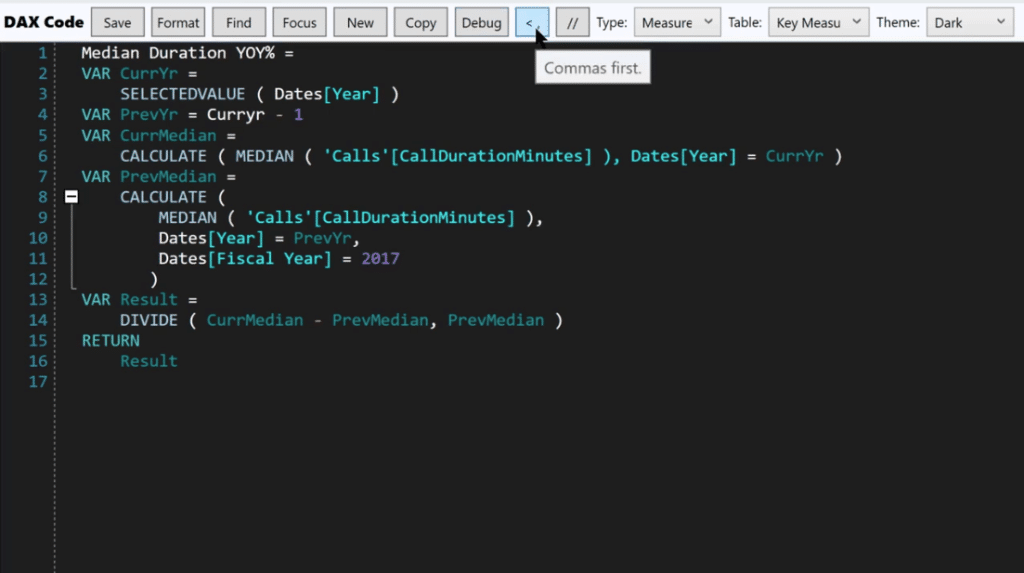
Let me show another feature called Commas first. From the Key Measures, let’s use the Median Duration YOY%. There are two conditions for the calculated statement.
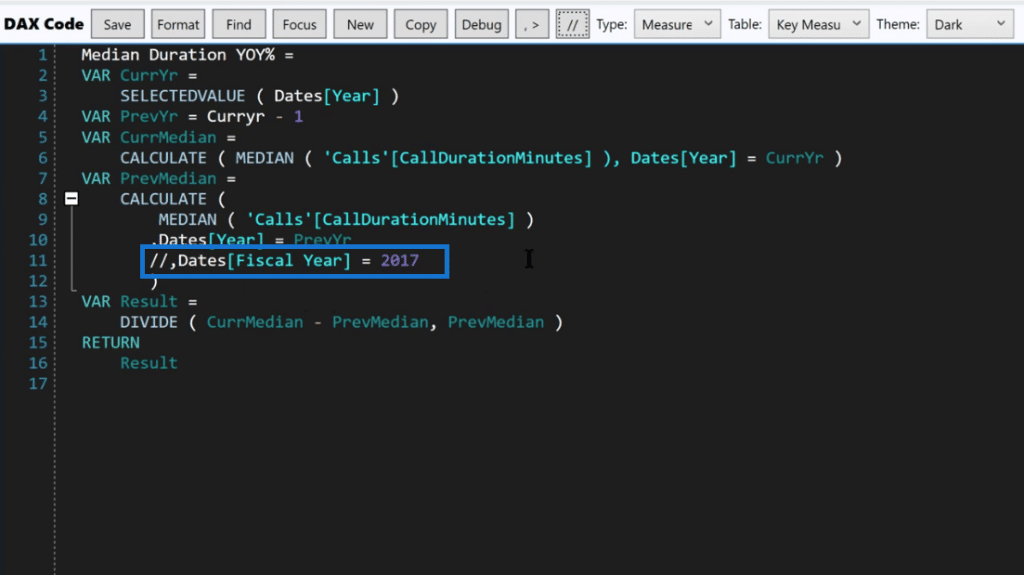
Let’s say the Dates[Fiscal Year] = 2017 is problematic. So, we want to comment that out to see if the measure works and delivers the expected results without that in there.
The thing is, if we remove the codes temporarily, we also need to delete the comma on the previous line.
Then, it becomes a headache when we’re removing the codes, reversing them, then testing things out, and remembering to put that comma back.
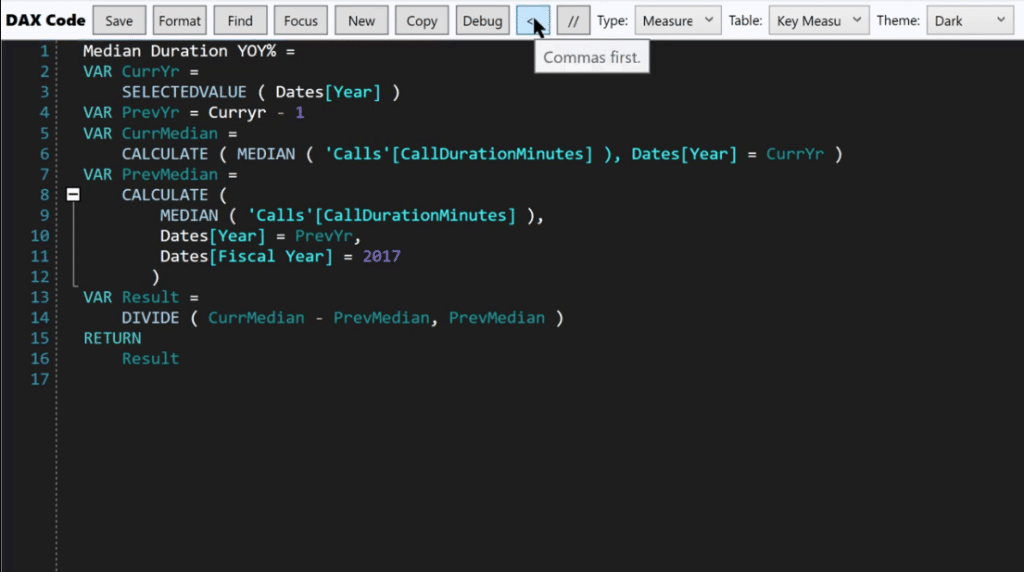
To solve this, click the Commas first icon to move commas down to the beginning of the next line.
It is important because we can comment out this whole line without having to go back and delete the comma since it’s now sitting at the front of the line.
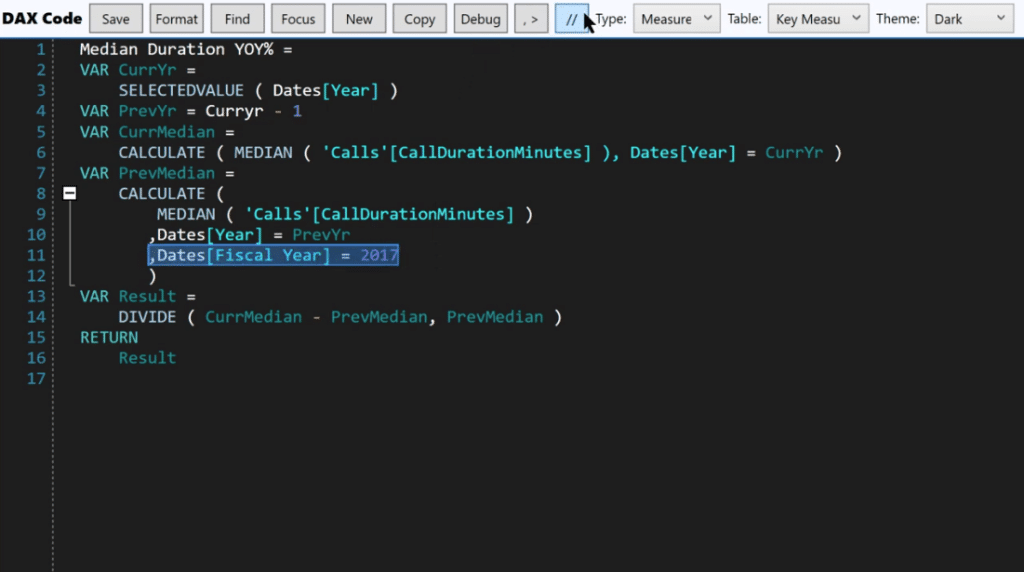
We can test this and if it doesn’t give what we wanted, we can then take that comment out and return the comment to the original position by clicking Commas first again.
***** Related Links *****
How To Install DAX Studio & Tabular Editor In Power BI
Configure Query Settings In Power BI DAX Studio
Power BI Parameters Via Query Editor
Conclusion
DAX Editor Pro has a very nice editing environment. It does not require a long learning curve to figure out how to use it. We can just dive right in and start working it the way we normally would within DAX.
I really want to thank Greg for his hard work. It just made working in Power BI for me a lot more pleasurable.
All the best,
Brian


