
Profit and Loss Statements are often challenging to create in Power BI, especially if you’re working with large or complex datasets. In this tutorial, you’ll learn about the common challenges encountered when dealing with Power BI Profit and Loss (P&L) statements. Solutions for each challenge are also discussed in detail.
Unlike other business reports, P&L statements are universal. Thus, problems encountered when creating P&L statements are most likely similar across organizations.
This means that you can learn from others and leverage templates and ideas that have previously been established.

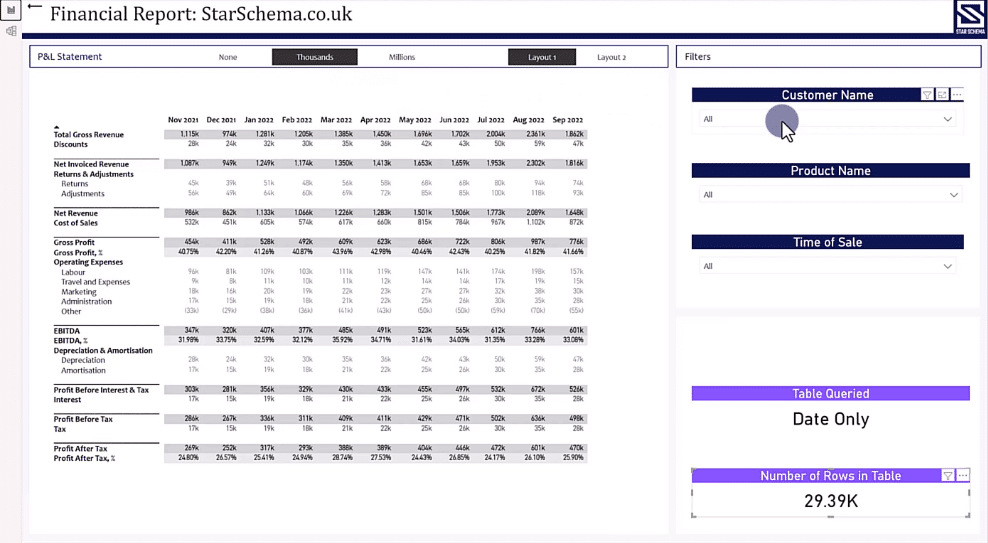
To discuss the common challenges of P&L statements in Power BI and their respective solutions, this financial report will be used as an example. The report is running 1.1 billion rows in the background. This dynamic report also allows you to select the Customer Name, Product Name, and Time of Sale.
Common Challenges In A Power BI P&L Statement
These are the 10 common challenges encountered when dealing with P&L statements in Power BI:
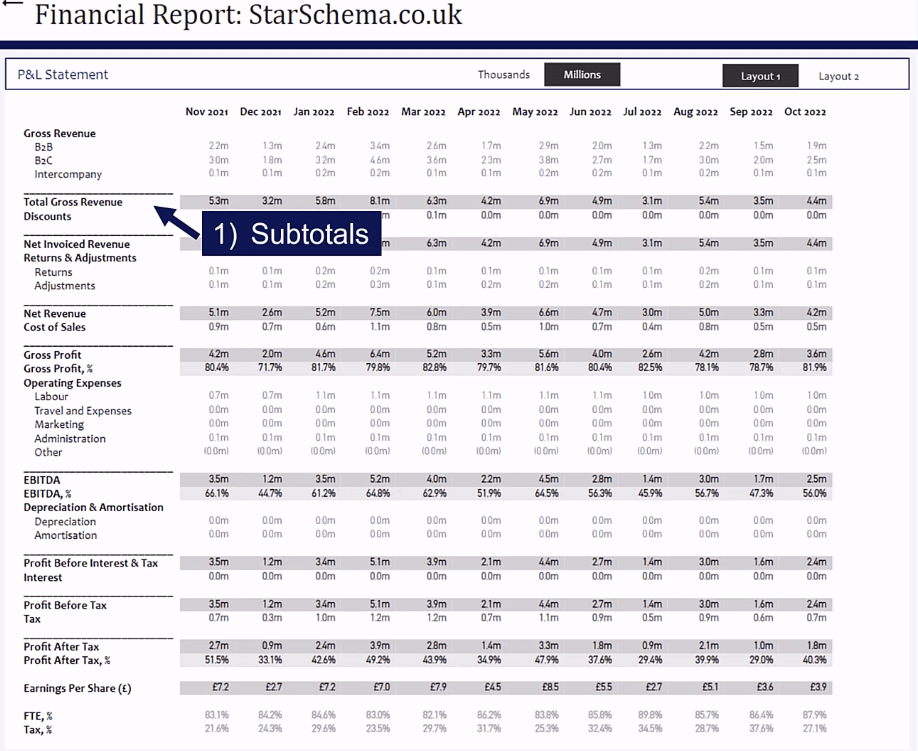
1. Subtotals
Subtotals are intermediate totals that show the sum or total of a specific group of items within a larger dataset. Subtotals are often used to break down a large dataset into smaller, more manageable chunks, and to show the relationship between different groups of data.
It’s also the first challenge you’ll come across when dealing with P&L statements.
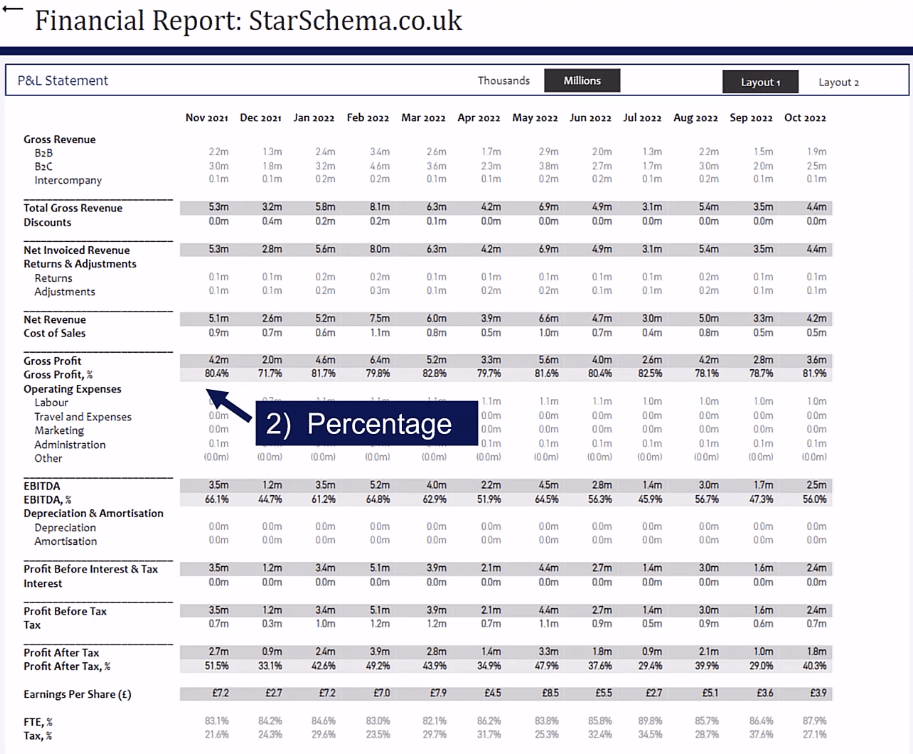
2. Percentages
Percentages don’t often appear in public financial statements. But when doing internal reports, they will most likely be needed.
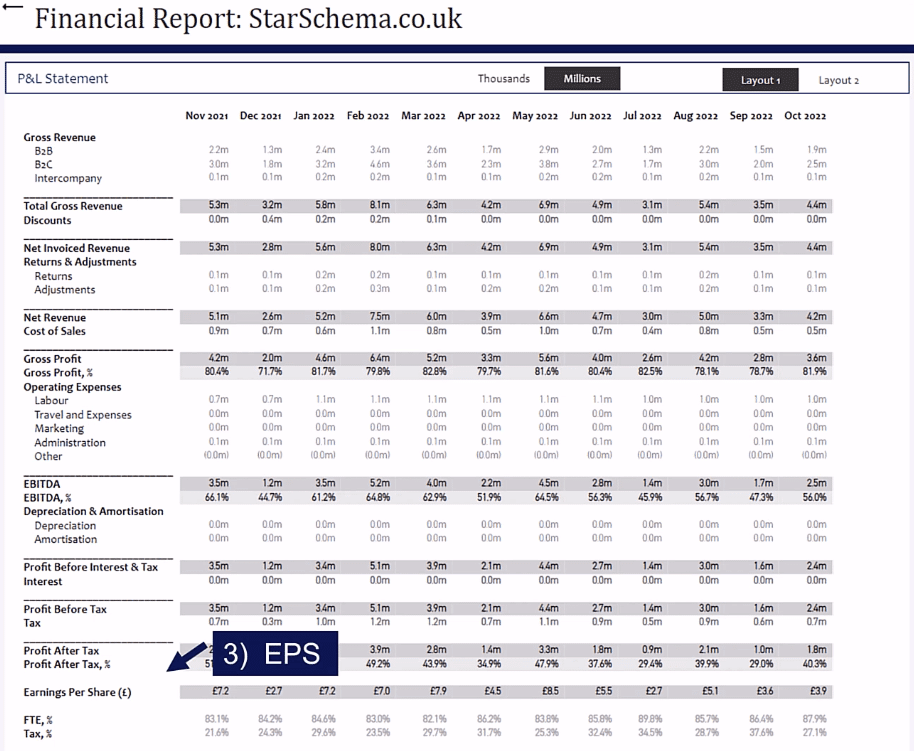
3. Earnings Per Share (EPS)
Earnings Per Share or EPS is a financial ratio that measures the amount of net income earned per share of common stock. It is calculated by dividing a company’s net income by the number of shares outstanding.

If you look at the financial statements of Fortune 500 companies, you’ll most likely see a row showing the EPS.
4. Callout
Most often, the internal management team in your organization will request to call out specific numbers in the P&L statements.
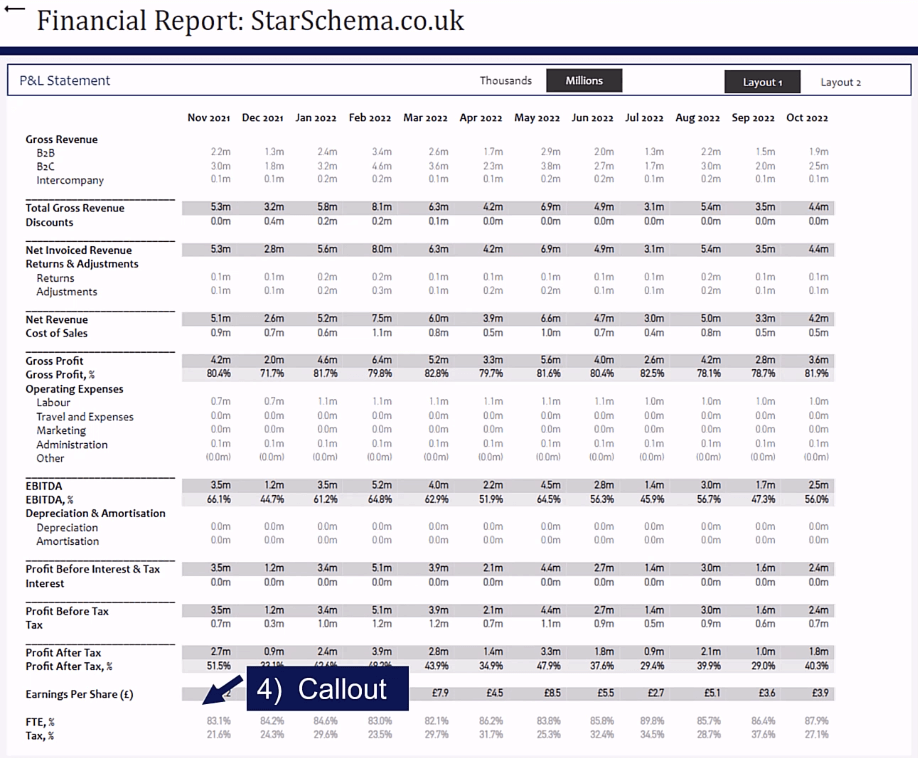
In this case, there are additional entries for the Full Time Equivalent percentage (FTE %) of the overall labor costs.
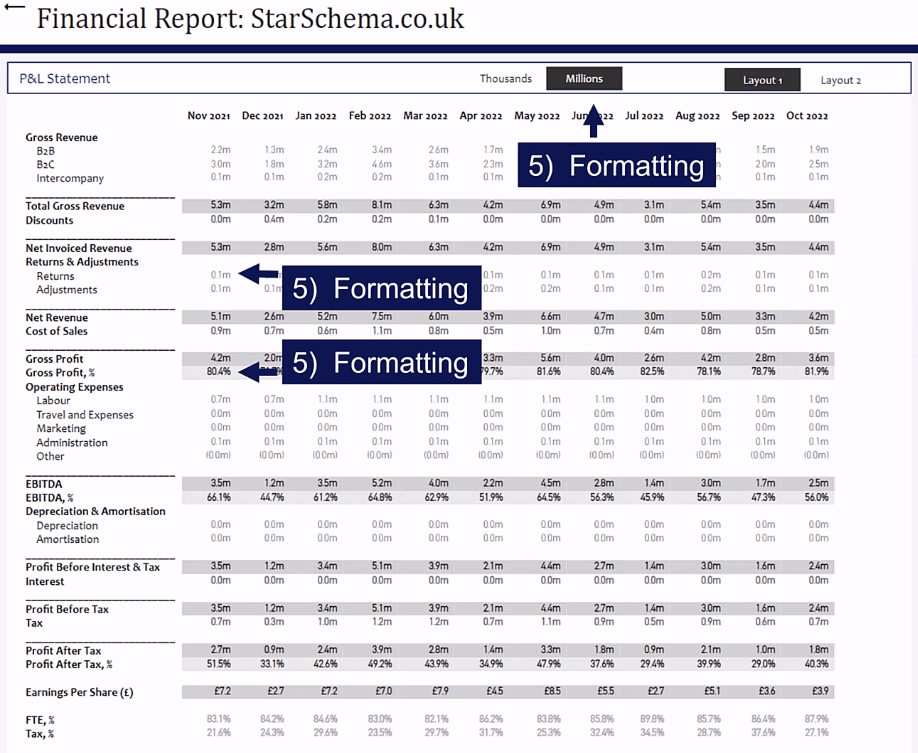
5. Formatting
You can apply different formatting options in P&L statements in Power BI.
Since Power BI allows you to transform your reports into dynamic financial statements, you can add in slicers that can switch the view from millions to thousands.
These are made possible with the use of calculation groups.
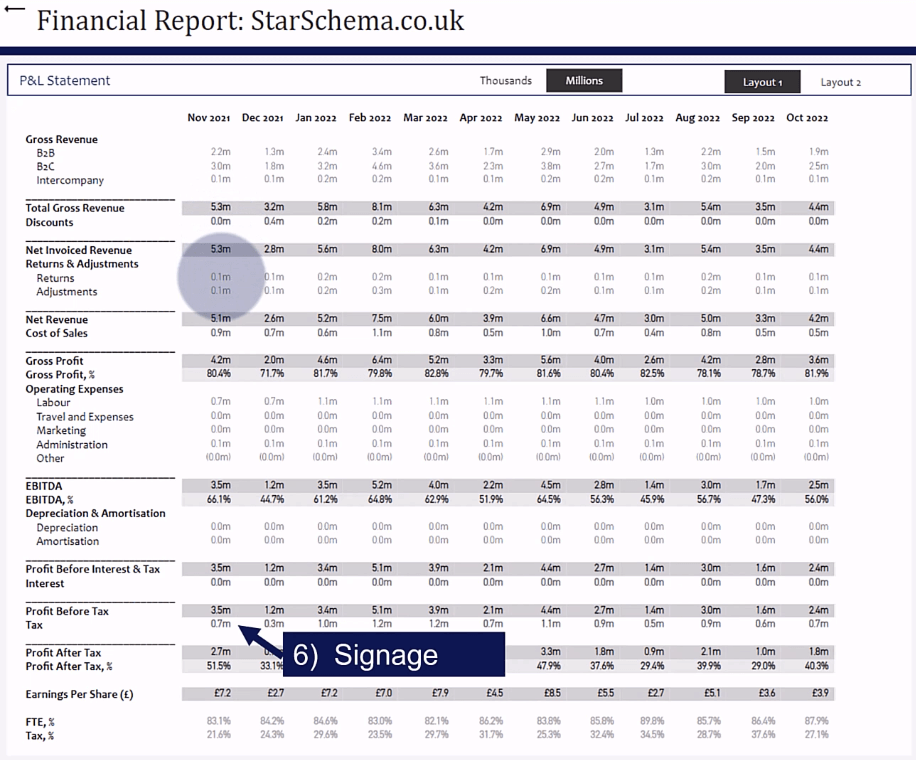
6. Signage
Signages are also integral parts in financial statements.
About 8 out of 10 organizations will want to show positive numbers even if some are being subtracted from a figure.
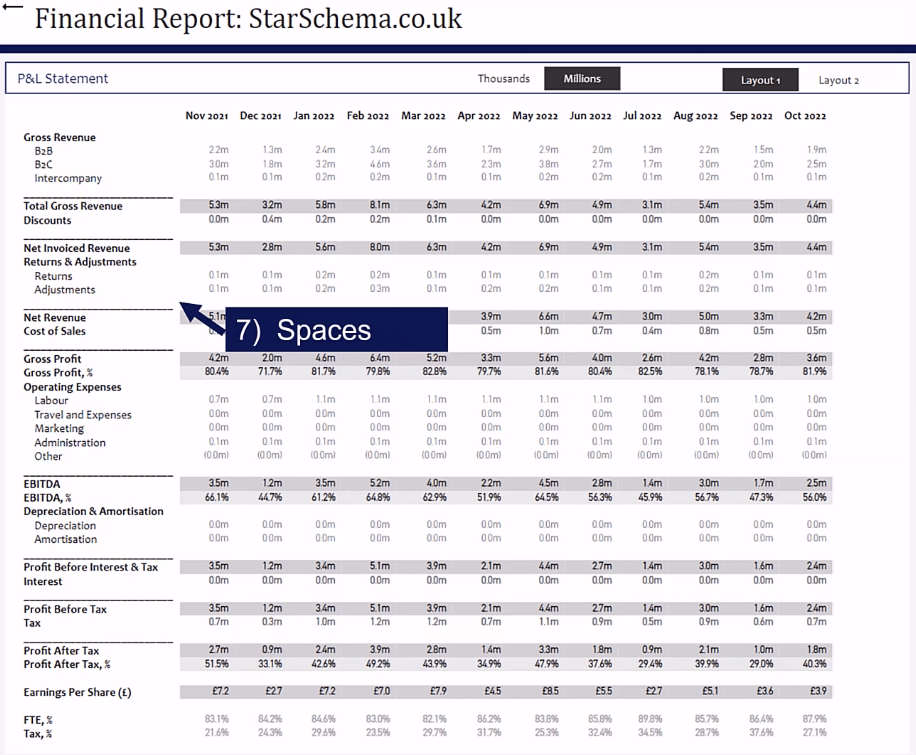
7. Spaces
Spaces are another minor formatting challenge that you’ll encounter when creating P&L statements in Power BI.
When displaying financial statements, it’s important to have the right spaces to separate elements and make it easy to read. If the spaces are missing or not where they should be, it can lead to misinterpretation of financial data.
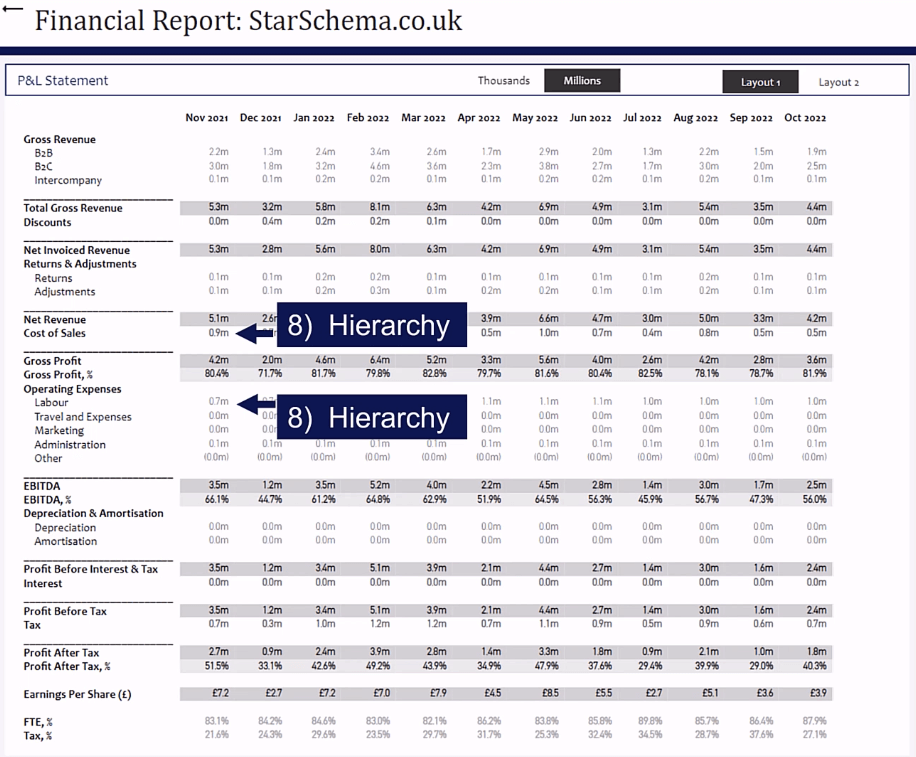
8. Hierarchy
A common hierarchy used in financial statements is ragged hierarchy.
A hierarchy shows the breakdown of an item into different levels of detail. For example, the Operating Expenses are broken down into their component parts, such as Labor, Travel and Expenses, Marketing, and Administration.
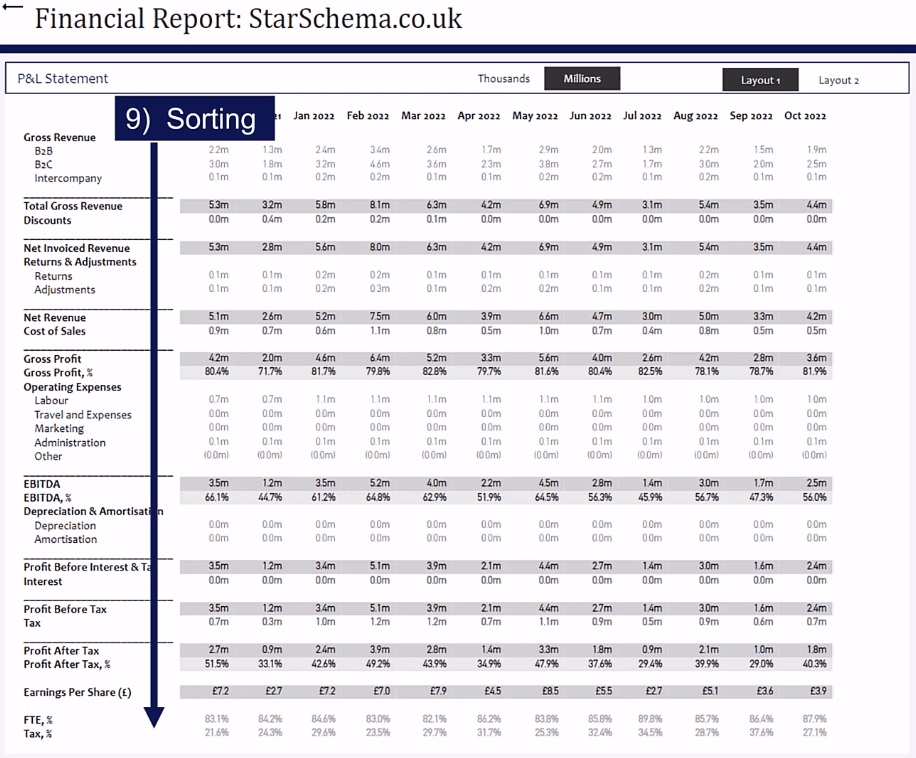
9. Sorting
Sorting the items within your financial statements is highly important. Note that items aren’t sorted alphabetically by default. They can also be sorted according to ascending or descending order with respect to the amount.
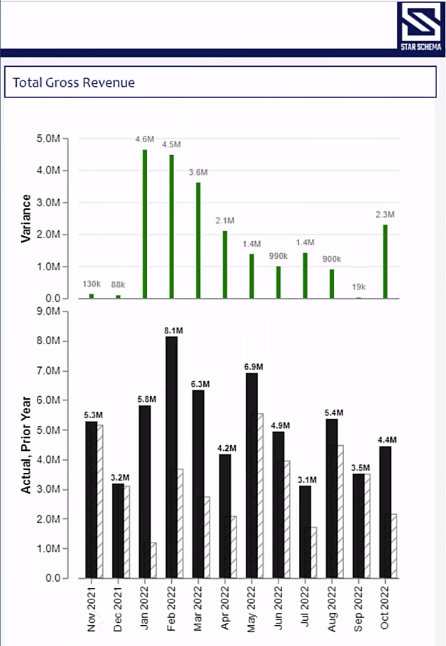
10. Analytics
The final part in a P&L statement is the analytics. Analytics, such as data visualizations, can help businesses to better understand their financial performance and identify areas for improvement.
In this example, the analytics section of the report is drilling down on the Total Gross Revenue.

Data Modeling In Power BI P&L Statements
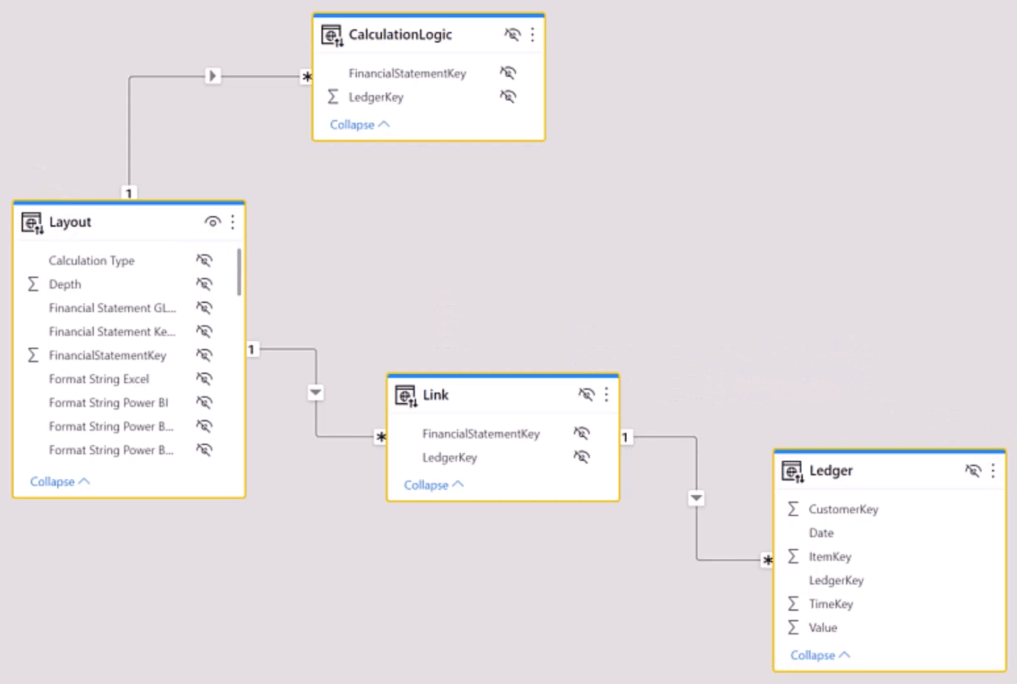
When modeling P&Ls, it’s best practice to use the Star Schema approach. A Star Schema is where your Fact Table is surrounded by multiple Dimensions Tables.
Moreover, when creating a data model in Power BI, you need to have a strong understanding of the VertiPaq Engine and Kimball principles of modeling.
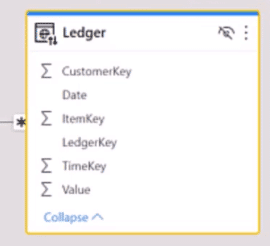
In this P&L statement data model, the Ledger Table contains information on the different values for each individual ledger key. This includes the Customer, Item, and Time Keys, among others.
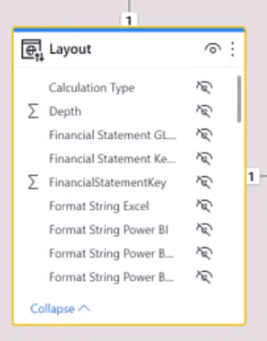
The Layout Table contains the stripped layout of the financial report in Power BI. It exactly shows how the financial statement will look like in the report.
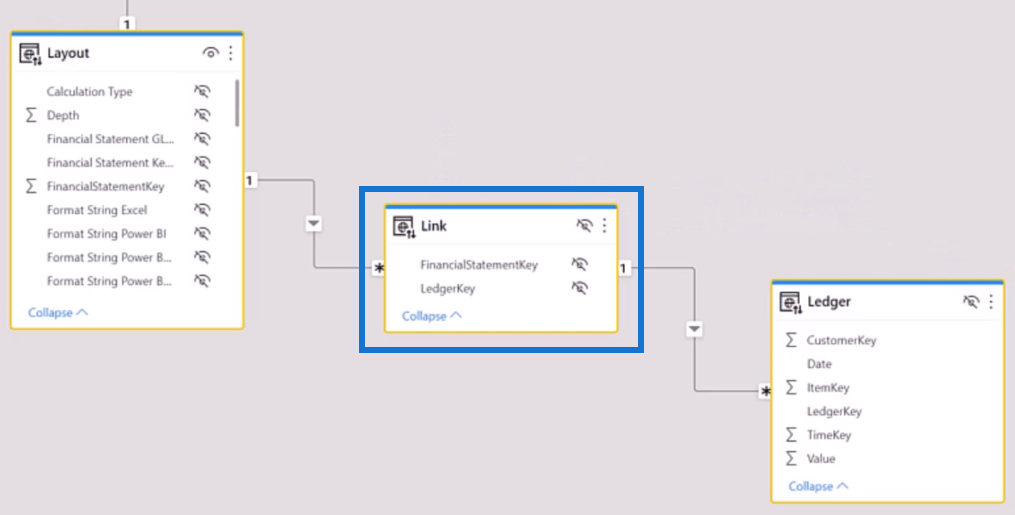
Meanwhile, the Link Table provides the bridge between the Layout Table and the actual Ledgers.
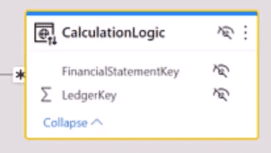
At the top of the data model is the Calculation Logic Table. It’s used to produce the various subtotals needed in the report.
Solutions To Power BI P&L Statement Challenges
Power BI P&L Solution #1: Sums Calculation Steps
To create the sample P&L, you need to start with the basics. The primary goal is to retrieve the sum of the general ledgers which is done by using the Layout Table.
In this case, the Gross Revenue for B2B and B2C are shown, along with their respective financial statement keys.
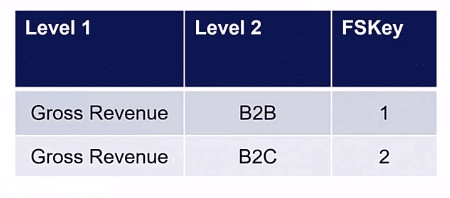
Keys are very important whenever you’re doing modeling within Power BI. These are known as prior keys or surrogate keys used to join or link tables together.
Next, the FSKey connects to the Link Table and retrieves a set of ledgers. These ledgers are then passed across the Facts Table.
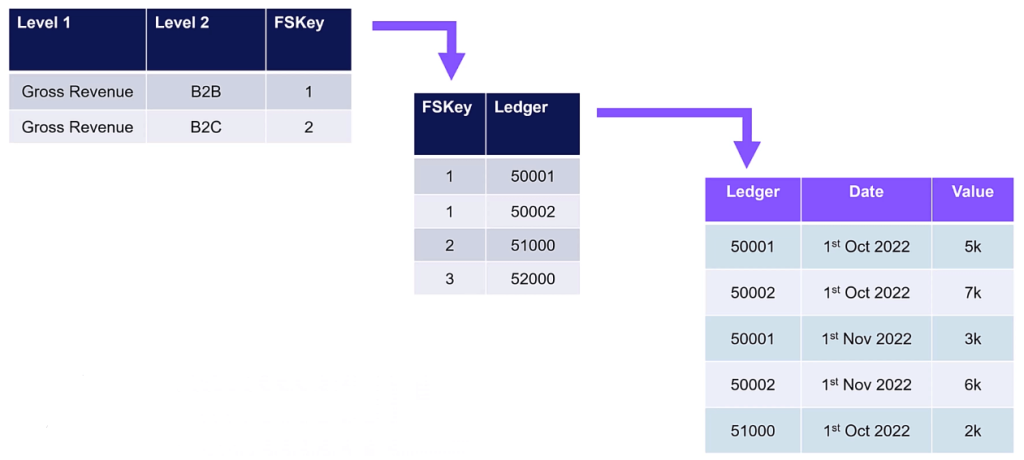
In this example, Power BI looks at the B2B entry and retrieves its FSKey. This key is then passed through the Link Table to retrieve the ledgers 50001 and 50002. From there, the Link Table goes through the ledgers and retrieves its corresponding Values.
Power BI P&L Solution #2: Subtotals Calculation Steps
Subtotals are slightly more complicated than Sums.
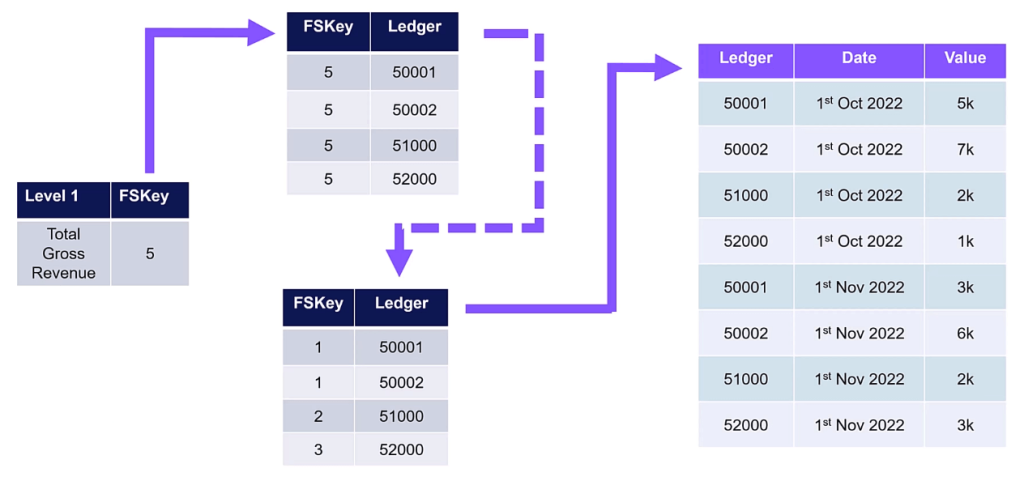
In this example, the subtotal for the Total Gross Revenue has an FSKey of 5. The Calculation Logic Table then lists all the ledgers under this key. This gives a huge amount of flexibility because you can define exactly which ledgers you want to sum up or aggregate.
Next, Power BI creates a virtual relationship from these ledgers down to the Link Table. And from there, it retrieves all the ledger data and values from the Facts Table.
Tabular Editor For Power BI P&L Statements
In the Tabular Editor, you can see the DAX code for the subtotal calculation.
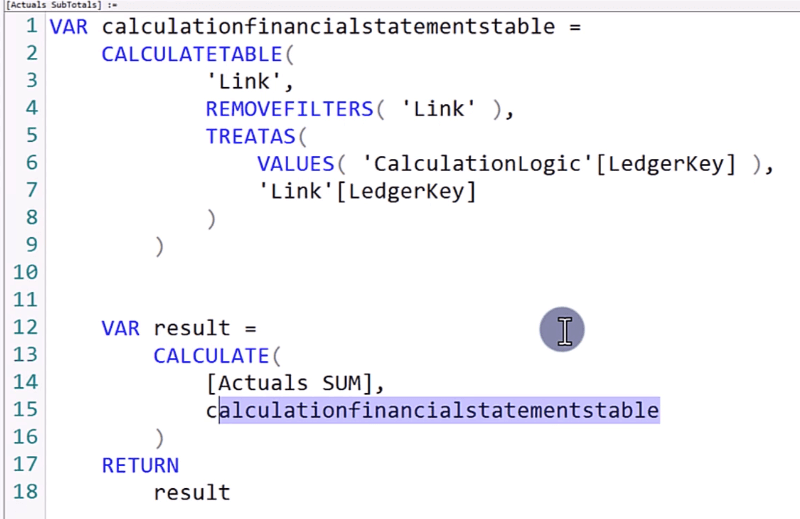
The first step is removing the filters using the REMOVEFILTERS function. Then, the relationship between the Layout and Link tables is removed and instead replaced with the relationship between the Calculation Logic and Link Tables using the TREATAS function.
The result is then generated using the CALCULATE function in the context of the calculation financial statements table.
The benefit of doing this is that you only need to write the DAX code once. You can then change the layouts or change the inputs into the file without having to rewrite the code.
As an example, let’s use the input file of the P&L statement.
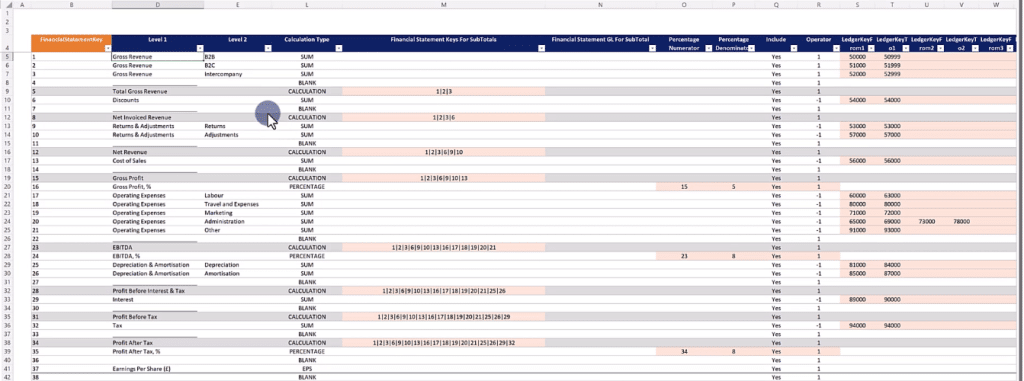
In the file, you can see that the FSKeys for the Total Gross Revenue are 1, 2, and 3. If you want to make changes to the subtotal calculation, you only need to add or delete an FSKey from the file.

This approach gives you a huge amount of flexibility because it can quickly move, change, and redo items without having to rewrite the DAX code.
Flexibility In Power BI P&L Statements
By putting an effort into the foundations of the solution, you don’t have to rework each time you want to make a change.
And flexibility is important when it comes to creating financial statements. You’re highly likely to encounter changes as you go. Companies want to move around their general ledgers from year to year. They also want to create different layouts.
They’ll also have different accounting standards. For instance, an IASS accounting standard might move to an IFRS accounting standard.
Things are constantly changing and constantly evolving. Therefore, having a solution which maximizes flexibility is the goal when it comes to financial statements.
***** Related Links *****
How To Create Profit And Loss (P&L) Statements In Power BI
Power BI Finance Dashboard Examples
Power BI Financial Reporting Tips and Techniques For Accounting & Finance
Conclusion
Creating P&L statements in Power BI can be challenging. Data quality, formatting, visualization, and security are all important considerations when creating a P&L statement, and any issues in these areas can impact the accuracy and usefulness of the financial report.
However, by following the best practices and using the solutions presented in this tutorial, you can overcome these challenges and create P&L statements that are accurate, clear, and easy to understand. These will be invaluable for any business looking to make informed, data-driven decisions.
All the best,
Chris Barber


